

MT4:
https://www.mql5.com/en/market/product/178398/
MT5:
https://www.mql5.com/en/market/product/178399/

Abiroid Genesis Matrix Scanner: Complete User Guide
This strategy uses four complementary indicators working together to identify trend momentum: TVI, CCI, T3, GannHiLo
and when all four agree, the signal carries considerably more weight than any single indicator could on its own.
This scanner takes that concept and applies it across multiple pairs and timeframes simultaneously, surfacing only the moments worth paying attention to.
Feature Overview
- Displays the state of all four Genesis Matrix indicators as color-coded squares
- "%" readout showing how many of the four indicators are in agreement
- Signal type label that distinguishes a fresh signal, an ageing signal, and a stale one
- Optional Dragon Filter: an EMA-channel trend filter that must agree before a signal is considered valid
- MA Stack trend arrows showing whether the moving average stack on the current timeframe and its higher timeframes are aligned
- Pullback-aware entry detection: the scanner watches for recent market hesitation before flagging an entry opportunity
- Power Breakout detection: identifies institutional momentum through key price levels ($00, 25, 50, 75 pip levels)
- 24/7 operation with spread guard: automatically skips pairs exceeding maximum spread threshold
- HTF (Higher Timeframe) trend display: shows MA direction for up to two higher timeframes per cell
- Fully configurable indicator periods (TVI, CCI, T3, Gann, Dragon)
- Three matching modes: require all four to agree, any three, or any two
How it Works:
The four indicators used here are:
- TVI (Tick Volume Index): measures whether buying or selling volume is dominating
- CCI (Commodity Channel Index): measures how far price has moved relative to its average, identifying momentum
- T3 (Triple Exponential Moving Average): a smooth, responsive trend line that shows whether price is generally rising or falling
- Gann HiLo Activator: a channel-based indicator that flips direction when price breaks out of a moving average channel built on highs and lows
Each of these produces a directional verdict: bullish, bearish, or neutral. The scanner adds them up and shows you the result visually as colored squares in the dashboard.
Reading the Dashboard
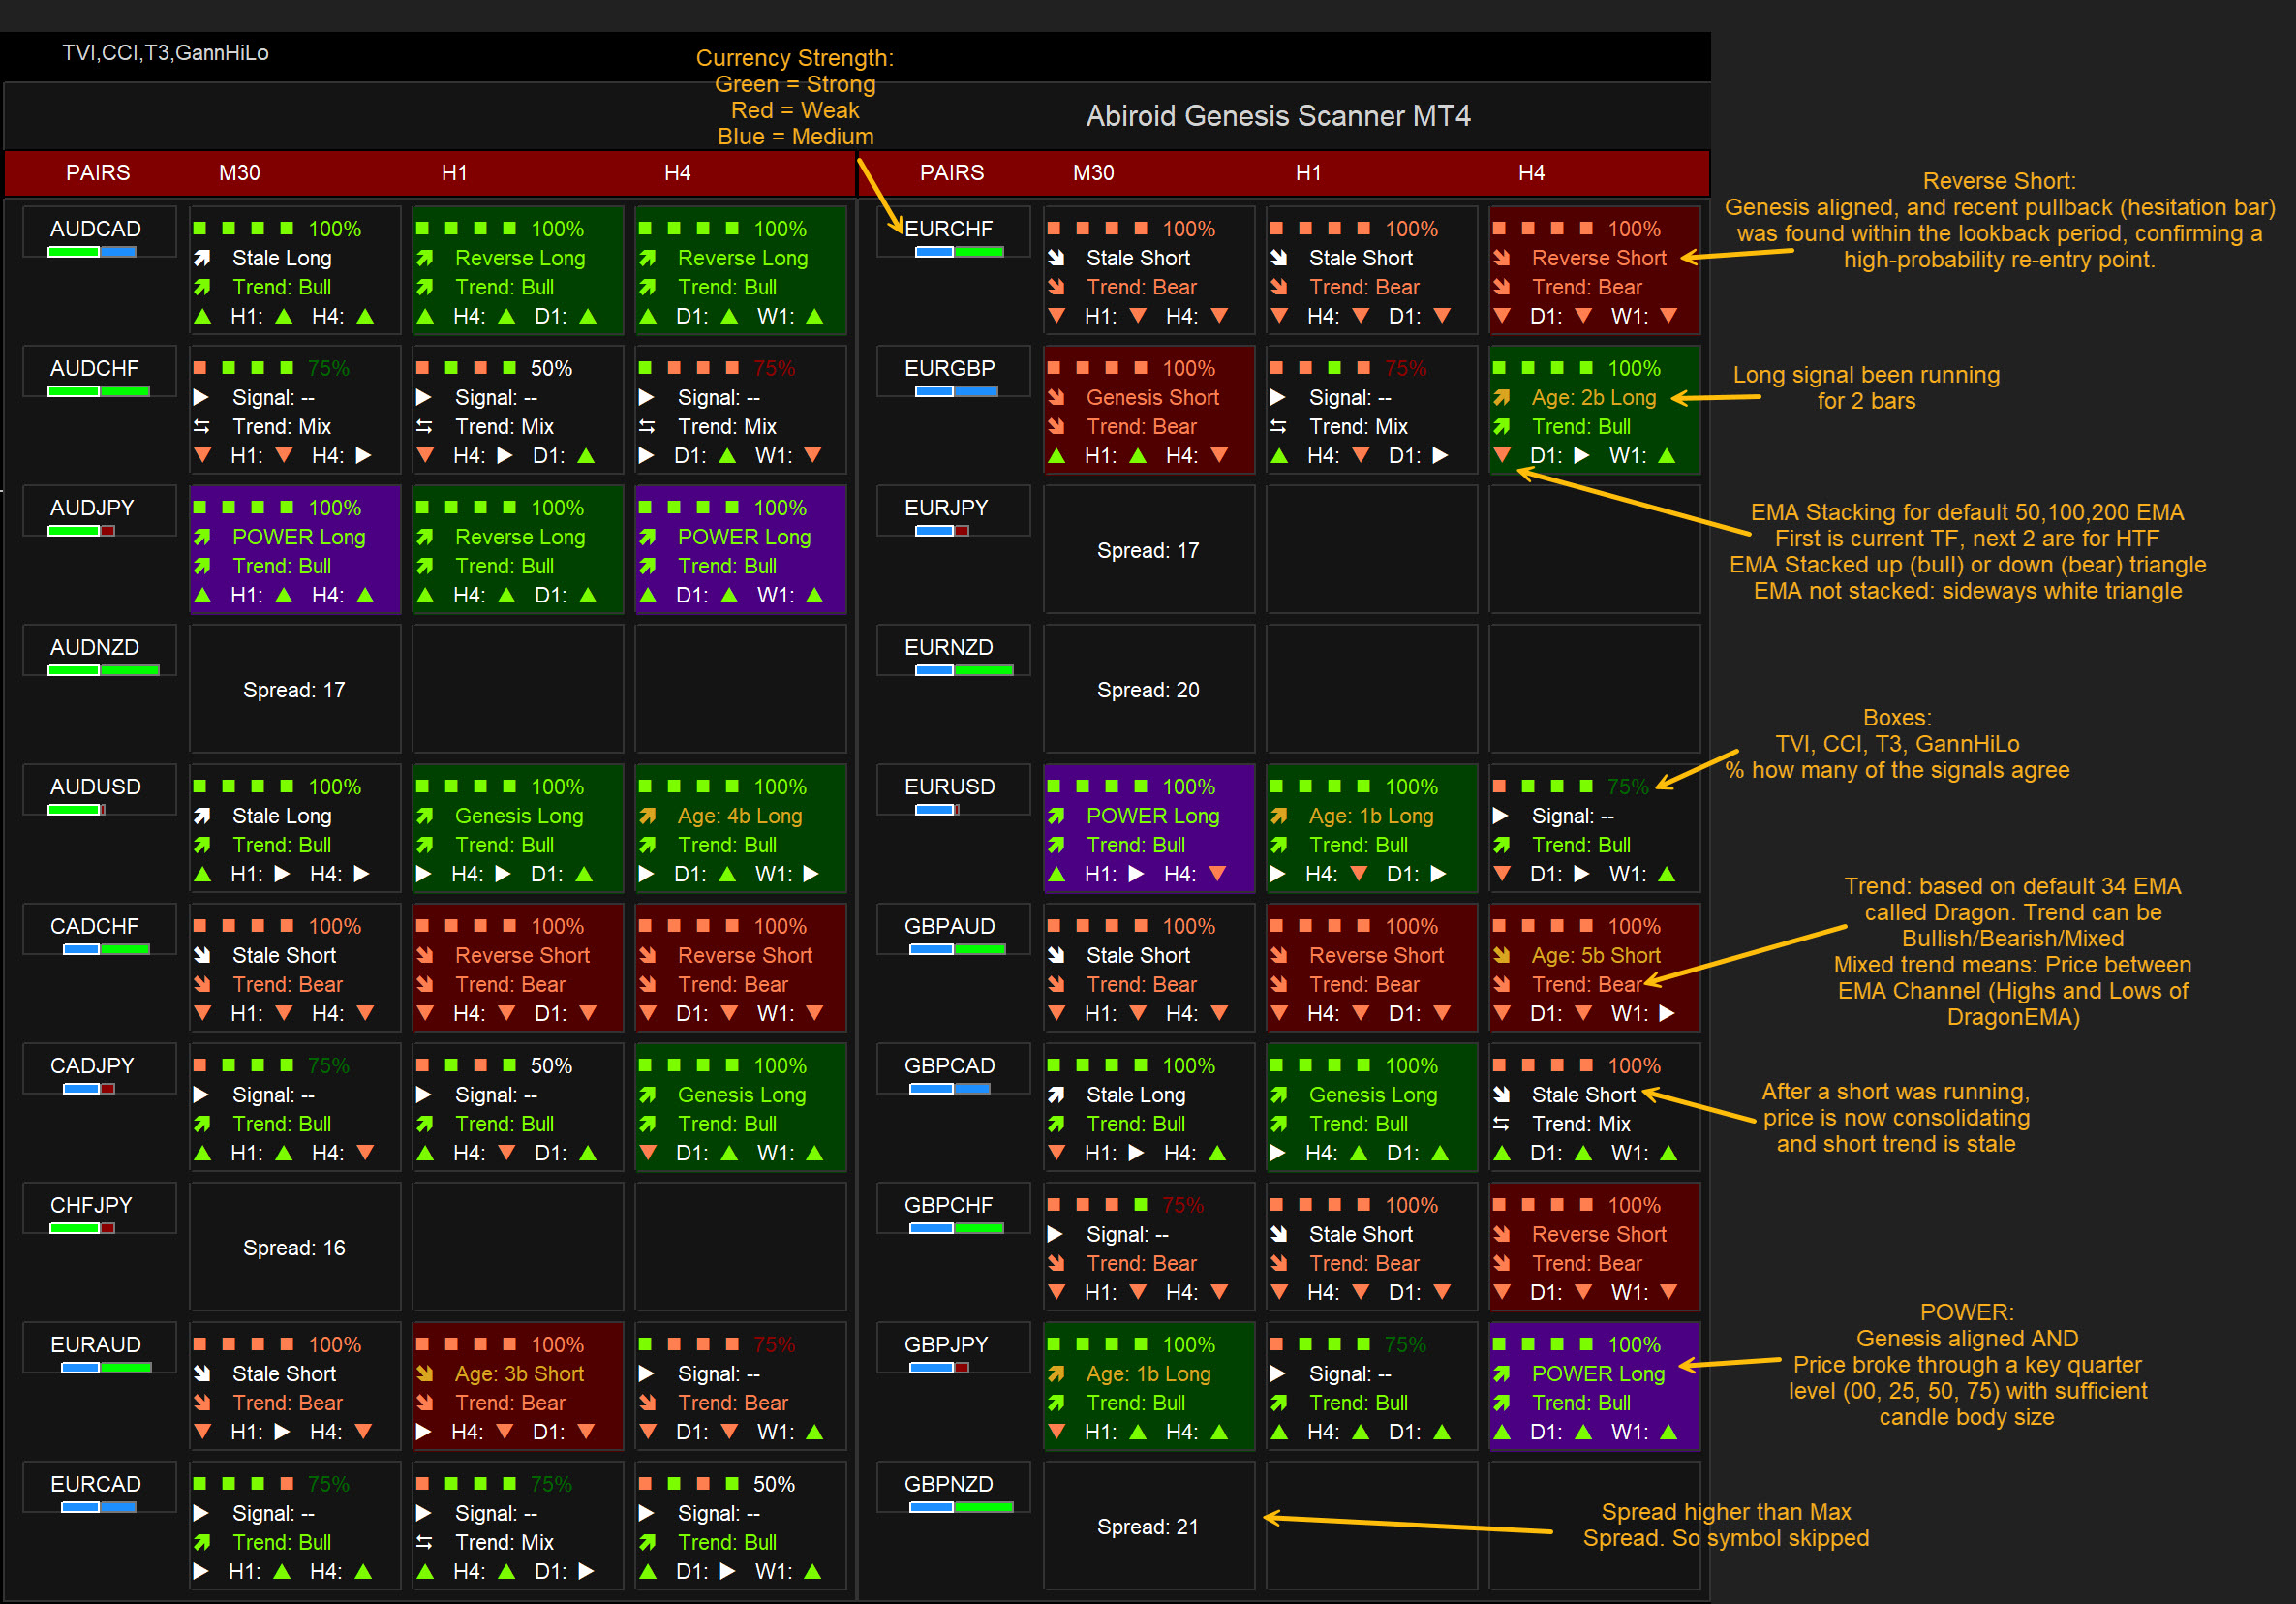
When you attach the scanner to a chart, it builds a grid: pairs down the left side, timeframes across the top. Each cell in that grid contains a compact summary for that pair/timeframe combination. Here is what you will see inside each cell:
Row 1: Matrix Squares and Energy %
The top row contains four coloured squares representing TVI, CCI, T3, and Gann HiLo (left to right), followed immediately by the Energy % value.
- Green square: that indicator says bullish
- Red/Salmon square: that indicator says bearish
- Energy %: how many indicators are currently agreeing (e.g., 100% means all 4 match).
Row 2: Signal Type
This line tells you the current state of the signal in plain text:
- "POWER Long" / "POWER Short": An institutional-grade level breakout was detected. Price broke through a key quarter level (00, 25, 50, 75) with sufficient candle body size.
- "Reverse Long" / "Reverse Short": A pullback reversal signal. The Genesis Matrix is aligned AND a recent pullback (hesitation bar) was found within the lookback period, confirming a high-probability re-entry point.
- "Genesis Long" / "Genesis Short": A fresh Genesis Matrix signal is aligned (all or most four indicators agree).
- "Age: Xb Long/Short": The signal has been live for X bars. Still valid but not brand new.
- "Signal: --": No Genesis signal present on this pair/timeframe right now.
Row 3: Dragon Filter (optional)
If the Dragon Filter is enabled, this row shows whether price is above or below the EMA channel:
- Up arrow + "Trend: Bull": Price is above the Dragon EMA channel: bullish bias
- Down arrow + "Trend: Bear": Price is below the Dragon EMA channel: bearish bias
- "Trend: Mix": Price is inside the channel: no clear bias
Row 4: MA Stack Trend Arrows
The final row shows the direction of the MA stack on the current timeframe, followed by small arrows for each higher timeframe defined in your HTF settings.
- ▲ (up arrow "p"): Moving averages are stacked bullish on this timeframe
- ▼ (down arrow "q"): Moving averages are stacked bearish
- "u" symbol: Moving averages are tangled or mixed
Example: you might see ▲ H1: ▲ H4: ▼ on an M15 cell. That means M15 MAs are bullish, H1 MAs are bullish, but H4 MAs are bearish. In that case, the trade would be going against the H4 trend: worth noting.
How to Use It
The Basic Signal Flow
The cleanest way to use this scanner is to follow a simple checklist before taking any trade:
- All four squares are the same colour (or at least three, depending on your mode)
- The Dragon Filter agrees with the signal direction (if you have it enabled)
- The MA Stack arrows are pointing in the same direction on both the current and higher timeframe(s)
- The signal is new or very young (ideally "Age: 0b" or "Age: 1b")
- The pair's spread is within your configured threshold (scanner auto-skips high-spread pairs)
If all of those line up, that is a high-quality setup. You act on it. If two or three of those are missing, you skip it. The scanner operates 24/7, so timing around session hours is optional.
Signal Priority and Quality Tiers
The scanner produces three distinct signal tiers, ranked by confidence:
Tier 1: POWER Breakout (Highest Conviction)
"POWER Long" or "POWER Short": Institutional-grade momentum detected through a key level breakout. Price closed beyond a $00, 25, 50, or 75 pip level with sufficient candle body size (configurable per timeframe). These signals carry the most weight and often mark the start of significant moves.
Tier 2: Pullback Reversal (High Quality)
"Reverse Long" or "Reverse Short": A fully aligned Genesis Matrix combined with evidence of a recent pullback (hesitation bar within the lookback period). This label confirms that you are not chasing a move that has already run; instead, you are catching the resumption after a brief rest. This is the highest-quality entry the Genesis system typically produces.
Technical Note: Your scanner tracks this state as a distinct signal multiplier internally (a 3x multiplication of the direction vector) to ensure pullback entries remain cleanly separated from standard trend extensions (1x) or power level breakouts (2x). This separation prevents your pullback signals from getting overwritten or confused by ongoing trend momentum.
Tier 3: Standard Genesis Signal (Base Quality)
"Genesis Long" or "Genesis Short": The matrix is aligned but no recent pullback was detected. The move may already be underway. Still tradeable, but less ideal entry conditions than Tier 1 or Tier 2.
Signal Quality Filtering with MA Stack
All three signal tiers can be further filtered using the Alert Only MA Filter and Alert Only MA HTF settings. When these are enabled, signals will only trigger alerts and highlights if the MA Stack on the current timeframe and/or higher timeframes align with the signal direction. This provides strong confluence confirmation.
Using Price Levels as Confluence
The Genesis Matrix is a momentum-based system. It tells you direction very well. What it does not tell you is where price is likely to pause or reverse. For that, combining it with support and resistance levels is highly effective.
Some approaches that work well alongside this scanner:
- Whole and half price levels (e.g. 1.0800, 1.0850, 1.0900 on EURUSD): these are psychologically significant levels where price often stalls briefly before continuing. A Genesis signal forming at or just off one of these levels, in the direction of the breakout, tends to follow through well.
- Weekly and daily pivots: classic pivot points (especially R1/S1 and the central pivot) act as natural areas of interest. A Genesis signal forming as price bounces off a daily S1 in bull alignment is a much stronger setup than a signal that appears mid-range.
- Session open levels: the London and New York open levels from the previous day are watched by a large number of traders. Genesis signals appearing around these levels during the early session tend to be particularly clean.
The idea is simple: use the Genesis Matrix to confirm direction and momentum, and use price levels to confirm that you are entering at a sensible location rather than randomly mid-move.
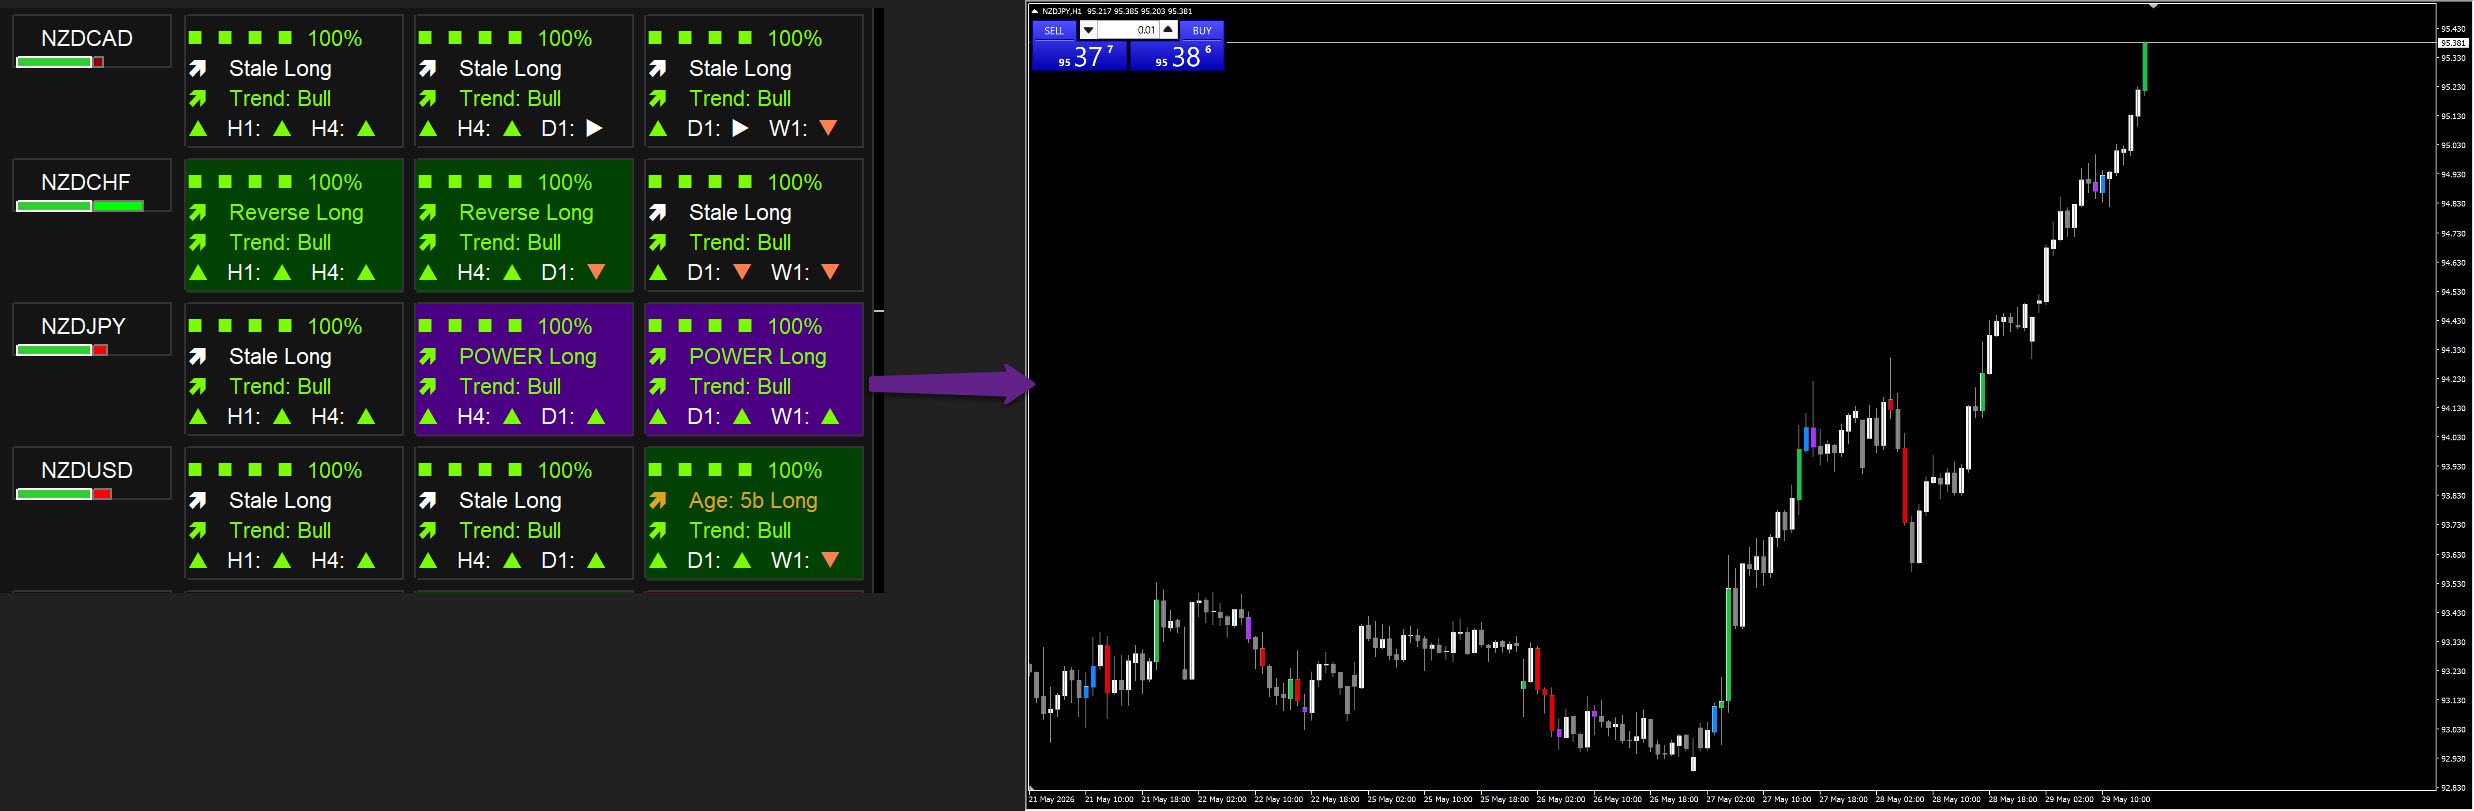
Stops and Targets
Stop Loss Placement
The Genesis Matrix does not give you a built-in stop level, but there are a few natural approaches:
- Beyond the Dragon Channel: if you are using the Dragon Filter, placing your stop on the opposite side of the Dragon EMA channel is logical. If price re-enters the channel on the wrong side, the trend assumption is invalidated.
- Beyond the nearest swing high or low: find the most recent swing point before the signal bar and place your stop a few pips beyond it.
- Fixed ATR-based stop: use 1x or 1.5x ATR on the timeframe you are trading. This adapts the stop to current volatility without requiring manual adjustment per pair.
Take Profit
- Next significant price level: the first whole number, half level, or pivot above/below your entry is a natural first target.
- When the matrix flips: stay in the trade until any one of the four squares changes colour and the energy drops. This is a trailing approach that captures extended moves.
- When "Stale" label appears: the stale label is a reasonable signal to begin tightening your stop or to exit at least part of the position.
- Risk/reward minimum 1:1.5: whatever your stop distance, try to ensure your target is at least 1.5x that distance away before entering.
Cheat Sheet: Quick Reference by Trading Style
Scalping (M1 – M5)
| Setting | Recommended Value |
|---|---|
| Genesis Mode | All Checked (all 4 must agree) |
| Dragon Filter | On |
| Stale Signal Bars | 3 |
| Pullback Lookback | 3–5 bars |
| Max Spread | 8–15 (depends on your broker) |
| Alert On Power | On |
| Alert On Genesis | On |
| Alert Only MA Filter | On (current TF MA must align) |
| Alert Only MA HTF | On (HTF MA must align) |
| HTF to watch | M15 and H1 |
| Best label to trade | "POWER" or "Reverse" |
| Stop | Beyond Dragon channel or 1x ATR |
| Target | Next half or whole price level |
On very short timeframes, false signals are common. The "POWER" and "Reverse" labels with full Dragon and HTF agreement significantly reduce the noise. Enable both MA Filter options to ensure Genesis signals align with the overall trend structure. Patience is the main skill required: most M5 cells will show nothing worth trading.
Intraday Trading (M15 – H1)
| Setting | Recommended Value |
|---|---|
| Genesis Mode | All Checked or Any 3 |
| Dragon Filter | On |
| Stale Signal Bars | 5–8 |
| Pullback Lookback | 5 bars |
| Max Spread | 8–12 |
| Alert On Power | On |
| Alert On Genesis | On |
| Alert Only MA Filter | Off (allow some flexibility) |
| Alert Only MA HTF | On (respect HTF alignment) |
| HTF to watch | H1 and H4 for M15 trades, H4 and D1 for H1 trades |
| Best label to trade | "POWER", "Reverse", or "Genesis" |
| Stop | Swing high/low or 1.5x ATR |
| Target | Daily pivot, round number, or 2x stop distance |
Swing Trading (H4 – D1)
| Setting | Recommended Value |
|---|---|
| Genesis Mode | Any 3 (more flexibility) |
| Dragon Filter | On or Off (D1 Dragon tends to be slow) |
| Stale Signal Bars | 10–20 |
| Pullback Lookback | 7–10 bars |
| Max Spread | 10–20 (less critical for swing trades) |
| Alert On Power | On (catch early moves) |
| Alert On Genesis | On |
| Alert Only MA Filter | Off (swing trades have flexibility) |
| Alert Only MA HTF | Off or On (your preference) |
| HTF to watch | D1 and W1 |
| Best label to trade | Fresh "Genesis Long/Short" or Power Breakout |
| Stop | Beyond weekly high/low or key structure level |
| Target | Key weekly level or 2–3x stop distance |
Max Spread filter will help you avoid bad trades when market is especially slow nearing weekend, by skipping the whole pair:

How Each Calculation Works
This section explains what each indicator is actually computing, without the maths-heavy version. Understanding the logic helps you appreciate when a signal is genuinely meaningful and when it might be borderline.
TVI: Tick Volume Index
TVI asks a simple question: is volume flowing into up-moves or down-moves right now?
For each bar, it looks at whether the close was higher or lower than the previous close. If higher, the tick volume for that bar is counted as "buying volume." If lower, it is "selling volume." These two streams are then smoothed through three layers of exponential averaging: first with period R, then with period S, then with period U. The final output is the difference between the smoothed buying and selling flows.
- Positive TVI → buyers are in control → green square
- Negative TVI → sellers are in control → red square
TVI is particularly sensitive to volume surges. A large momentum candle with high volume will move TVI sharply. It is a good early-warning indicator when a move has genuine volume behind it.
CCI: Commodity Channel Index
CCI measures how far the current typical price (average of high, low, close) has deviated from its recent average. When price is running significantly above its mean, CCI is positive. When it is running below, CCI is negative.
- CCI above zero → bullish momentum → green square
- CCI below zero → bearish momentum → red square
The default period is 20, meaning it looks back 20 bars. A shorter period makes it more reactive; a longer period makes it smoother and slower.
T3: Triple Exponential Moving Average
T3 is a type of moving average designed to be both smooth and fast-reacting. Unlike a simple EMA, T3 runs through six layers of exponential smoothing combined with a "hot coefficient" (the b parameter). The coefficient controls how aggressively the MA chases price: higher values make it more responsive, lower values make it smoother.
The scanner looks at whether the T3 value is higher or lower than it was one bar ago:
- T3 rising → trend is up → green square
- T3 falling → trend is down → red square
- T3 flat → neutral → grey square
With a default coefficient of 0.618 (the golden ratio), T3 sits between a reactive and a smooth setting: a popular community default for this exact reason.
Gann HiLo Activator
The Gann HiLo Activator builds a channel using a Simple Moving Average of highs and a Simple Moving Average of lows, both over the configured period. It then checks where price is relative to that channel:
- Close above the SMA of Highs → bullish → green square
- Close below the SMA of Lows → bearish → red square
- Close inside the channel → uses the previous bar's position to avoid flipping back and forth
That last point (the "signal bleeding" guard) is important. Without it, the indicator would flip on every bar that closes inside the channel, generating noise. By checking the previous bar's state when price is inside the channel, the scanner holds its last confirmed direction until price makes a decisive move out of the channel.
Dragon Filter
The Dragon Filter works on the same principle as the Gann HiLo, but uses Exponential Moving Averages instead of Simple ones, and uses a longer period (default 34). The longer period makes it a structural trend filter rather than a short-term directional indicator.
- Close above the Dragon EMA High → price is in bullish territory → "Trend: Bull"
- Close below the Dragon EMA Low → price is in bearish territory → "Trend: Bear"
- Close inside the Dragon channel → "Trend: Mix": neither side has asserted itself
When the Dragon Filter is active, a Genesis signal is only considered valid if the Dragon Filter agrees. A fully green Genesis Matrix but a bearish Dragon Filter means the short-term momentum is fighting the medium-term trend: those setups tend to be more prone to failure.
Power Breakout (Level Breakouts)
The Power Breakout system detects institutional momentum through key price levels: the $00, 25, 50, and 75 pip levels. When price breaks through one of these levels with sufficient candle body size (configurable per timeframe), a Power Breakout is flagged.
- Power Breakout Long: a bullish candle with adequate body size closes above a key level
- Power Breakout Short: a bearish candle with adequate body size closes below a key level
- Power Breakouts are displayed with their own highlight colour (default: Indigo) and can trigger independent alerts
Power Breakouts are often institutional entries. They may appear alone (without Genesis Matrix agreement) but carry meaningful weight, especially when combined with Dragon Filter confirmation and MA Stack alignment. Use Alert On Power and Highlight On Power to control how these signals are presented.
MA Stack
The MA Stack checks a set of moving averages of different periods (as configured in the MAStack library) and evaluates whether they are arranged in order from fastest to slowest: all above each other for a bull stack, or all below each other for a bear stack.
- All MAs stacked in ascending order → bullish stack → ▲ arrow
- All MAs stacked in descending order → bearish stack → ▼ arrow
- Mixed arrangement → ● (neutral) symbol
This is displayed for the current timeframe and for each higher timeframe configured. When the local stack and both HTF stacks all agree with your Genesis signal direction, that is the strongest possible alignment the scanner can show.
Pullback Detection
The "Reverse" (Pullback Reversal) label requires evidence that the market had a recent pause. The scanner looks back a configurable number of bars (default 5) from the current bar, and checks whether any of those bars had a Genesis status of zero (neutral) or opposite to the current direction. If it finds one, it considers a pullback to have occurred.
This means the scanner is not just reacting to the current state: it is asking: "did this trade have a moment of hesitation recently that I could have entered on?" If yes, there may still be a good entry available now.
Settings Explained

Scanner Settings
- Refresh After Ticks: how many ticks to wait between each recalculation. Higher values use less CPU. Set to 0 to recalculate on every tick (not recommended for large scanner grids).
- Maximum Past Bars: how far back the scanner looks when checking signal age. 1000 bars is plenty for most timeframes.
- Shift Bars: which bar to analyse. 0 means the current forming bar; 1 means the last closed bar. For confirmed signals, use 1. For real-time tracking, use 0.
- Max Spread: maximum allowed spread in points. Pairs exceeding this threshold are automatically skipped to protect against thin liquidity. When skipped, intensive indicator calculations are completely bypassed for that instrument, and the scanner replaces the first timeframe cell with a clear text warning (e.g., "Spread: 25") over your default panel background color.

Genesis Matrix Settings
- Matrix Indicator Count: how many indicators are in the matrix (currently always 4). Keep this at 4 unless you know what you are adjusting.
- Genesis Matching Mode
- All Checked: all four indicators must agree. Highest quality, fewest signals.
- Any 3 Matched: three of four must agree. More signals, slightly noisier.
- Any 2 Matched: two of four agree. Many signals, most aggressive mode: best used on higher timeframes where you want early warning.
- Use Dragon Filter: enables or disables the Dragon EMA channel as a trend confirmation layer. Recommended on.
- Stale Signal Bars: after how many bars does a signal get labelled "Stale"? After this many bars, the label changes and the background colour returns to neutral.
- TVI R / S / U Periods: the three smoothing periods for the Tick Volume Index. Default 12/12/5. Increasing all three makes TVI slower and smoother.
- T3 Period: the base period for the T3 moving average. Default 8. Lower values are more reactive.
- T3 Hot Coefficient (b): controls T3 reactivity. Default 0.618. Range is 0 to 1; higher values make T3 more aggressive.
- Gann HiLo Period: the SMA period for the Gann channel. Default 10. Lower = faster flips.
- CCI Period: the lookback period for CCI. Default 20.
- Dragon Filter EMA Period: the EMA period for the Dragon channel. Default 34. This is a structural filter: larger periods work better.
- Entry Pullback Max Lookback Bars: how many bars back the scanner checks for a recent pullback when deciding to show the "Reverse" (Pullback Reversal) label. Default 5.
Colour Settings
- Bull Strong Text Colour: colour used for 4/4 bullish alignment text (default: bright green)
- Bull Weak Text Colour: colour used for 3/4 bullish alignment text (default: green)
- Bear Strong Text Colour: colour used for 4/4 bearish alignment text (default: salmon)
- Bear Weak Text Colour: colour used for 3/4 bearish alignment text (default: red)
- Neutral Text Colour: colour used when there is no clear signal
- Warning Colour: the gold/amber colour used for ageing signals
- Bull BG Colour: background colour of the dashboard cell when a new bullish signal appears
- Bear BG Colour: background colour of the dashboard cell when a new bearish signal appears

Alert and Highlight Settings
- Alert On Power: when enabled, the scanner sends alerts when Power Breakouts are detected (institutional momentum through key levels).
- Alert On Genesis: when enabled, the scanner sends alerts when new Genesis Momentum signals appear (age 0).
- Highlight On Power: when enabled, the dashboard background highlights when Power Breakouts are detected.
- Highlight On Genesis: when enabled, the dashboard background highlights when Genesis signals appear and are young.
- Alert Only MA Filter: when enabled, Genesis signals only alert/highlight if the current timeframe's MA Stack matches the signal direction. If disabled, all Genesis signals alert regardless of MA alignment.
- Alert Only MA HTF: when enabled, Genesis signals only alert/highlight if the higher timeframes' MA Stacks match the signal direction. If disabled, HTF alignment is not required for alerts.
Example: If Alert Only MA Filter is on and Alert Only MA HTF is on, a Genesis "Long" signal will only trigger an alert if the current TF MA is bullish AND the HTF MA is bullish. This provides strong confluence filtering. Alert type (popup, email, push) is controlled by the standard Alerts include settings.
Power Breakout Settings
- Enable Level Power Breakout: toggles the Power Breakout detection system on or off.
- Min Breakout Candle Body (Points): minimum candle body size required for a breakout to be considered institutional. Format is a multi-value string: M1=3,M5=7,M15=15,M30=25,H1=40,H4=80,D1=200 . These values are in pips (not raw points). The scanner automatically handles digit conversion for both 3-digit and 5-digit quotes. Reading this: "On M1, require at least 3 pips of body. On M5, at least 7 pips," etc. Adjust these values based on your broker's spread and volatility profile.
- Dashboard Highlight Color (Power Break): the colour used to highlight Power Breakouts (default: Indigo).
HTF MA Alignment Settings
- HTF Timeframes (HTF_TF_Str): a comma-separated list that maps each chart timeframe to its higher timeframe context. Default format:
M5=M15|H1, M15=H1|H4, M30=H1|H4, H1=H4|D1, H4=D1|W1, D1=W1|MN1
Reading this: "When looking at an M5 chart, show the MA stack for M15 and H1." You can customise this to your preference. You can add or remove timeframe mappings freely using the same format. The MA Stack is always displayed in the dashboard, but Alert Only MA HTF can be used to gate alerts based on higher timeframe alignment.
Common Patterns to Watch For
The Power Breakout Trade (Highest Conviction)
You see a "POWER Long" or "POWER Short" label. Price has just sliced through a key quarter level with sufficient body size. Dragon Filter agrees. This is an institutional entry point and should be treated with high priority. The move often follows through decisively.
The Pullback Reversal Setup
You see a "Reverse Long" or "Reverse Short" label. The Genesis Matrix is aligned AND a recent pullback bar was detected. MA Stack arrows are in agreement. This is a textbook high-probability entry. The pullback filter ensures you are catching momentum as it resumes, not chasing late.
The Clean Stack Trade
All four squares the same colour, Dragon agrees, local MA stack matches, both HTF arrows match. Signal is fresh (showing "POWER", "Reverse", or "Genesis"). This is the cleanest pattern the scanner produces. These are relatively rare: when they appear, they deserve attention.
The HTF Conflict Skip
Genesis and Dragon agree, but the H1 or H4 arrow is pointing the opposite way. In this case, the shorter timeframe momentum is fighting the bigger structure. Use the "Alert Only MA HTF" setting to filter these out automatically, or skip them manually for lower-conviction trades.
The Stale Signal Reversal
You see a "Stale Long" label, and then the very next bar one or two squares flip red. This is often an early warning that the move is ending. Not a trade in itself, but a prompt to check the chart directly and consider whether any open positions need attention.
Conclusion
The Abiroid Genesis Matrix Scanner is a fairly comprehensive tool for multi-pair, multi-timeframe monitoring. The underlying Genesis Matrix logic is well-established; the scanner layer makes it practical to run across many instruments without manually checking each chart.
The most important things to keep in mind:
- POWER Breakouts and Reverse (pullback reversal) signals are your two highest-conviction entries. Act on these with confidence when Dragon Filter and MA Stack alignment support them.
- "Genesis" signals (without pullback) are tradeable but carry less conviction. Consider adding confluence checks (price levels, Dragon Filter, MA Stack) before entering.
- Price levels matter. The scanner gives you direction and momentum: a nearby pivot, half-price, or whole number gives you an anchor for your entry and target.
- HTF disagreement is a meaningful warning. When the short-term matrix disagrees with the higher timeframe MA stack, the trade is lower conviction. Use the "Alert Only MA HTF" setting to filter these out automatically.
- Fewer signals is not a problem. The Dragon Filter, pullback check, and MA Filter options are all there to reduce noise. A quieter scanner is usually a more honest one.
- Stale signals should lower your interest in the pair, not raise it. If a signal has been running for many bars, the easy part of the move has likely already happened.
- The scanner operates 24/7, but the Max Spread guard ensures you only trade during liquid hours. High spreads are an early warning that the market is thin or dislocating.
- Enable "Alert Only MA Filter" for scalping to ensure tight confluence. Disable it for swing trades where you want more flexibility. Start with both MA Filters on and adjust based on your results.
Spend some time in the settings with your preferred pairs and timeframes, watch how signals develop over a week or two, and build a feel for the rhythm of each pair before committing capital to it.


