
Multi-Strategy Scanner — The Complete Step-by-Step Guide to Mastering 10 Trading Strategies in One Indicator
1 July 2026, 04:10

0
76
Multi-Strategy Scanner — The Complete Step-by-Step Guide to Mastering 10 Trading Strategies in One Indicator
Product Link : https://www.mql5.com/en/market/product/183763
Trading becomes difficult when your chart is filled with multiple indicators that often give conflicting signals. One indicator says **Buy**, another says **Sell**, while another says **Wait**. This creates confusion and leads to emotional decisions.
**Multi-Strategy Scanner** solves this problem by combining **10 professional trading strategies** into a single intelligent dashboard. Instead of switching between numerous indicators, everything is available in one place with a powerful **Confluence Engine** that only produces higher-quality signals when multiple strategies agree.
This guide explains how to install, configure, analyze, and successfully trade using every feature of the indicator.
---
# Table of Contents
1. Introduction
2. Why Multi-Strategy Scanner?
3. Installation
4. Understanding the Dashboard
5. Understanding Every Strategy
6. Confluence Mode Explained
7. Chart Analysis Process
8. How to Find High Probability Trades
9. Best Timeframes
10. Best Markets
11. Scalping Guide
12. Intraday Guide
13. Swing Trading Guide
14. Risk Management
15. Trading Examples
16. Common Mistakes
17. Frequently Asked Questions
18. Final Thoughts
---
# 1. Introduction
Multi-Strategy Scanner is designed to simplify technical analysis by combining multiple independent market concepts into one intelligent system.
Instead of manually checking:
* Trend
* Liquidity
* Breakouts
* Pullbacks
* VWAP
* Bollinger Bands
* Fibonacci
* Supply & Demand
* Session Breakouts
* Volatility
the scanner continuously monitors all of them simultaneously.
The result is faster decision-making with less chart clutter.
---
# 2. Why Use Multi-Strategy Scanner?
Professional traders rarely depend on a single indicator.
Instead, they look for confirmation from multiple sources.
For example:
✔ Trend is bullish
✔ Price pulls back
✔ VWAP support
✔ Fibonacci 61.8%
✔ Supply zone respected
When several conditions align together, probability generally improves compared with relying on only one condition.
That is exactly what the Confluence Scanner was built to detect.
---
# 3. Installation
1. Purchase and install the indicator.
2. Open MetaTrader 5.
3. Open any chart.
Examples:
* XAUUSD
* EURUSD
* GBPUSD
* NASDAQ
* BTCUSD
4. Attach Multi-Strategy Scanner.
5. Enable DLL imports if required.
6. Click OK.
The dashboard will immediately begin scanning.
---
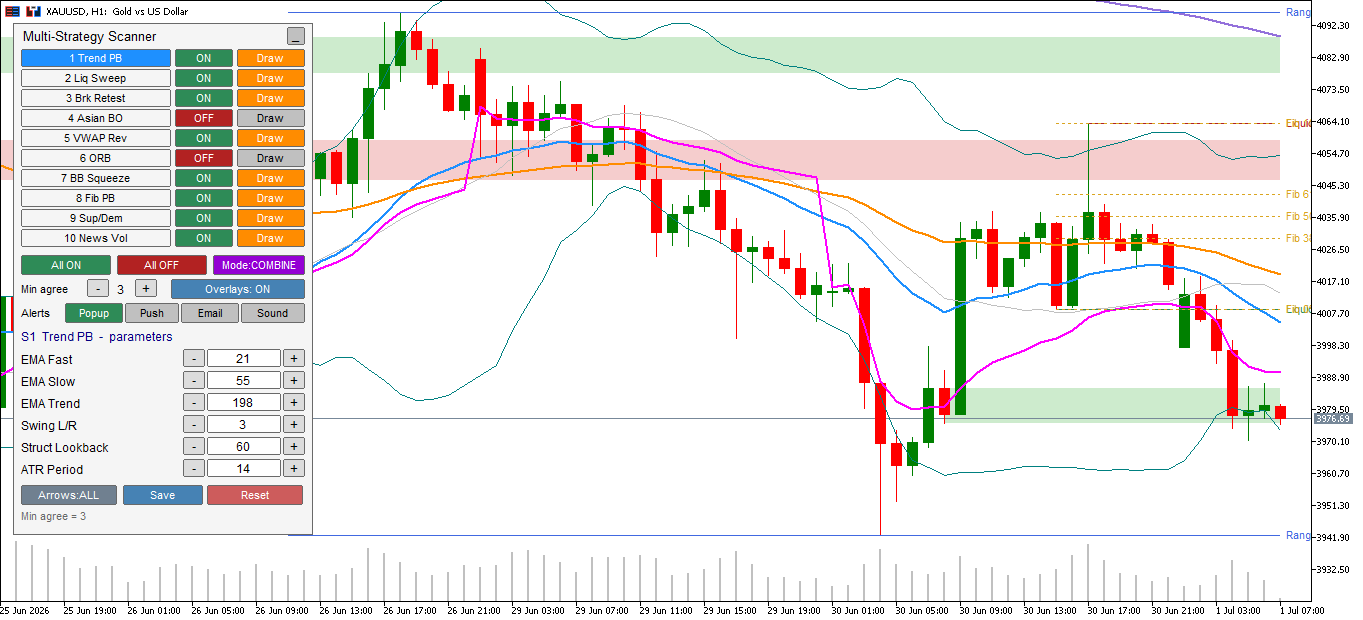
# 4. Understanding the Dashboard
The dashboard acts as your control center.
It allows you to:
• Enable or disable each strategy
• Switch overlay drawings
• Change parameters instantly
• Enable Combine Mode
• Adjust confirmation count
• Hide unnecessary drawings
Everything can be changed without removing the indicator.
Your settings are automatically remembered.
---
# 5. Understanding the 10 Trading Strategies
## Strategy 1 — Trend Pullback
Purpose:
Trade with the trend after temporary retracements.
Logic:
Fast EMA
↓
Slow EMA
↓
Trend EMA
↓
Price retraces
↓
Buy or Sell signal
Best for:
* Trending markets
* Gold
* Forex
Avoid:
Strong sideways markets.
---
## Strategy 2 — Liquidity Sweep
Financial markets often move beyond recent highs or lows before reversing.
This strategy identifies:
• Stop hunts
• Liquidity grabs
• False breakouts
Especially during:
* London Session
* New York Session
Best for:
* XAUUSD
* GBPUSD
* EURUSD
---
## Strategy 3 — Breakout & Retest
One of the most reliable price-action techniques.
Process:
Resistance breaks
↓
Price returns
↓
Retest succeeds
↓
Buy signal
This avoids chasing breakouts.
---
## Strategy 4 — Asian Range Breakout
During the Asian session, markets frequently consolidate.
When London opens:
Volatility increases.
The indicator automatically detects:
Asian High
Asian Low
Breakout direction
Confirmation
Ideal for:
* Gold
* GBP pairs
* EUR pairs
---
## Strategy 5 — VWAP Reversal
VWAP is widely used by institutional traders.
Price often:
Moves far from VWAP
↓
Becomes stretched
↓
Returns toward VWAP
The indicator detects these opportunities.
---
## Strategy 6 — Opening Range Breakout (ORB)
The opening minutes often define the day's direction.
The indicator marks:
Opening High
Opening Low
Breakout
Confirmation
Excellent for:
* Indices
* Gold
* US Session
---
## Strategy 7 — Bollinger Band Squeeze
Low volatility frequently precedes large moves.
The scanner detects:
Narrow Bollinger Bands
↓
Volatility compression
↓
Expansion
↓
Breakout signal
Useful before explosive market moves.
---
## Strategy 8 — Fibonacci Pullback
Markets often retrace before continuing.
Scanner watches:
50%
61.8%
Retracement zone
Trend confirmation
Entry signal
Ideal during strong trends.
---
## Strategy 9 — Supply & Demand
Institutional traders often leave footprints.
The scanner automatically highlights:
Supply zones
Demand zones
Reaction candles
High-probability reversal areas
---
## Strategy 10 — News Volatility
Large news events create sudden momentum.
The scanner identifies:
Volatility spikes
Large candles
Momentum continuation
This is useful for traders who specialize in fast-moving markets, but be aware that volatility can also increase risk. Consider wider spreads and slippage around major news releases.
---
# 6. Understanding Confluence Mode
This is the most powerful feature.
Instead of taking signals from one strategy,
the scanner waits until multiple strategies agree.
Example:
Trend Pullback ✔
VWAP ✔
Supply Zone ✔
Liquidity Sweep ✔
Total agreement = 4
Arrow appears.
This filters many lower-quality setups.
Example settings:
Minimum 2 strategies
Higher signal frequency
Minimum 3 strategies
Balanced confirmation
Minimum 4 strategies
Fewer signals with stricter confirmation
Minimum 5+
Highly selective
Increasing the required agreement usually reduces the number of signals. It does not guarantee higher win rates, so choose a setting that matches your trading style and test it on your market.
---
# 7. Chart Analysis Workflow
Follow the same routine every trade.
### Step 1
Identify trend.
Is the market:
Bullish?
Bearish?
Sideways?
---
### Step 2
Look at active strategies.
Which ones are currently agreeing?
---
### Step 3
Check Confluence Count.
2?
3?
4?
Higher agreement deserves more attention.
---
### Step 4
Observe nearby:
Support
Resistance
Supply
Demand
VWAP
Fibonacci
---
### Step 5
Wait for bar close.
Signals are confirmed after the candle closes.
Do not enter before confirmation.
---
### Step 6
Plan your trade.
Determine:
Entry
Stop Loss
Take Profit
Risk percentage
before placing an order.
---
# 8. Best Timeframes
Recommended:
M5
Fast scalping
M15
Balanced intraday trading
M30
Stable trend analysis
H1
Swing trading
Although the indicator works on all timeframes,
M5-H1 provides the best balance between signal frequency and clarity.
---
# 9. Best Markets
Excellent for:
✔ XAUUSD
✔ EURUSD
✔ GBPUSD
✔ USDJPY
✔ NASDAQ
✔ US30
✔ GER40
✔ BTCUSD
✔ ETHUSD
Also works on:
Indices
Metals
Crypto
Forex
---
# 10. Scalping Guide
Recommended:
Timeframe:
M5
Confluence:
3
Sessions:
London
New York
Risk:
Keep a fixed percentage risk per trade.
Avoid increasing position size after losses.
Focus on:
Trend
Liquidity
VWAP
Breakout
---
# 11. Intraday Trading Guide
Recommended:
Timeframe:
M15
Confluence:
3–4
Target:
Follow the day's dominant direction rather than aiming for a fixed number of trades.
---
# 12. Swing Trading Guide
Recommended:
H1
Confluence:
4
Keep:
Trend Pullback
Fibonacci
Supply & Demand
VWAP
enabled.
---
# 13. Risk Management
Even strong technical setups can fail. Consistent risk management is essential.
General guidelines:
* Decide your maximum risk per trade before entering.
* Always use a stop loss.
* Define a realistic profit target or trailing exit.
* Avoid adding to losing positions without a tested strategy.
* Keep a trading journal to review your decisions.
The indicator is designed to help identify opportunities—it does not eliminate market risk.
---
# 14. Example Analysis
Suppose you are analyzing XAUUSD on the M15 chart.
Market trend:
Bullish
Active strategies:
Trend Pullback ✔
VWAP ✔
Fibonacci ✔
Supply Zone ✔
Confluence Count:
4
A Buy arrow appears after the candle closes.
You then confirm:
* The overall trend supports the trade.
* Price is reacting from a key area.
* Your planned stop loss and target fit your risk rules.
If all conditions match your trading plan, you may consider the setup.
---
# 15. Common Mistakes
Many traders reduce their consistency by:
* Trading every arrow without checking the broader market context.
* Ignoring nearby support or resistance.
* Increasing lot size after losses.
* Entering before the confirmation candle closes.
* Trading during unsuitable market conditions for the selected strategy.
* Skipping backtesting or demo practice before using real funds.
---
# 16. Frequently Asked Questions
### Does the indicator repaint?
No. Signals are confirmed after the candle closes and remain fixed.
---
### Can I use only one strategy?
Yes.
Each strategy can be enabled or disabled independently.
---
### Can I use all 10 strategies?
Yes.
This is the recommended way to benefit from Confluence Mode.
---
### Does it trade automatically?
No.
This is a technical analysis and decision-support indicator.
It does not place or manage trades.
---
### Does it work in Strategy Tester?
Due to MetaTrader 5 platform limitations, the interactive on-chart control panel is not available inside the Strategy Tester.
The indicator is designed primarily for live chart analysis. Refer to the product screenshots and demonstration video to see the panel in operation.
---
# Final Thoughts
Multi-Strategy Scanner is built to simplify market analysis by combining ten independent technical approaches into one organized workspace. Rather than relying on a single trading concept, it helps you compare trend, momentum, volatility, structure, session behavior, and institutional-style zones on the same chart.
The Confluence Mode is particularly useful for traders who prefer confirmation before acting, as it allows you to require agreement from multiple strategies before a signal is displayed. Like any technical tool, its effectiveness depends on disciplined execution, sound risk management, and practice.
Spend time learning how each strategy behaves in different market conditions, test your preferred settings on historical data and a demo account, and build a trading plan that matches your objectives. Consistency comes from following a repeatable process—not from any single indicator.


")
