0
101
Trade Assistant: multifunctional tool for a convenient trading
- This utility will help you simplify, automate and make your trading faster, while significantly expanding the standard capabilities of the MetaTrader terminal.
- If you have any questions, ideas for improvement, or if you suddenly notice a bug, please contact me, I am open to suggestions:
- MQL profile: https://www.mql5.com/en/users/mqlmoney
- email: bossplace@yahoo.com
The utility is divided into 4 main tabs:
- [new] tab: New trades, Lot / Risk / Risk-Reward calculation.
- [manage] tab: Trade management, Breakeven, Trailing, Auto-Close, Auto-Levels.
- [info] tab: Trade statistics, market analysis.
- [tool] tab: Indicators and auxiliary utilities.
Clickable Links:
[info] tab: Market information + Trade statistic
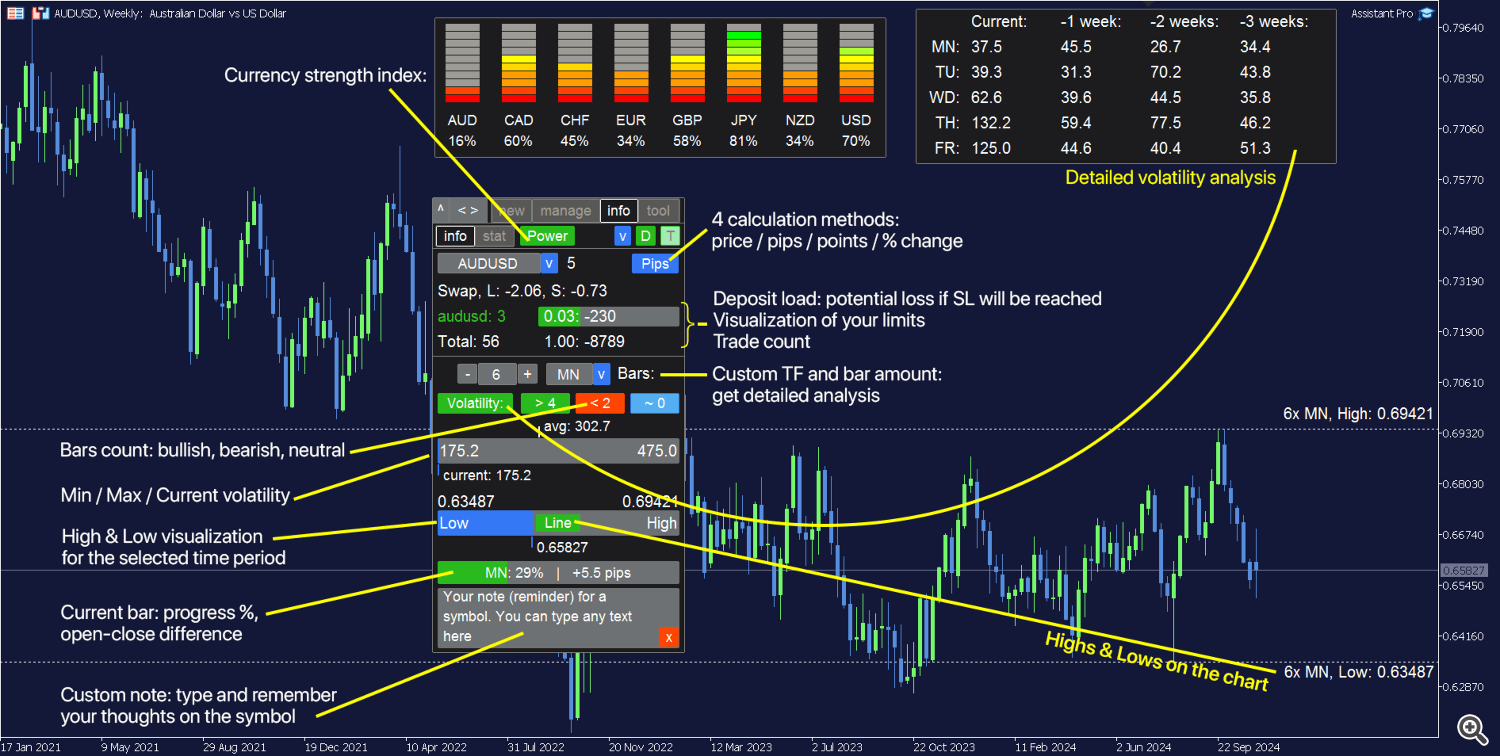
[info] subsection: market information, analysis the of price movements
Specify any currency pair / trading instrument to get a market information:
- Current spread.
- Swap for long positions (buys), and for short positions (sells).
- Symbol load: calculates a potential loss on all active and pending trades of the selected Symbol: if SL levels will be reached, or the current floating loss if the SL level is not set. Also shows the total lot size of all trades, and trade amount
- Total load: the same calculation, but for all Symbols on the account.
If Limits are set in the settings [s] > [Risk management]: you'll see a visualization of the current Lot and Trade amount , compared to your limits. The [only active] / [active + pending] parameter from the settings is taken into account when calculating the deposit load.
Select a TimeFrame and number of periods to analyze the price changes: - Average, Maximum and Minimum Volatility: value for 1 period of the selected TF.
- High/Low visualization: shows the location of the current price, compared to the Minimum and Maximum prices for the selected time period.
- Bar progress indicator: shows the percentage of time elapsed from the bar opening to the moment of its closing.
- Up bars count: Close price is higher than Open price. Click on it to enable Bar isolation mode.
- Down bars count: Close price is lower than Open price. Click on it to enable Bar isolation mode.
- Neutral bars count: Close price is equal to the Open price
- Blue switch at the top [Price / Pips / Points / %]: calculation method for 'Load' data, and Volatility.
- [Volatility] button: if active, an additional window will show you the absolute volatility for each day for the last 4 weeks.
Extra window can be moved to any place of the chart. - [HL line] button: if active: max/min prices for the selected time period will appear on chart.
- [Power] button: the indicator of the current strength of the major currencies.
The separate window can be moved to any place of the chart.
Please note: If the currency pairs on your broker have a prefix / suffix, you should specify it in the settings [s] > [Chart]:
[Symbol Prefix] and [Symbol Suffix] values. - In the lower window on this tab you can type a Note (reminder) for the selected Symbol: so you can remember what you should pay attention to.
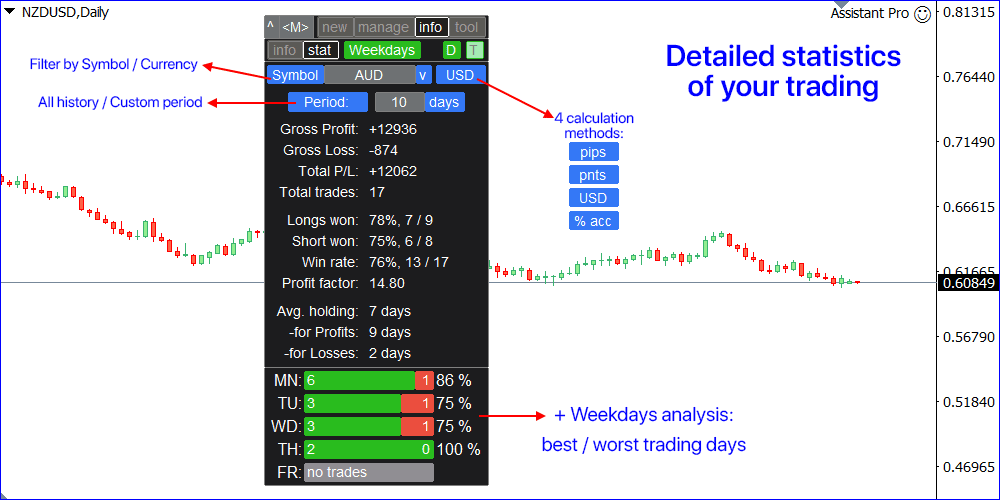
[stat] subsection: detailed statistics of your trading
- Select either a specific [Symbol], or set [ALL] Symbols.
- Select the time period for which you want to get a statistics:
[All history], or the specified [Period:] in minutes / hours / days / bars. - Select the Profit/Loss calculation method, using a blue switch: account currency / pips / points / % account size.
Detailed trading statistics will be displayed lower on this tab:
- Gross profit
- Gross loss
- Total profit / loss
- Total number of trades
- Percentage of profitable long trades (buys)
- Percentage of profitable short trades (sells)
- Overall success rate
- Profit factor
- The average holding time of all trades
- The average holding time of profitable trades
- The average holding time of unprofitable trades
[Weekdays] option
Analysis of the days of the week when trades were opened. It may help you to find out the best / worst days of the week to enter the trades.
For each day of the week, the following info is displayed:
- The count of the profits / losses
- Success rate
- The red / green visualization will help you determine the best trading days

Links to the descriptions of the other tabs:
Files:
Assistant_Pro_Manual.zip
1616 kb


