Trade Assistant: multifunctional tool for a convenient trading
- This utility will help you simplify, automate and make your trading faster, while significantly expanding the standard capabilities of the MetaTrader terminal.
- If you have any questions, ideas for improvement, or if you suddenly notice a bug, please contact me, I am open to suggestions:
- MQL profile: https://www.mql5.com/en/users/mqlmoney
- email: bossplace@yahoo.com
The utility is divided into 4 main tabs:
- [new] tab: New trades, Lot / Risk / Risk-Reward calculation.
- [manage] tab: Trade management, Breakeven, Trailing, Auto-Close, Auto-Levels.
- [info] tab: Trade statistics, market analysis.
- [tool] tab: Indicators and auxiliary utilities.
Clickable Links:
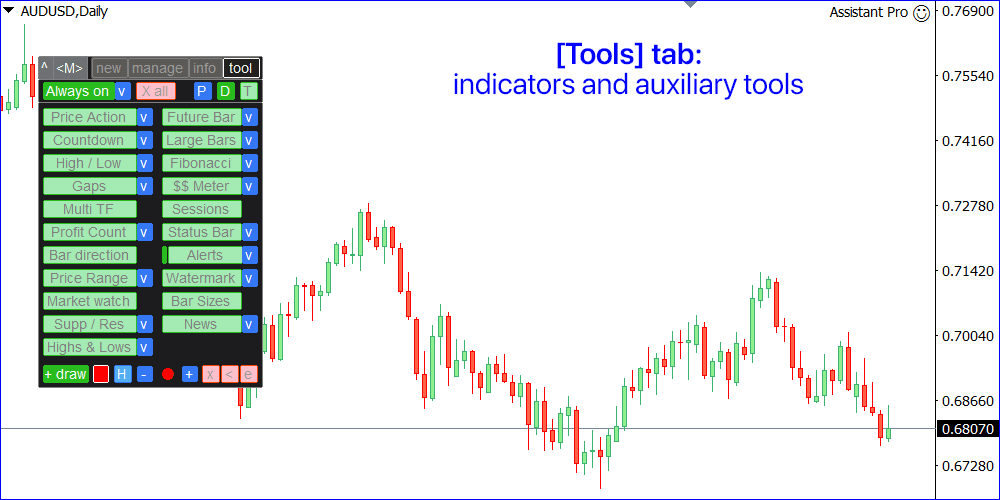
[tool] tab: indicators and auxiliary tools
This section contains additional tools that can be useful for certain trading actions,thereby simplifying and speeding up the trading process.
- Each tool can be turned on/off by clicking on the corresponding green button.
- [always on] option: if enabled - the most important tools will remain active even when switching to the another tab, or minimizing the main panel. Click [v] to choose which tools need to be active when using the "Always on" option.
- To turn off all the tools at once, use the [X] button at the top of the tab.
- The positions of the indicator's panels can be saved to a preset, and then you can quickly select a convenient one: [L] (Location) button;
- There are a lot of settings in this tab: you can save the configurations to a preset, and then load one of the presets if necessary: [P] button.
- Click [v] to open the settings of the corresponding tool.
Disclaimer: none of the indicators should be perceived as investment advice. They are provided 'as is', giving you a mathematical price analysis. All trading decisions should be made by you, and you are the only one responsible for your trading results.
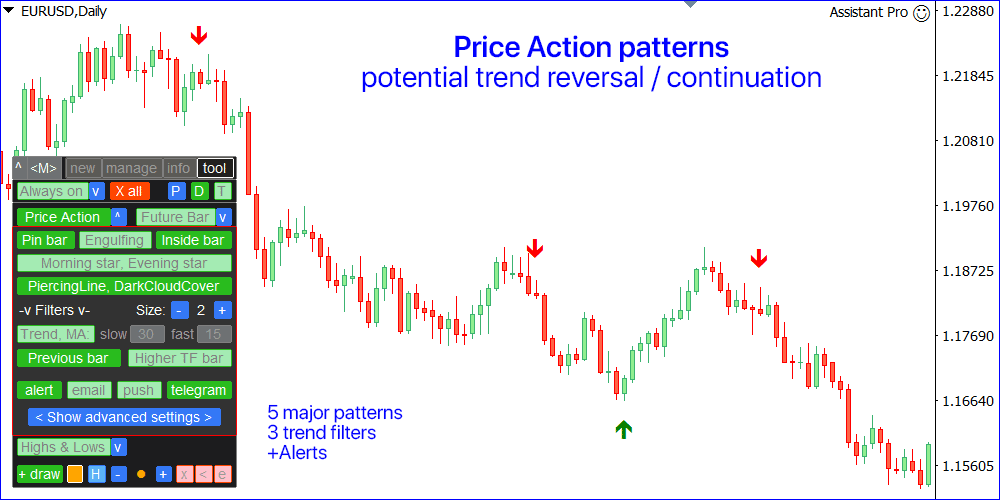
[Price Action] indicator
Price patterns indicating a potential reversal or continuation of the trend.
Please note: the indicator is not initially configured for each Symbol and provided 'as is': for the best results, it is recommended to configure the patterns for each Symbol.
Indicator settings [v]:
- Enable / disable each of the patterns:
a) Pin bar
b) Engulfing pattern
c) Inside bar (Harami)
d) Morning/Evening star
e) Dark cloud cover / piercing line - Adjust the size of the chart arrows.
- On / off the current trend filter [Trend, MA] :
If active, only patterns in the direction of the current trade will be displayed.
The trend is determined by Moving Averages: their periods can also be adjusted:
a) Slow MA above Fast MA: it means a downtrend;
b) Slow MA below Fast MA: it means an uptrend; - [Previous bar] filter: patterns only in the same direction as the previous bar on current TF.
- [Higher TF] filter: patterns only in the same direction as the last closed bar on a higher TF.
Higher timeframe means: M15 when using M5, H4 when using H1, and so on. - Notifications on a new price action signal: terminal [alerts] / [email] / [push] / [telegram]
- [< Show advanced settings >] : click to configure the patterns.
- Click on the color sample to change it: separately for Buy and Sell arrows.
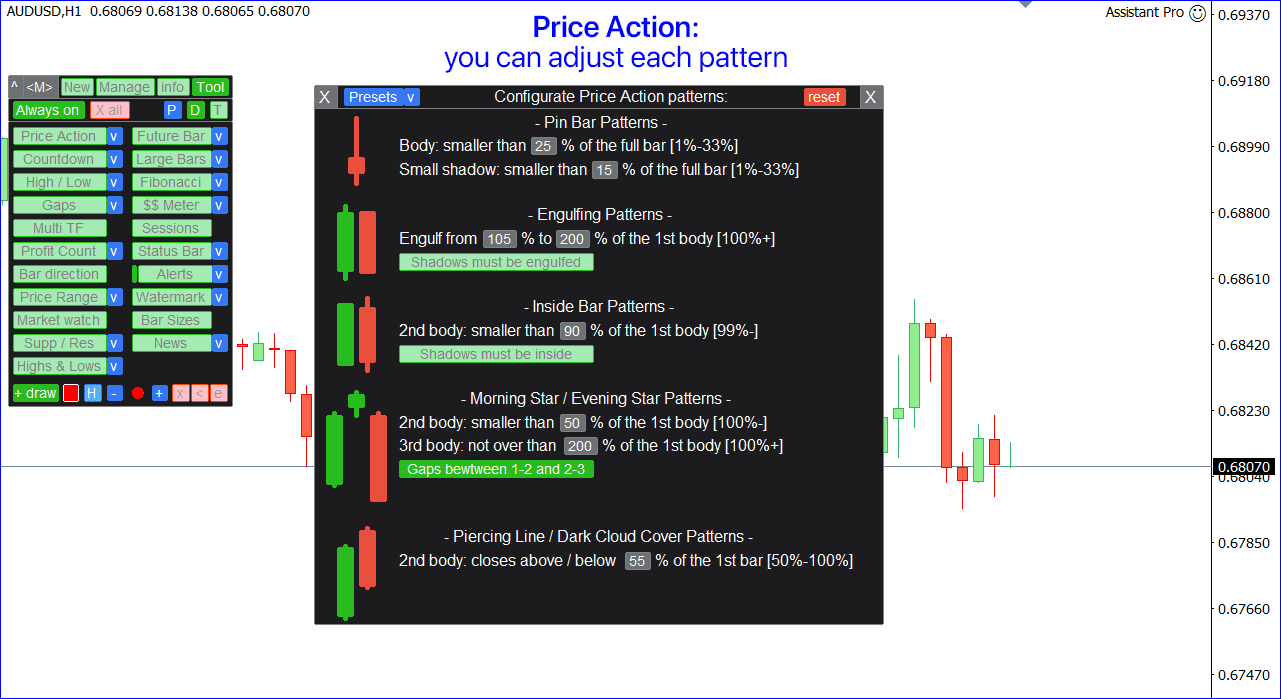
Advanced settings of the Price Action patterns
You can adjust each pattern for the best trading results.
- A rough visualization of what the pattern will look like is displayed on the left.
- You can [reset] the settings to the default settings.
- There are a lot of settings, but you can save the configurations to a [Presets v], and then load one of the preset if necessary.
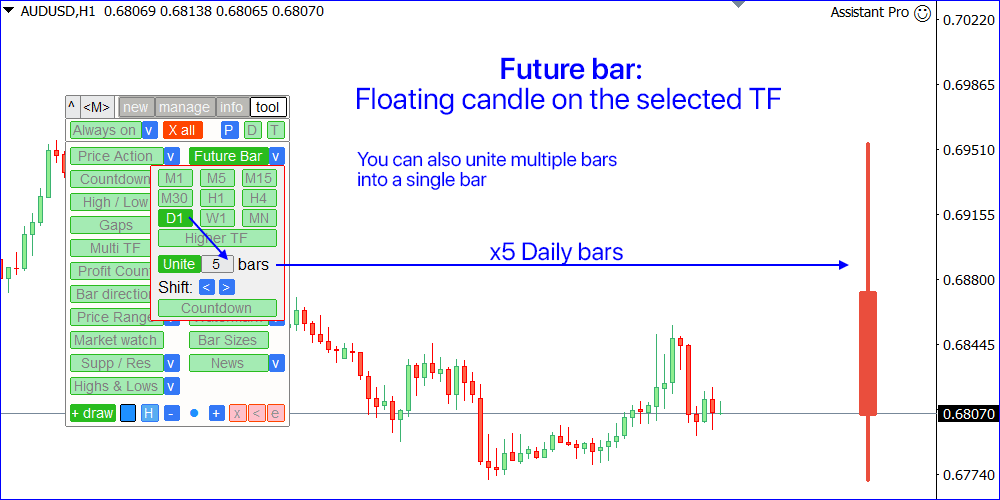
[Future Bar] tool
Visualizes the current (floating) bar on the selected timeframe, or multiple bars united to the single bar.
Indicator settings [v]:
- Select the timeframe of the future bar.
- [Unite] option: you combine the specified number of last bars into a single bar.
- [<] / [>] buttons: move the future bar to the left / right relative to the current chart bar;
- [Countdown] to the closing time of the future bar: displayed at the bottom of the chart.
- Colors: may be determined [automatically] (same as chart's candles), or you can set it [manually]: for Up and Down bars separately.
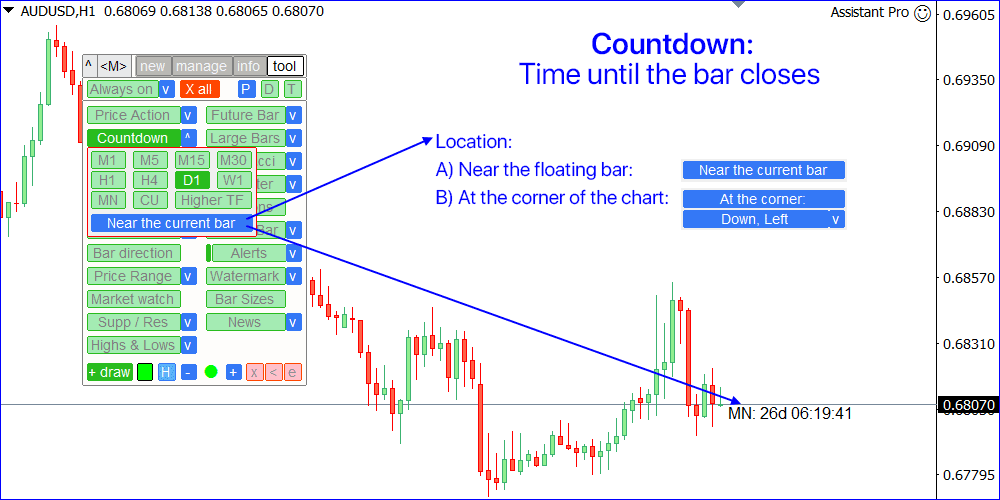
[Countdown] utility
Time until the bar closes on the selected TF.
Settings [v]:
- Select the timer location: either near the floating chart bar, or at the bottom of the chart;
- Timeframe for the countdown;
[Large Bars] indicator
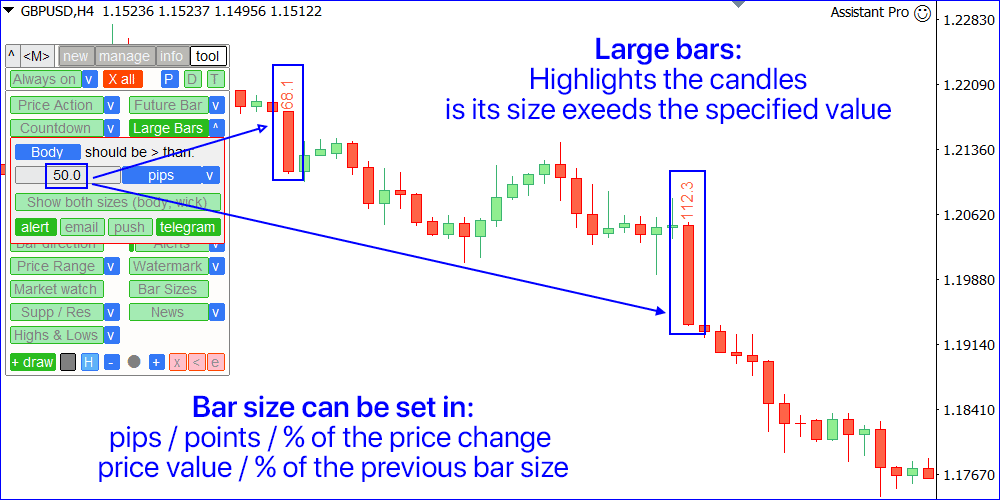
Highlights the large bars on the chart.
Indicator settings [v] :
- Set the minimum bar size: all bars whose size is equal to or exceeds the specified value - will be marked on the chart, indicating its size;
- The size can be calculated either by the [body] (open-close) or by [shadow] (high-low).
- [Show both sizes] option: both body and shadow sizes will be shown on the chart.
- On/off the alert on a new large bar: terminal [alert] / [email] / [push] / [telegram];
- Colors: separately for Up and Down bars;
Bar size can be set in terms of:
pips / points / % price change / price value / % of the previous bar size / % of the ATR value
This indicator:
- Convenient to filter the patterns in a period of low volatility;
- Indicates the potential beginning of a new trend;
- Helps to see the most significant bars;
- Can be used when trading binary options;
[High / Low] indicator
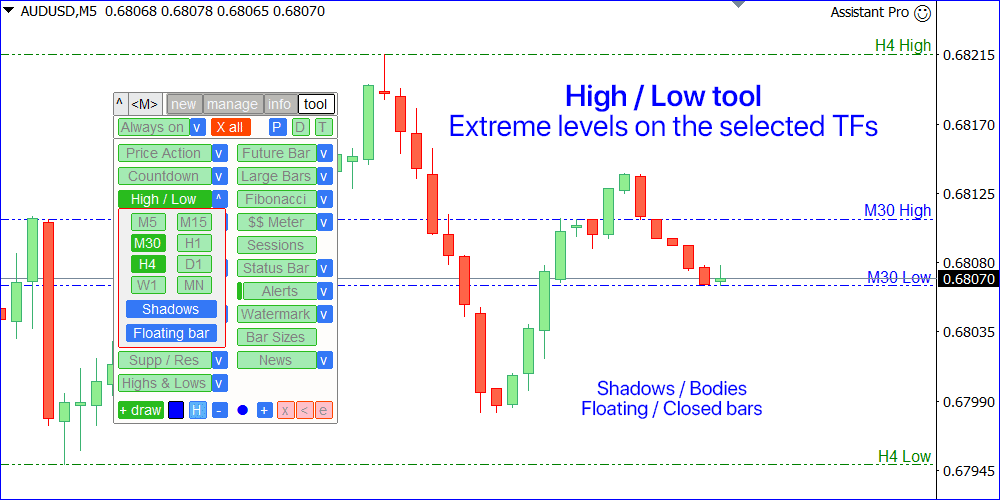
Shows the extreme levels of the selected timeframes: highest and lowest prices.
Indicator settings [v]:
- Select the TimeFrames, the levels of which will be displayed on the chart.
- Calculation mode: [Real bodies] (Open/Close prices), or [Shadows] (High/Low prices).
- Calculation base: [Closed bar] (last closed), or [Floating bar] (currently open).
- The line style / colors can be adjusted: click on the color sample.
This indicator:
- May help you to see potential reversal levels;
- Patterns formed near the levels may have more significance;
- When trading on a lower timeframes, it will let you see the bigger picture;
[Fibonacci] indicator
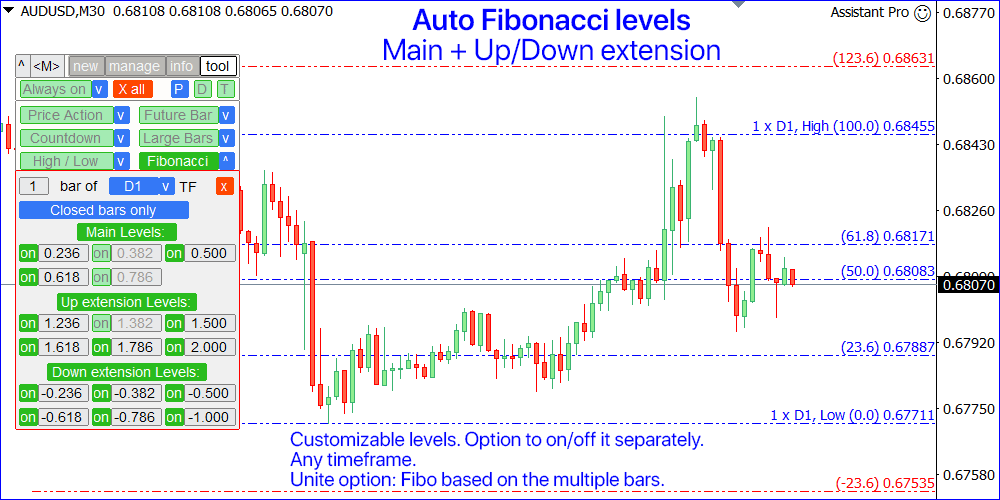
Automatically plots the Fibo levels based on the last close bar(s) of the selected timeframe.
Indicator settings [v]:
- Set the number of bars based on which the levels will be calculated. For example:
1 Bar: the levels will be built based on the High/Low values of the last closed bar;
2 Bars: the levels will be built based on the values of the last 2 closed bars; - Set the TimeFrame that will be used for the calculation.
- [Close bar only]: calculation only based on already closed bars;
- [Include a floating bar]: current (floating) bar will be included in the calculation
- Customize the Fibonacci levels. You can also each of them, or the entire group:
5 main levels, 6 up extension levels, 6 down extension levels. - You can reset [x] the levels to the default settings (classic Fibonacci levels).
- To set the lines color: click on the color sample (separately for 3 groups). Styles will be the common.
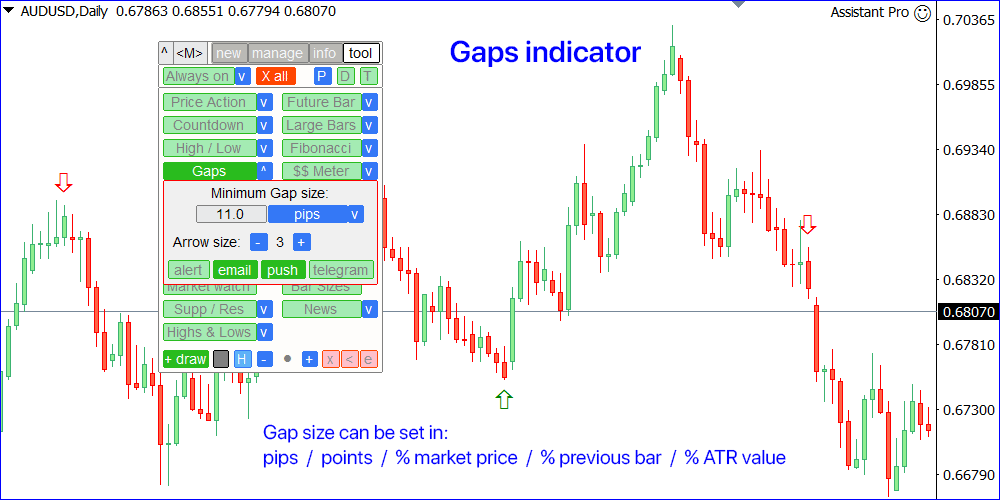
[Gaps] indicator
Shows the Gap appearance on the chart: when the opening price of a new bar differs from the closing price of the previous bar.
Indicator settings [v]:
- Set the minimum Gap size to be displayed:
in Pips / Points / % of price change / % of the previous bar size / % of the ATR value; - Set the size of the arrows on the chart;
- On/off the notification when a new gap occurs: [alert] / [email] / [push] / [telegram]
- You can adjust the arrow colors: separately for Up and Down gaps.
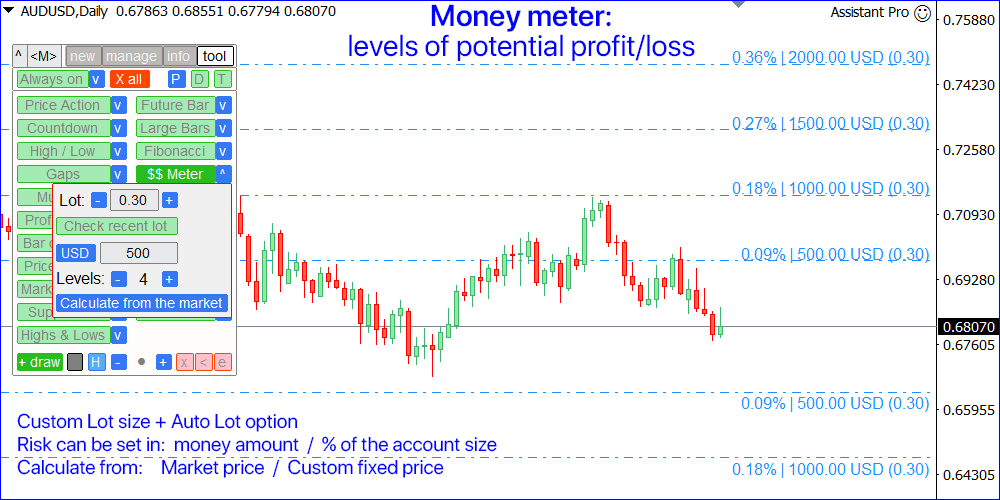
[$$ Meter]: Money meter tool
Shows the levels of potential Profit / Loss, when trading using a given lot size.
Indicator settings [v]:
- Lot size for calculation (there is also an option to auto-set the last used lot)
- Grid step: [%] of the account size / amount of [Money]
- The amount of levels displayed for each direction
- The level from which the levels should be calculated:
a) the current market price [Calculate from the market],
b) or a fixed price level [Calculate from the price:] - The line color and style
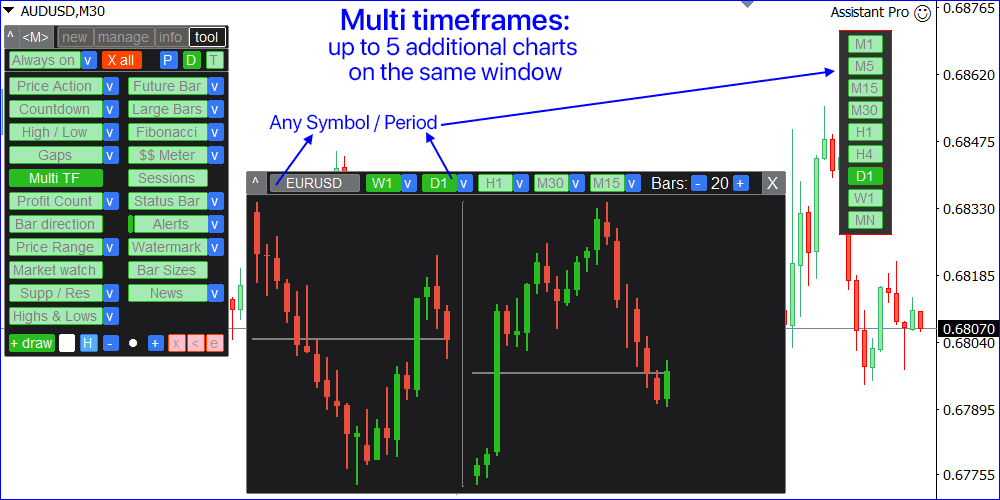
[Multi TF]: multi timeframe tool
Shows up to 5 additional timeframes on the same chart.
It opens in a separate window: it can be moved (drag anywhere), and minimized [v].
You can adjust:
- The chart Periods. Each of the TF can be disabled.
- The amount of the bars displayed for each TF:
a) 5 active charts: max = 25 bars
b) 4 active charts: max = 30 bars
c) 3 active charts: max = 45 bars
d) 2 active charts: max = 45 bars
e) 1 active chart: max = 90 bars - Symbol for calculation.
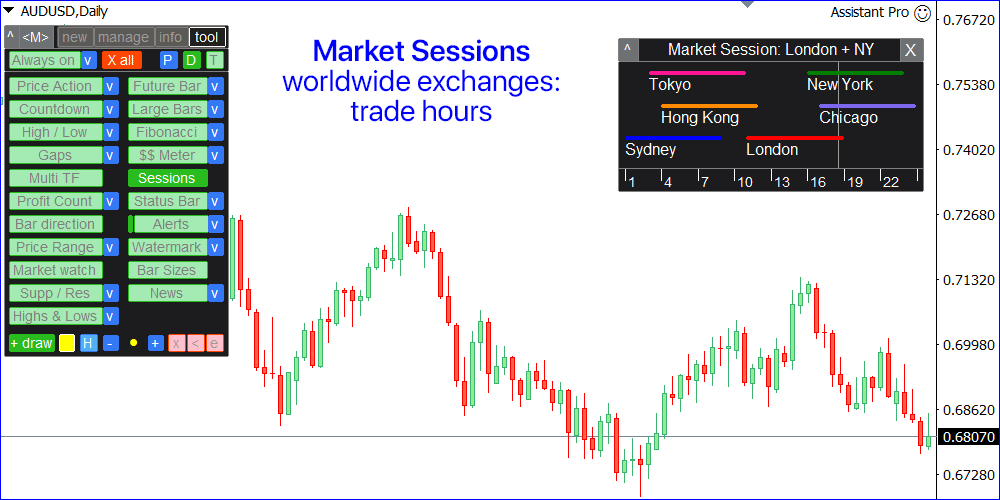
[Sessions] tool
Shows the operating hours of the world's exchanges.
- The vertical line moves as the day progresses and shows the current time.
- You can see which markets are currently the most active, so you can select the most volatile instruments. Especially useful for the intra-day traders.
- This tool opens in a separate window : it can be moved (drag anywhere), and minimized [^].
- In the settings [v] you can adjust which time will be displayed on the lower timeline:
[GMT] / [Local time] on your computer / [Broker's time] on the Market watch
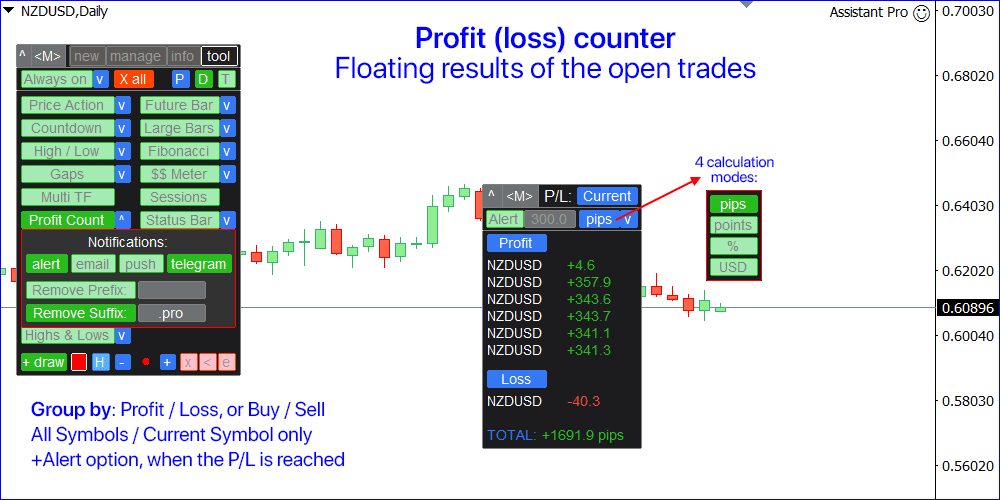
[Profit Count] tool
Calculates the floating profit / loss of the open trades, grouped into 2 categories.
- Using the blue switches you can change the method of grouping the trades:
- [Buys] / [Sells]
- [Profit] / [Loss]
- The Symbol and the floating P/L are displayed for each trade.
- The total result for all trades is shown below.
- This tool opens in a separate window : it can be moved [< >] and minimized [v] .
- Tip: Click on the Symbol or financial result to start managing the trade.
Settings on the separate panel:
- Symbol for counting: [Current] / [For All];
- [Alert] : if enabled - there will be a notification when the floating P/L exceeds the value you set in the next input field.
- The type of P/L calculation: [pips] / [points] / [%] / [currency].
Settings on the main panel [v] :
- You can choose where the P/L achievement notifications will be sent: [alert] / [email] / [push] / [telegram].
- Options for auto removing the [Prefix] / [Suffix]. This will make the Symbol names compact: useful if there are extra characters, such as "EURUSD.pro".
[Status bar] tool
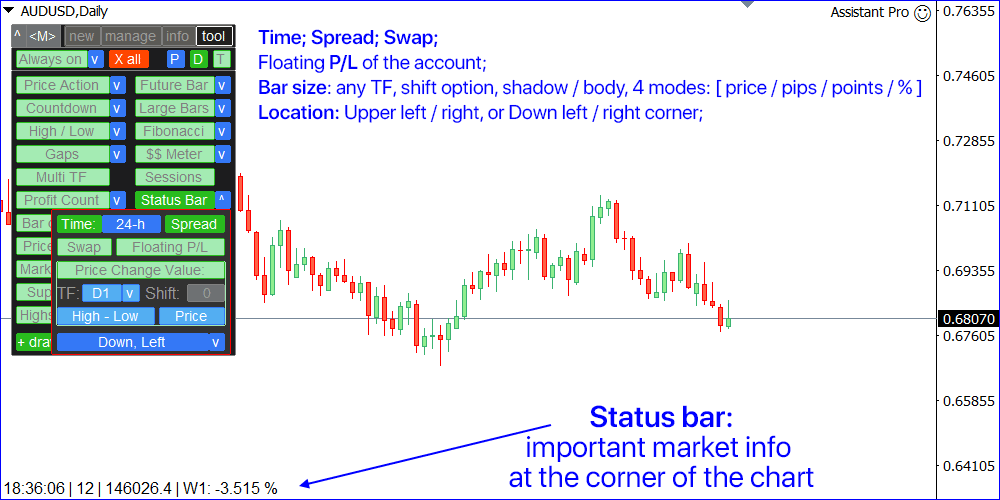
Shows important market information at the bottom of the chart.
In the settings [v] you can optionally on/off each of the info:
- Local [Time] (on your computer): it may be set in the [am/pm] or [24-h] format.
- Current [Spread] for the Symbol.
- Current [Swap]: for Long and Short positions.
- [Floating P/L] of the entire account:
account currency / % of the account size: depending on the selected type on the [new] tab. - [Price Change Value]: the bar size on the selected TF.
a. Set the shift relative to the current bar: 0 = the value of the currently open (floating) bar; 1 = previous closed bar, and so on..
b) Calculation methods: [Open-Close] size (body), or [High-Low] size (shadow).
c) The size can be calculated in [Price] / [Pips] / [Points] / [%] change. - Position on the chart: upper left/right, or down left/right corner
[Bar direction] indicator
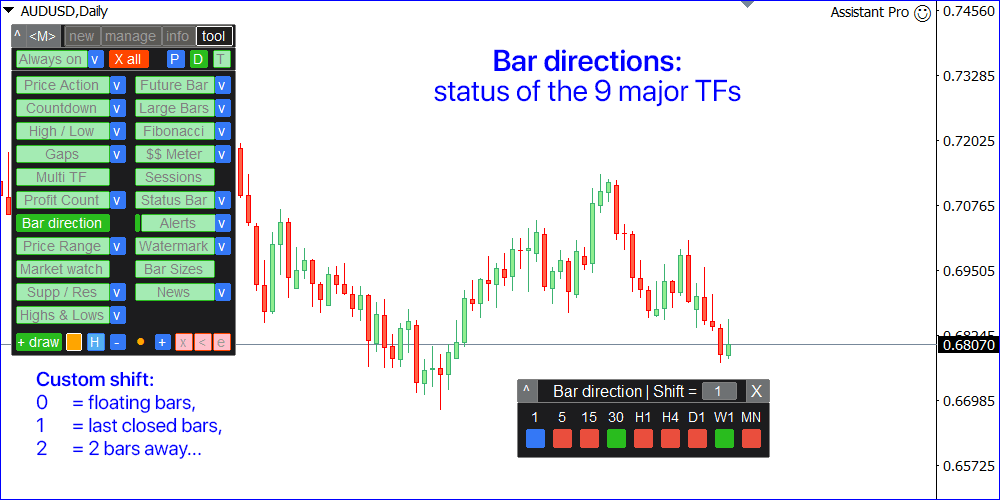
Shows the direction of the bars on all major timeframes.
- Red: close < open: close price is lower than open price
- Green: close > open: close price is higher than open price
- Blue: close = open: close price is equal to the open price
In the window you can also set the Shift of the calculated bar, relative to the current bar:
- Shift = 0: the direction of the current (open) bars,
- Shift = 1: the direction of the last closed bars, and so on...
This indicator:
- Helps you to see the overall trend direction;
- May be useful when trading binary options;
- Helps to find the corrective and trend movements;
This tool opens in a separate window: it can be moved (drag anywhere), and minimized [v].
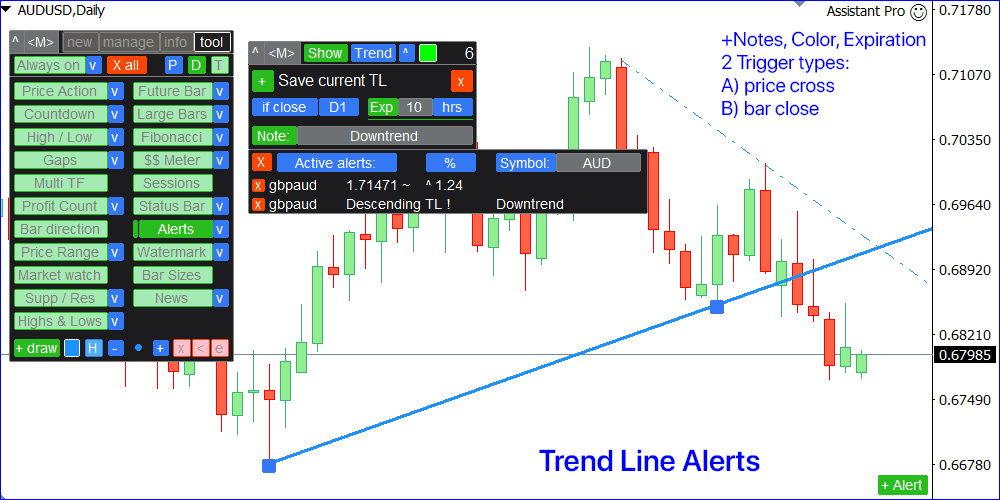
[Alerts]: notification when a price level / trend line is reached
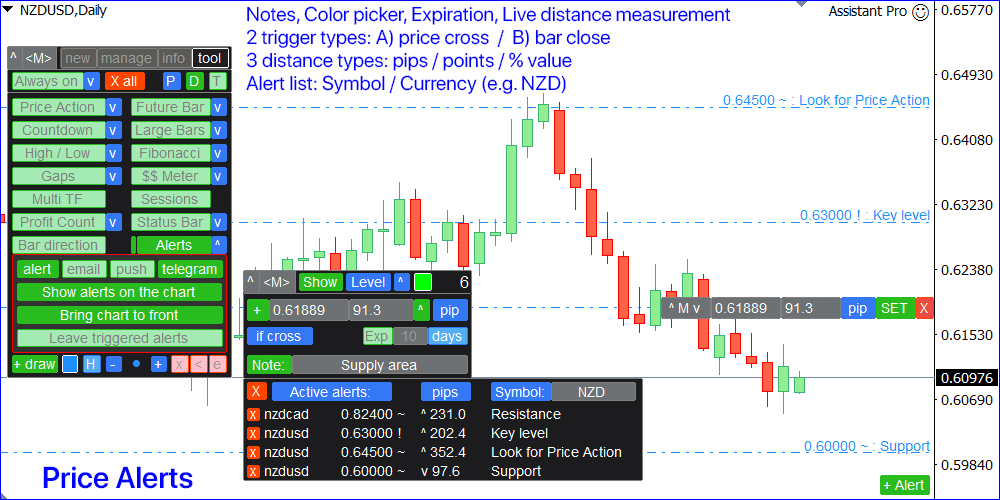
This tool opens in a separate window: it can be moved [< >] and minimized [v].
There are 2 alert types, you can select it using the blue switch at the top of the panel:
- [Level]: alert at the price level;
- [Trend]: alert at the trend line;
There are 2 types of triggers: so you can select when the alert should be sent:
- [if cross]: when the price crosses the level / trend line;
- [if close]: when the bar closes beyond the level / trend line;
To add a new price alert:
- Type the level price, or set the price change value (relative to the current price).
- Click [+] to save the alert.
When using the price change value:
- Use the blue switch to set the calculation method: % of change / pips / points.
- Use [^] / [v] switch to invert the level in the opposite direction from the current price:
e.g. if it was [+10] pips (above), you can invert it to [-10] pips (below). - If alert level is within the visible chart area: a separate interface for a quick alert setting will be displayed:
- Drag [^ M v] to adjust the level with the mouse. Hold <TAB> while moving to use a magnet .
- You can also type the price / change values in the input fields.
- Click [SET] to add the alert, or [X] to cancel and hide the row.
To add a new trend line alert:
- Click [+] to start drawing a trend line.
- Use the ■ DOTS on the chart to adjust the TL.
- Click [+] to save the trend line, or [x] to stop drawing.
Options:
- You can set the expiration: if [Exp] is active, alert will be cancelled after the specified time.
- [Note]: add a reminder of what needs to be done when the alert is triggered.
At the top of the panel:
- [Show]: if active, the alert lines will be visualized on the chart. When the active Alert levels are displayed on the chart, you can click on the level description to start the modification.
- The total amount of the active alerts on all Symbols is displayed at the top right corner.
- [v]: click to show the list of the alerts
- [color]: click to set a color to visualize alert on the chart. It must be selected before the alert is saved.
Working with the list of the alerts:
- Use the blue switch to switch between the [Active alerts] and [Triggered alerts];
- You can view the alerts on [Current] Symbol, for the specified [Symbol:] , or [ALL] alerts;
When using [Symbol:] method, you can also check the alerts for the group of Symbols:
e.g. type 'EUR' to check alerts on all currency pairs with EUR. - Click [x] to delete alerts: separately, or ALL from the list (if you click [x] on the 1st row);
- When checking the [Active alerts] list:
- Click on the Symbol to apply it to the current chart;
- Click on the Price to modify the alert: parameters can be adjusted above, and the alert can be dragged on the chart (if visible);
- The current distance from the market price to the alert level is calculated: you can set the calculation method using the blue switch: pips / points / %. Click on the distance value to use the alert price as the entry level for a new trade;
- Click on the Note to edit or add it;
- When viewing [Triggered alerts] : click on the level to use it as the entry price for a new trade
Settings on the main utility panel [v] :
- You can on/off each type of the notification: [alert] / [email] / [push] / [telegram]
- [Show alerts on the chart]: if active, the alerts will be visualized on the chart.
- [Bring chart to front]: if active, the chart of the triggered alert will be moved forward.
- [Leave triggered alerts]: if active, triggered alerts will be moved to a separate list, and will be visualized on the chart. So you will be able to analyze the reached levels.
Then you can delete triggered levels manually in 2 ways: - From the triggered list of alerts on the alert panel: [x] button;
- Or from the chart: by clicking on the line or description
- Click [EN] on the chart to use the triggered level as the entry price for a new trade.
- [Quick <+Alert> button]: if active - an additional button at the bottom of the chart will be displayed for a quick alert setting.
[Price Range] indicator
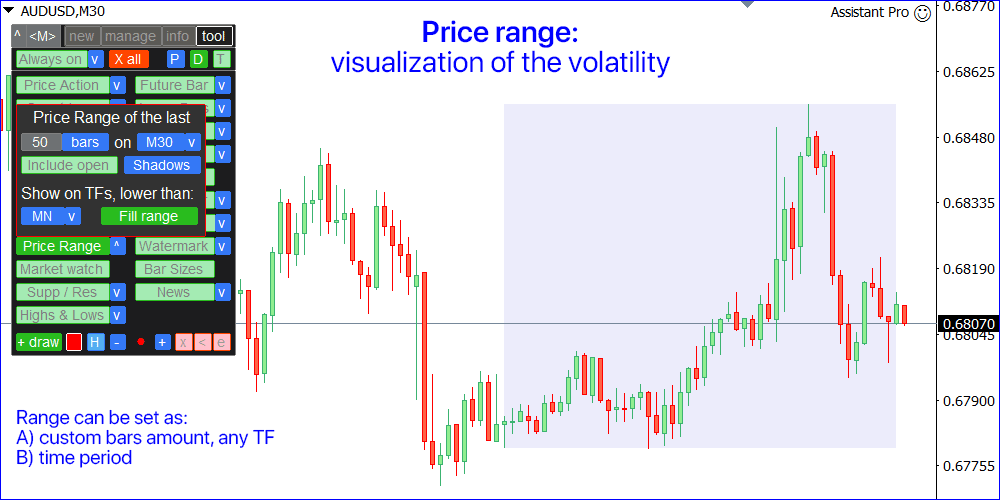
Visualization of the trading range.
Indicator settings [v]:
- Range period: amount of [minutes] / [hours] / [days] / [bars].
- Calculation method: [Shadows] (high-low prices), or [Bodies] (open-close prices).
- Select the timeframe, where the range should be displayed: e.g. if you select daily [D1] TF, the range will not be visible on the weekly timeframe, but will be visible on all timeframes lower than D1 (4H, 1H, M30...).
- If using [bars] type (pt.1), you also need to set:
a. TimeFrame for calculation.
b. [Include open] option: if active, the current (floating) bar will also be included to the range. - Color: click on the sample to change it.
[Watermark] tool
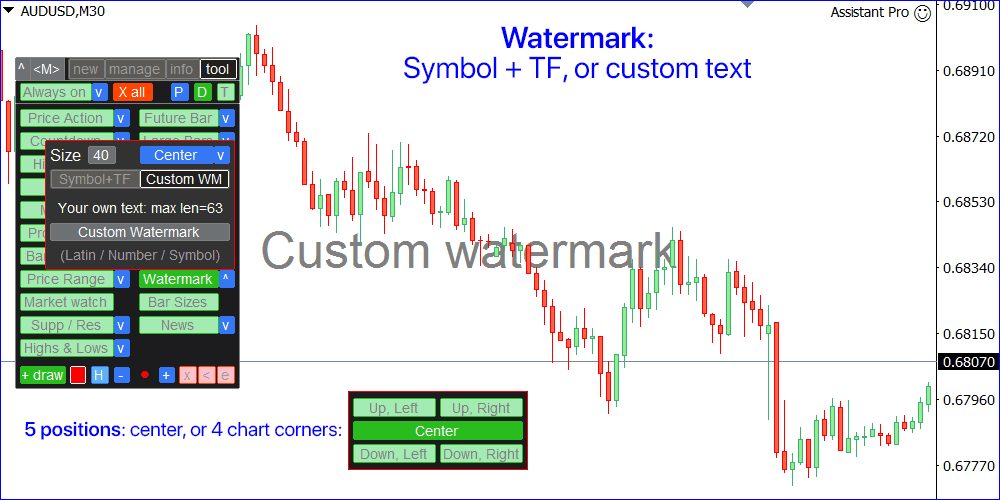
Additional text at the background of the chart.
Indicator settings [v]:
- The text size and color;
- Position, corner: Top left / Top right / Center / Bottom left / Bottom right.
- Choose what will be displayed: either the current [Symbol + TF] , or your [Custom] text.
a. When using the [Symbol+TF] option, you can also configure:
i. You can separately include the [Symbol] and [Period] to the Watermark text.
ii. [Remove Prefix] and [Remove Suffix] from the Symbol: It's convenient if the Symbol name has an additional signs, such as "EURUSD.pro".
[Market watch] tool
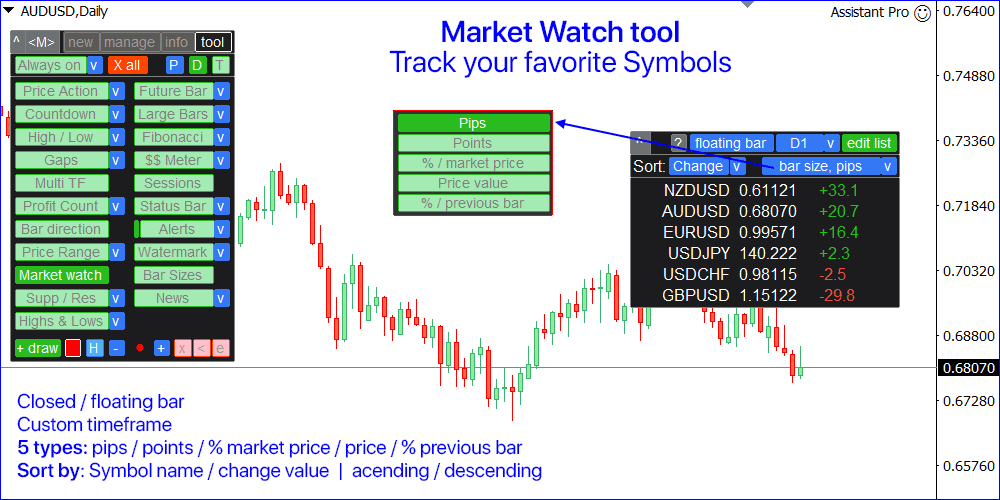
Monitor your favorite Symbols.
This tool opens in a separate window: it can be moved (drag anywhere), and minimized [v].
You can adjust the Watchlist on the panel:
- Click [edit list] to add / remove the Symbols from the Watchlist.
- Calculated value: it may either be the last [closed bar] , or the current [floating bar].
- Select the [timeframe] for calculation.
- There are 2 types of the value sorting : by the [Symbol] name, or by the price [change].
- The values can be sorted in ascending [^] or descending [v] order.
- There are 4 calculation methods, click [v] to change it:
a) [bar size, pips]: bar size, in pips;
b) [bar size, points]: bar size, in market points ;
c) [bar size, % price]: bar size, as a percentage of the price change;
d) [bar, price value]: price difference between the maximum / minimum bar prices;
e) [% / prev bar size]: the size of the calculated bar, compared to the previous bar size;
Tips: when the 'Market Watch' utility is active:
- Use the left / right keyboard buttons to switch through the list of the Symbols.
- You can also click on the Symbol name to open its chart.
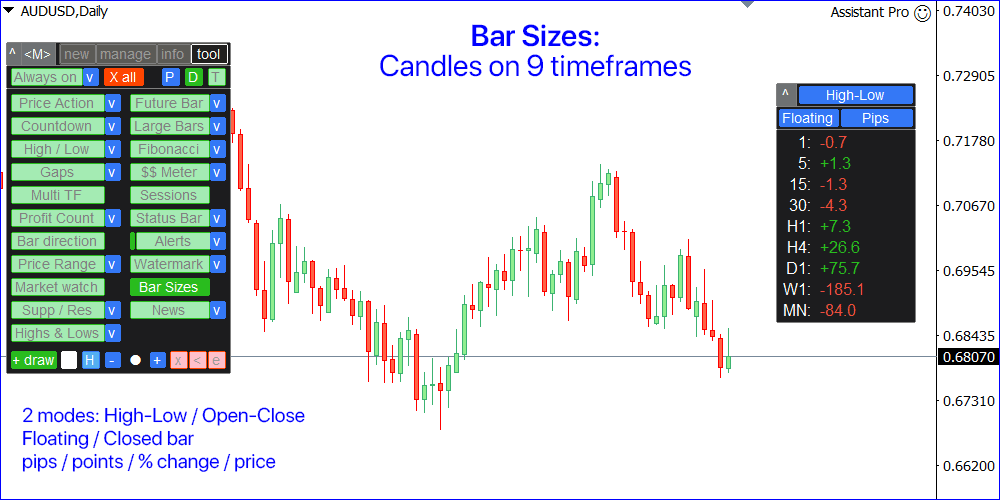
[Bar Sizes] tool
Calculates the bar sizes of 9 main timeframes.
This tool opens in a separate window: it can be moved (drag anywhere), and minimized [v].
On the panel, you can adjust the calculation:
- Prices used for calculation: [Bodies] (open-close size), or [Shadows] (high-low size).
- Select the used bar: [Floating] (currently open), or the last [Closed] bar.
- Calculation method: [Pips] / [Points] / [% change] / [Price].
[Supp / Res]: support / resistance zones
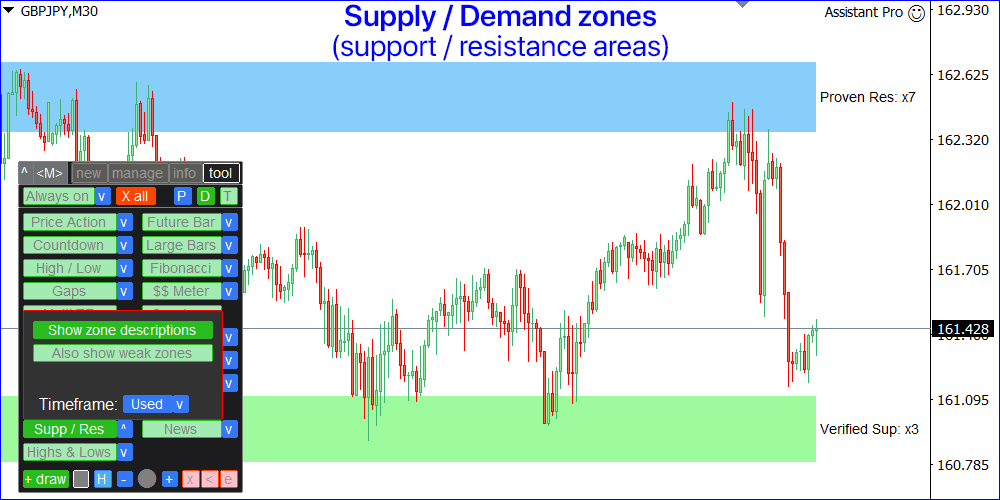
Supply / demand zones: observable areas where price has approached many times in the past.
The indicator shows where the price could potentially be reversed again.
Usually, the more times the price has been rejected from the level, the more significant it is.
Indicator settings [v]:
- [Show zone descriptions]: if active - there will be a brief info for each chart area.
- [Also show weak zones]: if active - unconfirmed zones will also be visible.
- [Always show indicator]: if active - chart zones will remain on the chart even when switching to the other tab, of minimizing the main panel.
- [Timeframe]: choose the timeframe that will be used when calculating the zones.
- You can set the basic colors : separately for the support and resistance: selected color will be less intense for a weak zones, so it will visually help you analyze the chart.
[News] tool
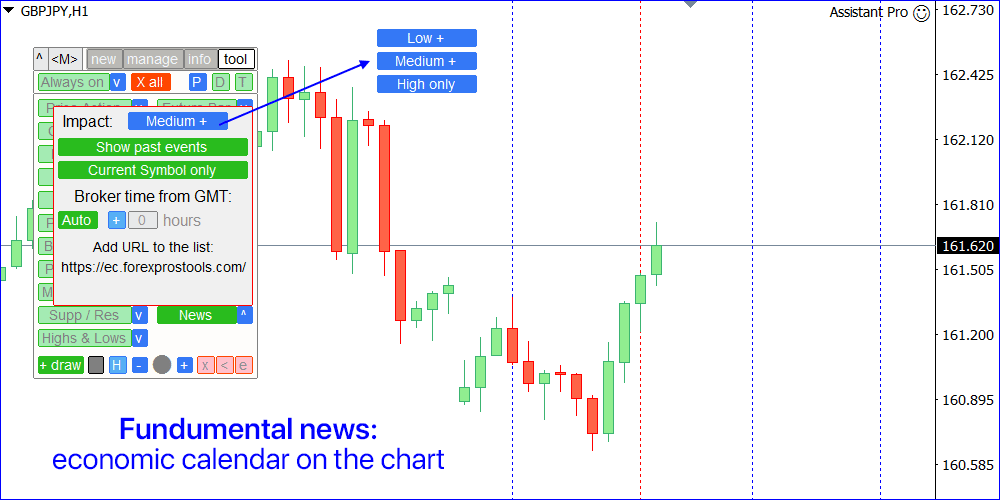
Visualization of the economic events on the chart.
The indicator draws vertical lines, showing you when economic news are coming.
During the major news, there may be an increased price volatility.
Indicator settings [v]:
- Impact: choose the news of what importance you want to see: Low+ / Medium+ / High only.
- [Show past events]: if enabled, the past events will also be visible.
- [Current Symbol only]: if active, only events related to the chart Symbol will be shown.
- Broker time from GMT: set the time difference of your broker, compared to the Greenwich Mean Time.
You use [Auto] option instead: time will be synchronized if the market is open.
When setting the time difference manually: Broker's time can be checked on the 'Market watch' (View -> Market Watch);
If GMT = 17:30, and the broker's time = 19:30: value should be +2 (hours);
If GMT = 17:30, and the broker's time = 16:30: value should be -1 (hour); - The indicator needs your permission to access an external news website:
a) In the terminal, go to the Tools -> Options (Ctrl+O) -> Expert Advisors:
b) Activate 'Allow WebRequest for listed UR L' option;
c) Add URL "https://ec.forexprostools.com/" to the list; - To set the lines color : click on the color sample (separately for each impact).
[Highs & Lows] tool
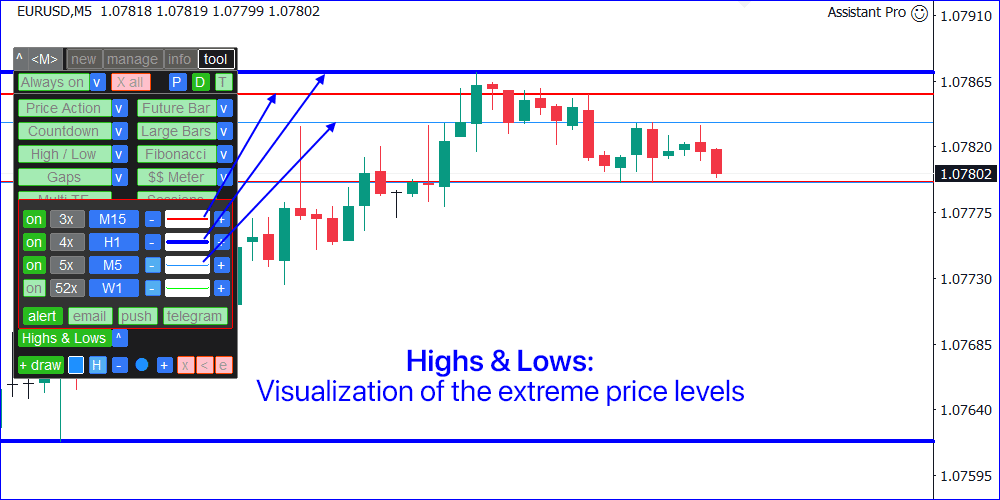
Visualization of the High and Low price levels for the selected time period.
Up to 4 different timeframes and periods can be used.
Indicator settings [v]:
- Each level can be enabled / disabled: [on] button;
- Next, you can set the number of periods to calculate:
for example, [x2] will mean the last 2 bars of the selected timeframe. - Using the [blue button] you can set the timeframe: it will be used to calculate the levels.
- [-] and [+] buttons can be used to adjust the width of the chart lines.
- Click on the line preview to adjust its color.
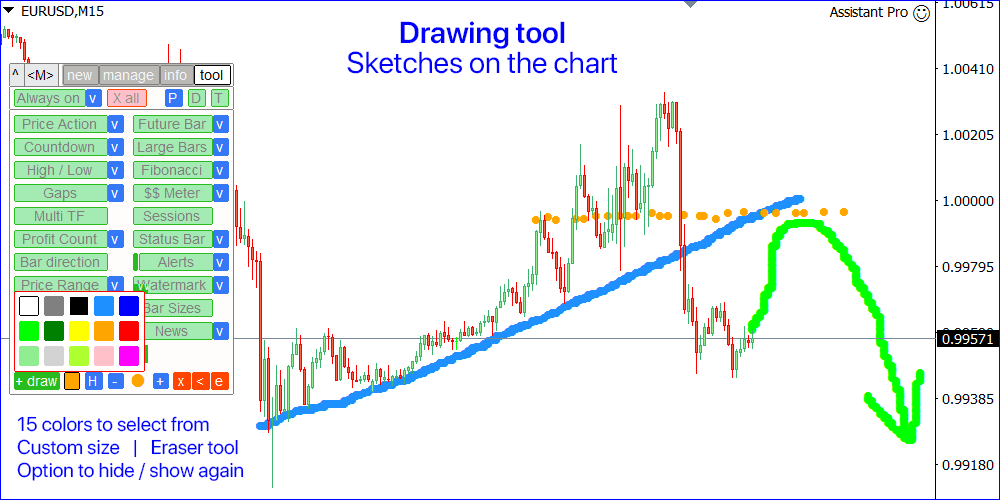
Drawing tool
At the bottom of the [tool] tab there are controls for custom drawings on the chart.
- Click [+ draw] to start drawing: hold down the left mouse button and draw on the chart.
- Click [stop X] to stop drawing.
- You can select the brush color : click on the color icon.
- Click [-] and [+] to change the brush size.
- Click [x] to remove all your drawings, or [<] to cancel the most recent drawing action.
- Click [e] to activate the Eraser: its size can be adjusted with the [-] / [+] buttons.
- You can temporarily Hide all drawings from the chart: [H] button.
However, they will not be deleted, and you will be able to Show them again - Central (additional) color can be customized in the settings [s] on the [new] tab.
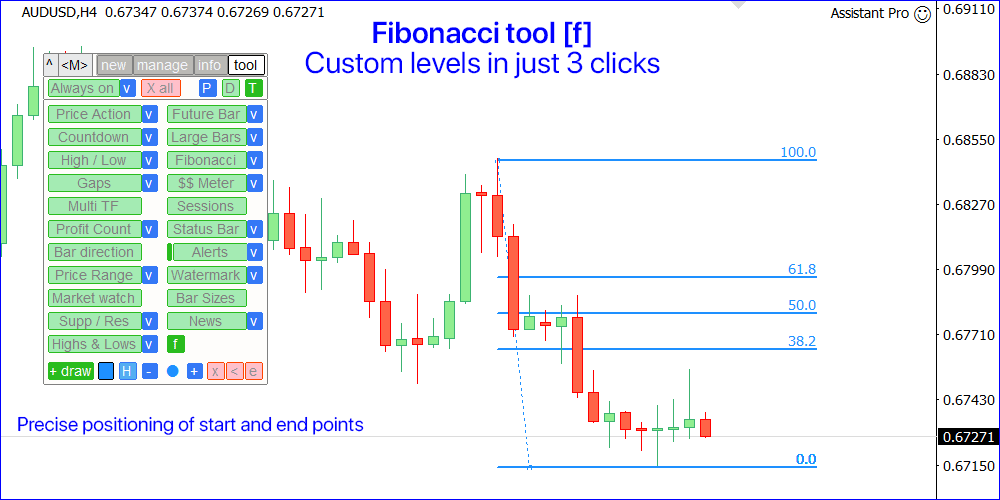
Fibonacci tool [f]
You can draw custom Fibonacci levels with precise positioning of start and end points.
When using the [f] tool - the color and width of the levels will depend on the settings you selected for the 'draw' tool.
The values of the levels are synchronized with your settings for the automatic [Fibonacci] tool.
For precise positioning, the magnet is enabled by default, but you can pause its action by holding the <TAB> key.
Levels are created in 3 clicks: the initial price, the final price, and the width of the created levels.
At each stage you will see tooltips at the top of the chart.
Links to the descriptions of the other tabs:


