How to trade manually in Strategy Tester of MetaTrader 5 using Backtest Simulator

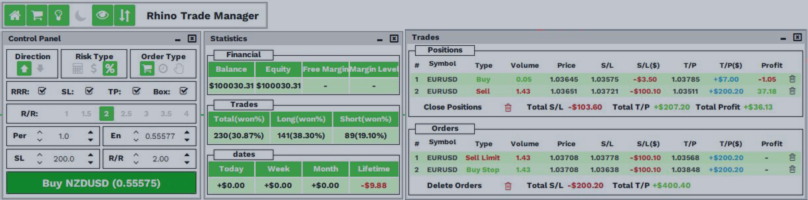
The Rhino Backtest Manager is a trade manager that works in both Live Mode and Strategy Tester Mode. Most trade managers run only on a live chart. Rhino is built to run inside the Strategy Tester as well, so you can place, manage and review trades on historical data with the same interface you use on a live account.
This page is the user manual. It covers every window of the panel, the meaning of each button, and the differences between the two modes.
Before the first run you must install the fonts attached at the bottom of this post. Without them the panel is not displayed correctly.
Where to get it
- MT5 version: Rhino Backtest Manager for MetaTrader 5
- MT5 free demo: Download the demo version
- MT4 version: Rhino Backtest Manager for MetaTrader 4
Contents
- Control Panel
- Advanced TradeBox
- Trades Window
- Statistics Window
- Watch List
- Day Result Monitor
- Sticky Trades Labels
- Main Panel
- Differences between Live Mode and Tester Mode
1) Control Panel - trade execution
The Control Panel is the main interface for opening trades. It lets you execute long and short positions and pending orders, with a choice of how the volume is calculated:
- Lot size - a fixed volume
- Budget - a fixed amount of risk in the account currency
- Percentage of balance - risk as a share of the account balance
Orders can be placed as Instant, Limit or Stop orders in a few clicks.
Risk and order management. The Risk-Reward ratio (RR), Stop Loss (SL) and Take Profit (TP) can each be activated or deactivated for a trade.
Custom order settings.
- Adjust the order volume according to the selected risk type.
- Set the entry price for limit and stop orders.
- Define the SL and TP distances in points.
- Configure the Risk-Reward ratio so SL and TP are calculated automatically.
Dynamic input controls.
- Manual entry. In Live Mode, values can be changed by typing directly into the input fields. This is not available in Tester Mode, because MetaTrader does not accept keyboard input inside the Strategy Tester.
- Quick adjustment. The left up and down arrows change a value in 1x steps. The right up and down arrows change it in 10x steps.
- Market price reset. Click the En label to reset the entry price to the current market price - Ask for a long trade, Bid for a short trade.
Quick RR setup and execution. Predefined RR buttons select the common Risk-Reward ratios. Once the order settings are valid, click Purchase to send the request. The button changes to Please Wait... while the order is processed, and the broker's response confirms the result.
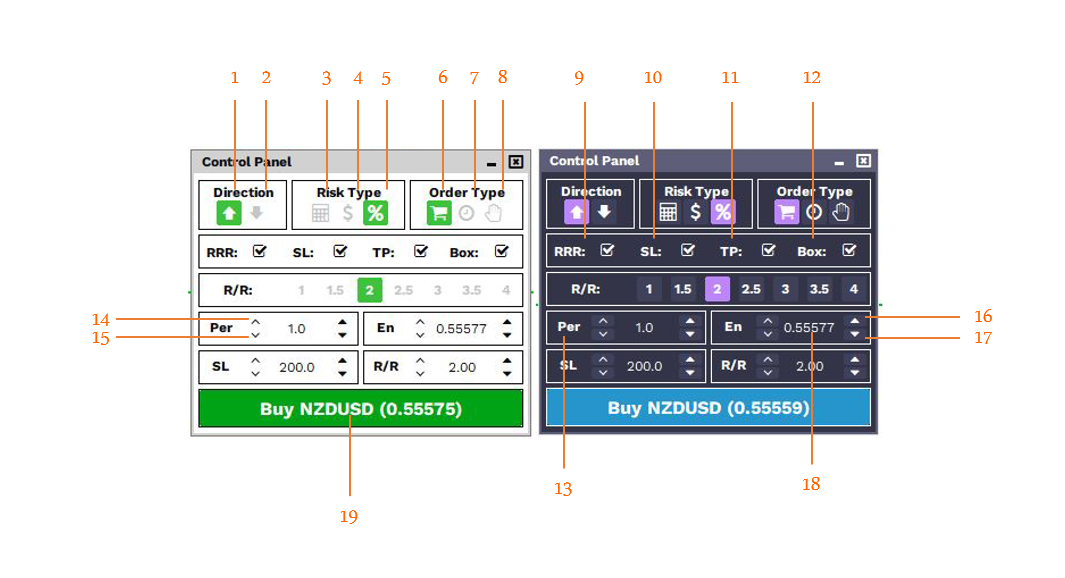
Control Panel elements:
- Buy (Long)
- Sell (Short)
- Lot size risk
- Budget risk (fixed amount)
- Percentage risk (share of balance)
- Instant order
- Limit order
- Stop order
- Activate / deactivate Risk-Reward ratio
- Activate / deactivate Stop Loss
- Activate / deactivate Take Profit
- Show / hide the Advanced TradeBox
- Label of the control unit
- Up arrow, increase by 1x
- Down arrow, decrease by 1x
- Up arrow, increase by 10x
- Down arrow, decrease by 10x
- Amount of the control unit, editable with the keyboard in Live Mode
- Purchase button
2) Advanced TradeBox
The Advanced TradeBox shows the Stop Loss, Take Profit and entry price of the order you are preparing, together with what each level is worth in money before the order is sent.
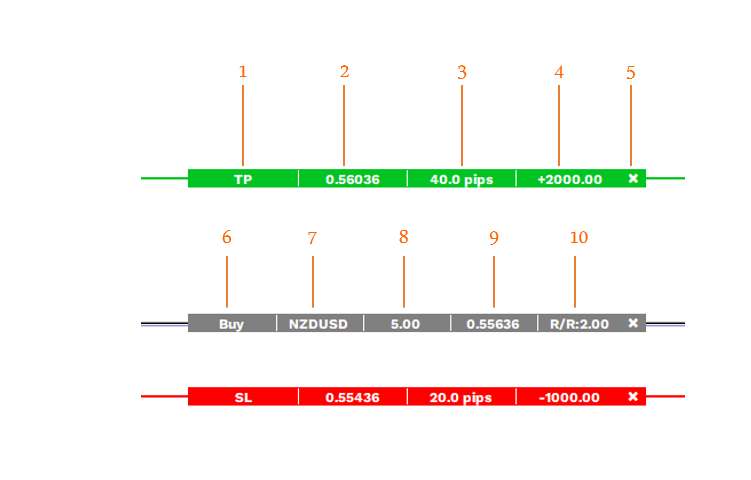
TradeBox elements:
- Role of the label, in this example the Take Profit
- Price level
- Distance in pips from the entry price
- Profit or loss if the level is reached
- Close label, which deactivates the Take Profit
- Type of order
- Symbol
- Lot size
- Entry price
- Risk-Reward ratio
For the Stop Loss the labels and buttons are the same as for the Take Profit.
In Live Mode the Stop Loss and Take Profit can also be moved directly on the chart by dragging them. This is not available in Tester Mode.
3) Trades Window - trade monitoring
The Trades Window gives an overview of all active positions and pending orders. It has two sections:
- Positions - all open trades
- Orders - limit and stop orders waiting to be triggered
Information shown for each trade: symbol, volume, direction, entry price, Stop Loss price and the loss it would produce, Take Profit price and the profit it would produce, the current result, and a button to close or delete the trade.
Additional functions.
- Chart navigation. Click a symbol to open its chart. Available in Live Mode.
- Batch close and delete. One button closes all positions or deletes all pending orders.
- Combined result. The window shows the total profit or loss that would result if every Stop Loss or every Take Profit were reached, alongside the current total for open positions.
- Automatic activation. When the market price reaches the entry price, a pending order is activated and moves to the Positions section.
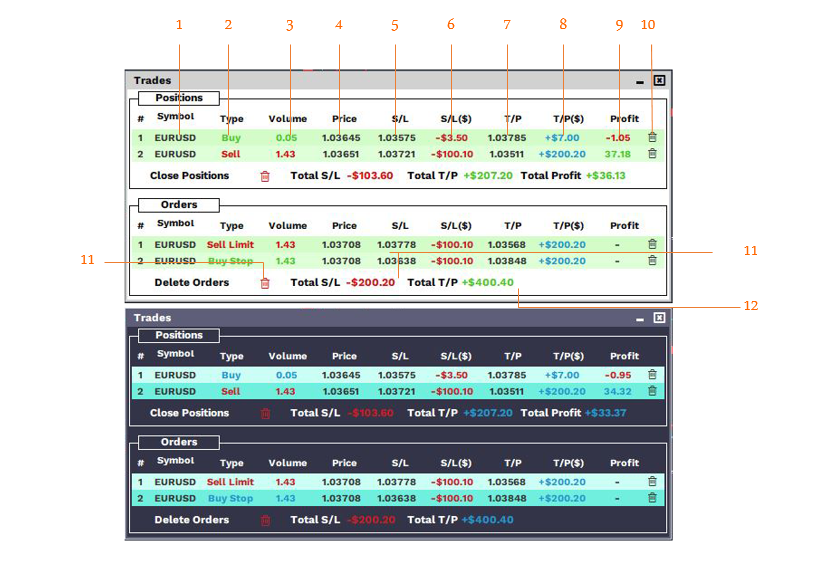
Trades Window elements:
- Symbol
- Direction
- Volume
- Price
- Stop Loss level
- Loss if the Stop Loss is reached
- Take Profit level
- Profit if the Take Profit is reached
- Current profit
- Close or delete button
- Close all or delete all button
- Sum of the losses if all Stop Losses are reached
- Sum of the profits if all Take Profits are reached
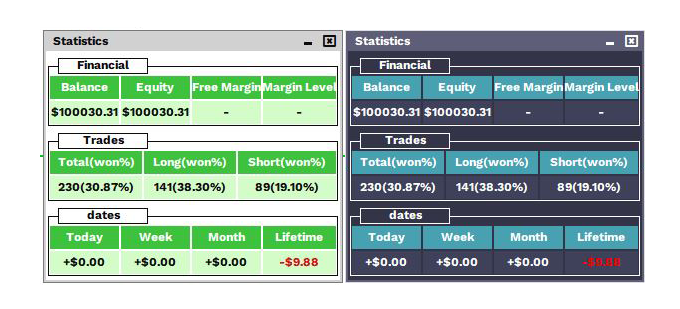
4) Statistics Window
The Statistics Window shows current and historical trading data in three groups.
Account data: balance, equity, free margin and margin level.
Trade performance: total number of trades and win rate, with long trades and short trades listed separately with their own win rate.
Net profit by period: today, the current week, the current month, and the whole account history.
5) Watch List
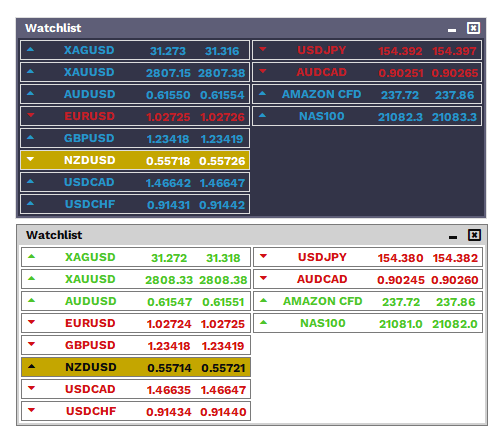
The Watch List is available in Live Mode only. It is disabled in Tester Mode because of chart limitations in the Strategy Tester.
- Shows all symbols from Market Watch with their current Bid and Ask prices.
- Price changes are colour coded, so the direction of the move is visible at a glance.
- Clicking a symbol switches to its chart and highlights the selected instrument.
6) Day Result Monitor
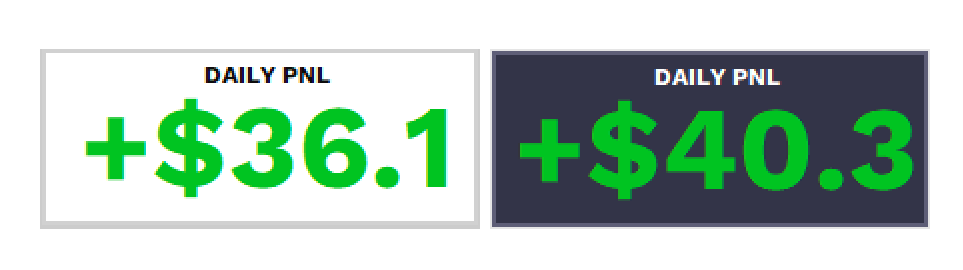
A floating window fixed to the top right corner of the chart. It shows the net profit or loss of the current trading day in a large font, so the day's result is readable at a glance while you work.
7) Sticky Trades Labels
The Sticky Trades Labels show open trades directly on the chart. Each label contains:
- Trade type - buy or sell, and whether it is a limit or stop order
- Lot size and volume
- Current profit, for active trades
- A horizontal line marking the entry price
- A close or delete button for that individual trade
The labels can be shown or hidden from the Main Panel.
8) Main Panel
The Main Panel is the central hub that opens and closes the other windows.
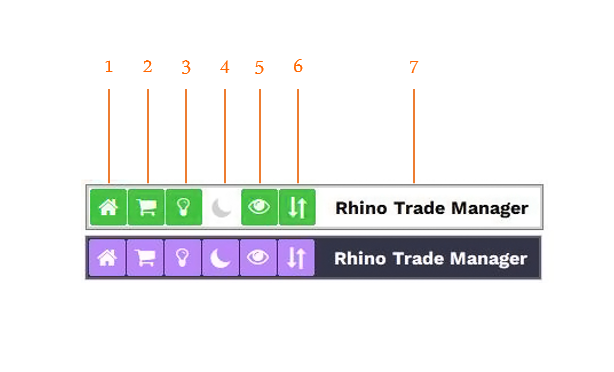
- Control Panel
- Trades Window
- Statistics Window
- Theme, switching between dark and light mode
- Show or hide the Sticky Labels
- Watch List, in Live Mode only
- Logo
9) Differences between Live Mode and Tester Mode
| Function | Live Mode | Tester Mode |
|---|---|---|
| Instant, limit and stop orders | Yes | Yes |
| Stop Loss, Take Profit, Risk-Reward ratio | Yes | Yes |
| Trades Window and batch closing | Yes | Yes |
| Statistics Window | Yes | Yes |
| Sticky Trades Labels | Yes | Yes |
| Dark and light theme | Yes | Yes |
| Watch List | Yes | No |
| Moving SL and TP by dragging on the chart | Yes | No |
| Typing values with the keyboard | Yes | No |
In Tester Mode all values are set with the arrow buttons instead of the keyboard, in 1x or 10x steps.
Using your own indicators in the Strategy Tester
Set up the chart with your indicators in Live Mode, then save the template under the name tester.tpl. The indicators are loaded automatically when the Strategy Tester runs.
Get the product
- MT5 version: Rhino Backtest Manager for MetaTrader 5
- MT5 free demo: Download the demo version
- MT4 version: Rhino Backtest Manager for MetaTrader 4
- Fonts: Download Zip file of Fonts
If something in this manual is unclear, or you would like a feature added to a future version, send me a private message.