That is the feature.
A trend-following engine on four uncorrelated markets, with a CatBoost meta-model compiled to ONNX and embedded inside the .ex5. Small losses, often. Large winners, rarely. The payoff ratio does the work — not the win rate.
XAUUSD · USDJPY · USTEC · BTCUSD — one H1 chart runs all four.
Scope // model confidenceDemo
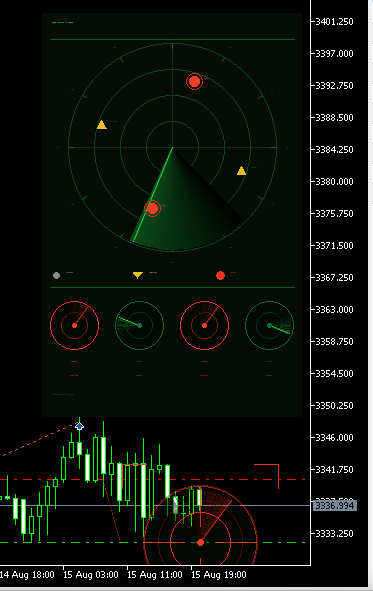
Illustrative animation of the on-chart panel. Not live market data.
▌ Out-of-sample backtest · 2025 → mid-2026
The numbers first, before the story
Nothing below was measured on data the model was trained on. If a figure looks unimpressive next to the pages you usually read, that is the honest gap between marketing and measurement.
Backtest results under a conservative cost model. Past performance does not guarantee future results; live results will differ.
There are only two ways to show a 99% win rate
A tiny take-profit behind a giant stop
Ninety-nine wins of +0.1R look beautiful on a chart until the single hidden −40R arrives and takes the year back with it. The equity curve is smooth right up to the vertical drop.
Martingale, wearing a different name
Averaging down, grid recovery, "smart re-entry" — the loss is never booked, only postponed and multiplied. The win rate stays at 99% until the account reaches zero.
It wins fewer than half its trades, caps every loss with a hard stop placed alongside the order, and lets the winners ride a trailing exit with no upper cap — the average winner ends up 2.22× the average loser. That asymmetry is the entire edge. Nothing is recovered by adding to a losing position, because nothing is ever added to a losing position.
One number proves nothing. Here is the whole table.
Sales pages quote a single figure — net profit, or a win rate — because a single figure can be made to look like anything. A tester report cannot. Every line below comes from one out-of-sample run, and the uncomfortable lines are on it too.
| Total trades | 571 — enough for the statistics to mean something |
|---|---|
| Winners / losers | 255 (44.66%) / 316 (55.34%) |
| Profit factor | 1.79 |
| Payoff ratio | 2.22 — average win 113.93, average loss 51.35 |
| Max balance drawdown | 6.90% · on equity 8.90% |
| Recovery factor | 6.61 · Sharpe ratio 4.60 |
| Longs / shorts | 355 longs (47.32% won) · 216 shorts (40.28% won) |
| Worst losing streak | 16 trades in a row — read that line twice before buying |
| Largest single loss | 172.05 — no outlier loss hiding anywhere |
| Conditions | 0.5% risk per trade, 98% history quality, conservative cost model |
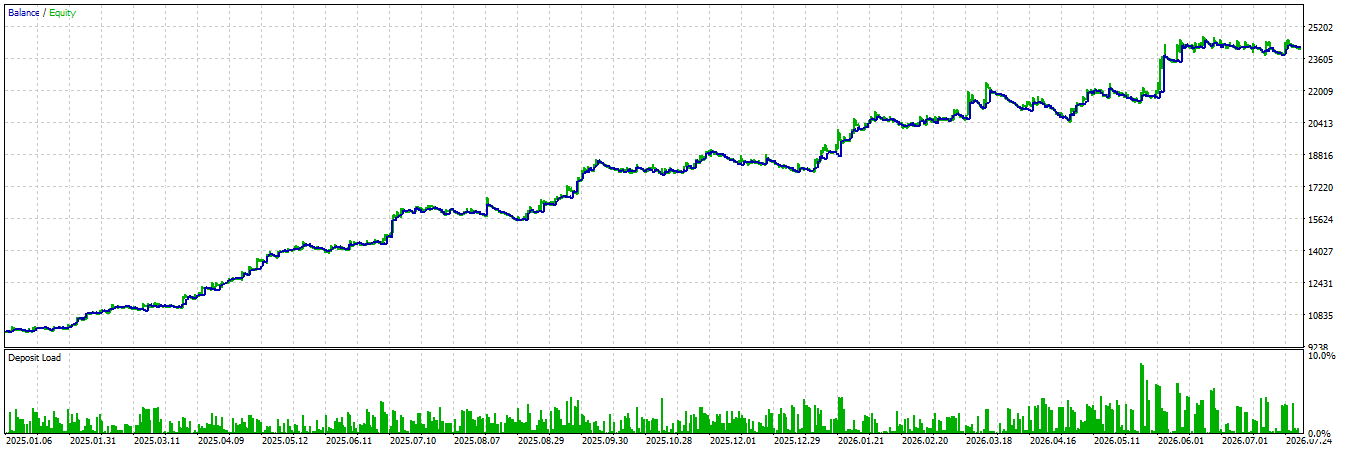
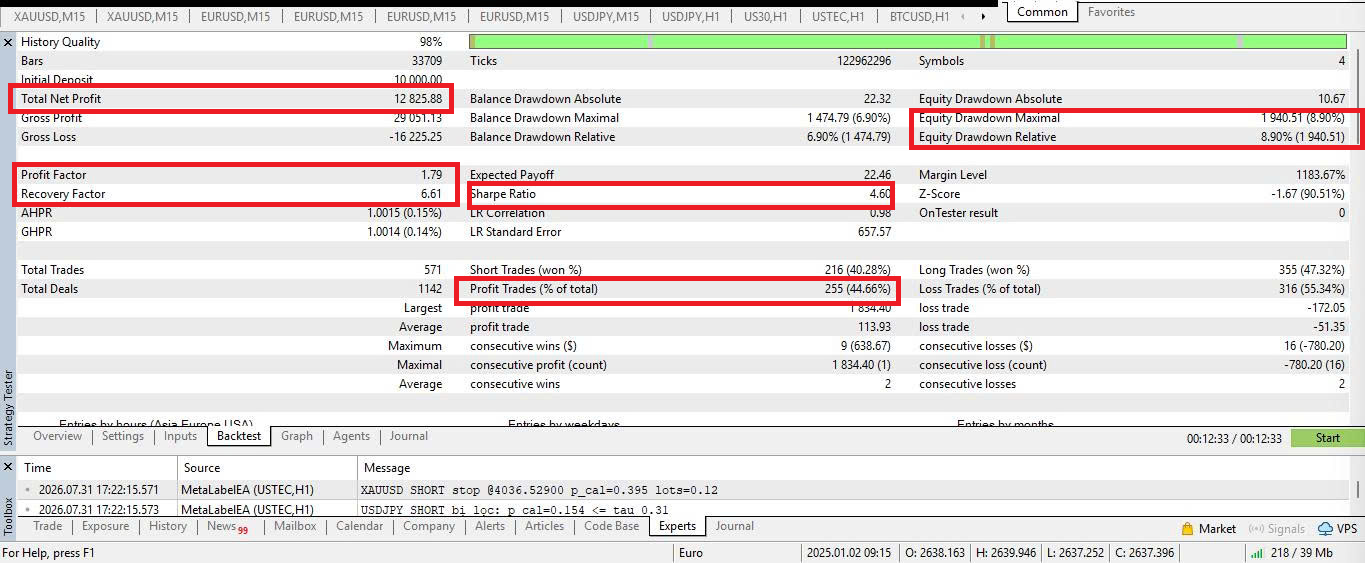
A page that shows you one number and no table is asking you to trust the number. A page that shows you the table is asking you to check it.
The standards it holds to
See what the model sees
A phosphor-green radar tracks all four markets at once. Each blip is a symbol; its distance from the centre is the model's live confidence. When a stop order goes in, a target lock pins the exact entry price on your chart — score against threshold, filter margins, stop level, lot size. Open another traded symbol's chart and the lock projects there too.
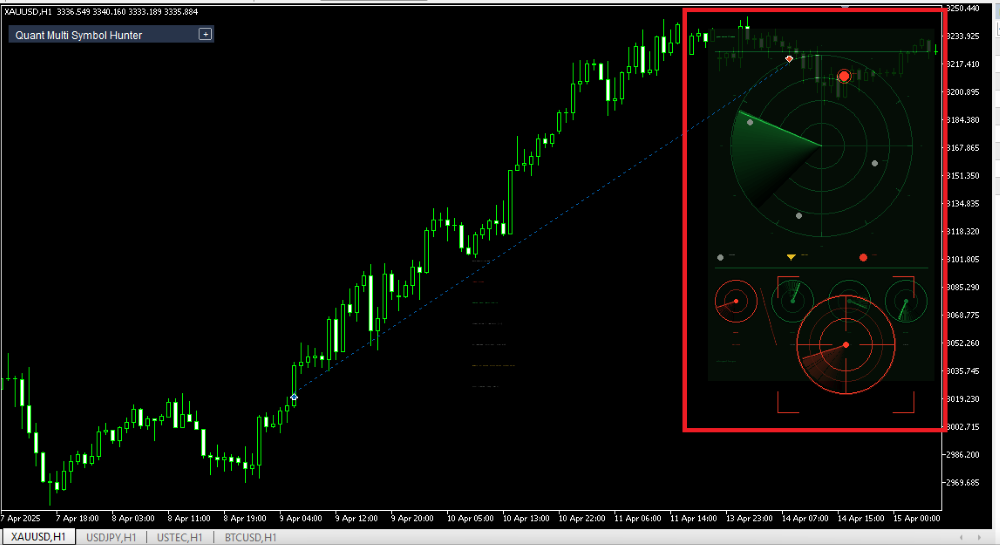
Pure visualisation: zero interference with trading logic, and one input switches it off entirely. You should never have to guess what your EA is thinking.
A performance dashboard, not just a trade log
The radar shows you what the model is thinking right now. The dashboard shows you what it has actually done — on the chart, in the terminal, without exporting anything to a spreadsheet first.
| Symbol | Side | Lots | P&L |
|---|---|---|---|
| XAUUSD | — | - | - |
| USDJPY | — | - | - |
| USTEC | SELL | 0.04 | - |
| BTCUSD | — | - | - |
On the chart, at a glance
A compact summary panel sits beside the radar: balance, equity, floating P&L, and a line per traded market showing side, lot size and open result. Underneath, the panel states plainly whether the AI filter is active and at which threshold — so you always know which configuration produced the trades you are looking at.
The full dashboard
Open the dashboard and the same account is broken down across three tabs — Report, Symbol Info and Account Info — over any date range you choose, filtered by magic number so a shared account stays readable.
- ▸ Balance curve — equity and balance plotted together, so floating drawdown is visible rather than hidden between closes
- ▸ Long / short ratio — deal counts and P&L split by direction, which is how you find out whether an edge is one-sided
- ▸ P&L by month and by day — the bar charts that show consistency or the lack of it, including the losing months
- ▸ Detailed stats and growth stats — daily, weekly, monthly and yearly growth side by side against your own targets
- ▸ Export CSV — take the raw records into Excel or Python and check every claim on this page yourself
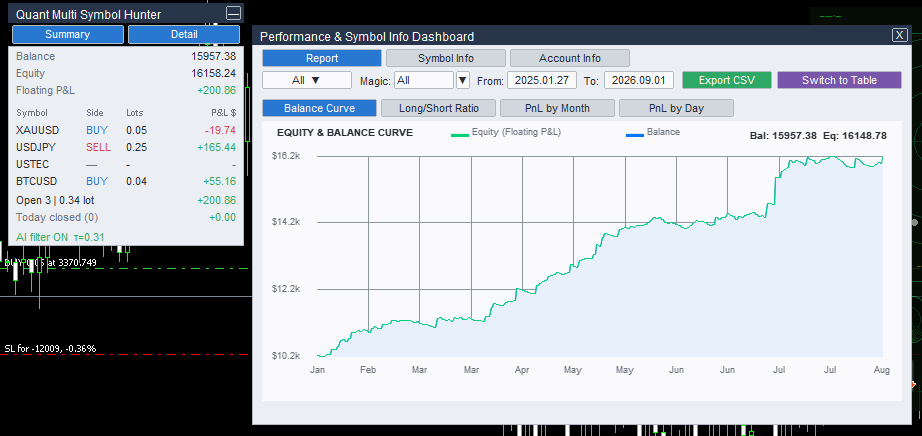
Balance curve. Equity and balance drawn together, so floating drawdown between closes is visible instead of hidden.
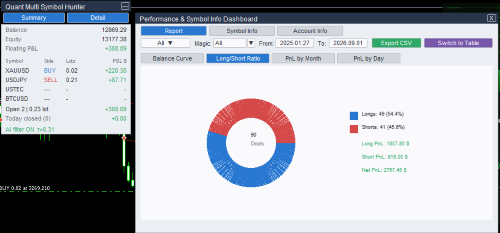
Long / short split. Deal counts and P&L per direction — how you find out whether an edge is one-sided.
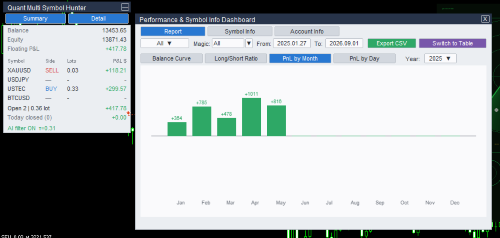
P&L by month. Consistency, or the lack of it, including the losing months.
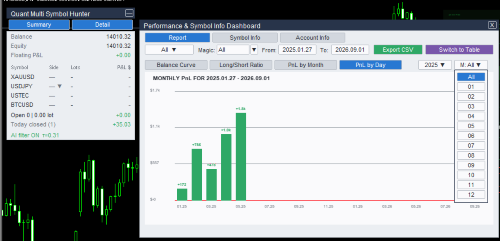
P&L by day. The same picture at higher resolution across the full date range.
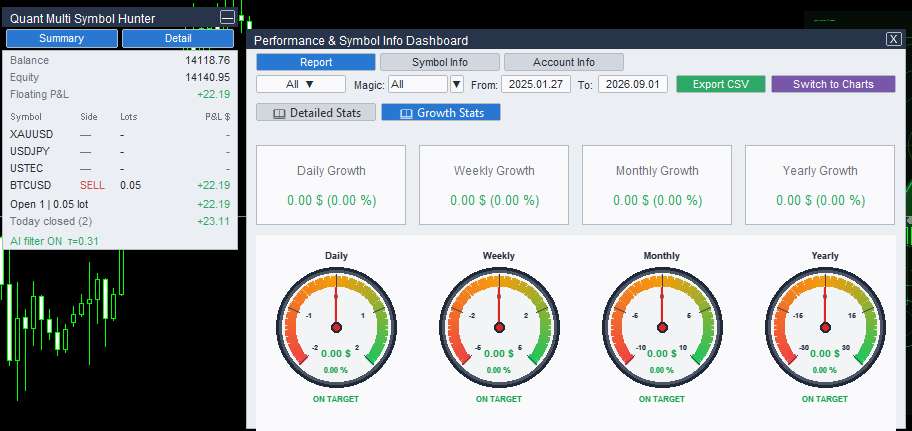
Growth stats. Daily, weekly, monthly and yearly growth measured against your own targets.
Panel layout shown for illustration; values are placeholders. The dashboard reads your own account and works identically in Strategy Tester and on a live chart. Like the radar, it is display only — one input turns it off.
What you install
| Markets | XAUUSD, USDJPY, USTEC, BTCUSD — symbol names are editable inputs (rename to NAS100, BTCUSD.x, and so on). Unknown symbols are skipped safely. |
|---|---|
| Timeframe & charts | H1 logic. Attach to a single H1 chart of any traded symbol; the EA manages all four markets from that one chart. |
| Order handling | Breakout entries via stop orders, one position per direction, hard stop-loss on every trade, adaptive trailing exit. |
| Position sizing | Fixed fractional, 0.5% of equity per trade by default and adjustable. No lot multiplication after a loss. |
| Dependencies | None. Model, calibrator and threshold are embedded in the EA file — no extra downloads, and it runs in Strategy Tester out of the box. |
| Reporting | On-chart summary panel plus a performance dashboard: balance curve, long/short split, P&L by month and by day, growth stats, date and magic filters, CSV export. Works in Strategy Tester and live. |
| Account | Hedging account, low-spread broker, VPS recommended. Swap-free is ideal if you hold multi-day trends. |
Who should run this — and who should not
- ▸ You read a 10% drawdown as normal, not as a malfunction
- ▸ You can sit through a losing streak of sixteen trades without touching inputs
- ▸ You run a VPS and let the system work uninterrupted
- ▸ You judge a system by its process and its out-of-sample numbers
- ✕ You want an account doubled this month
- ✕ You need most trades to be winners to stay comfortable
- ✕ You plan to disable the stop loss during an open trade
- ✕ You are trading money you cannot afford to lose
If that second column describes you, this EA is not for you — and honestly, no EA is.
Before you buy
Don't trust the page. Trust the numbers you produce yourself.
Download the demo, run your own backtest on your own broker's data, and watch the radar make its calls before you commit a single unit of capital. That scepticism is the philosophy this EA was built on.
Test on demo first. Trade only capital you can afford to lose.
Risk disclosure. Trading leveraged products carries a substantial risk of loss and is not suitable for every investor. All statistics on this page are out-of-sample backtest results measured under a conservative cost model; live trading results will differ because of spread, slippage, swap, execution and market conditions. Past performance does not guarantee future results. Nothing here is a promise of profit, a performance guarantee, or financial advice. Test thoroughly on a demo account before any live deployment.
Quant Multi Symbol Hunter · MetaTrader 5 Expert Advisor