
Forex and Cryptocurrencies Forecast for November 28 - December 02, 2022

EUR/USD: FOMC Protocol Dropped the Dollar
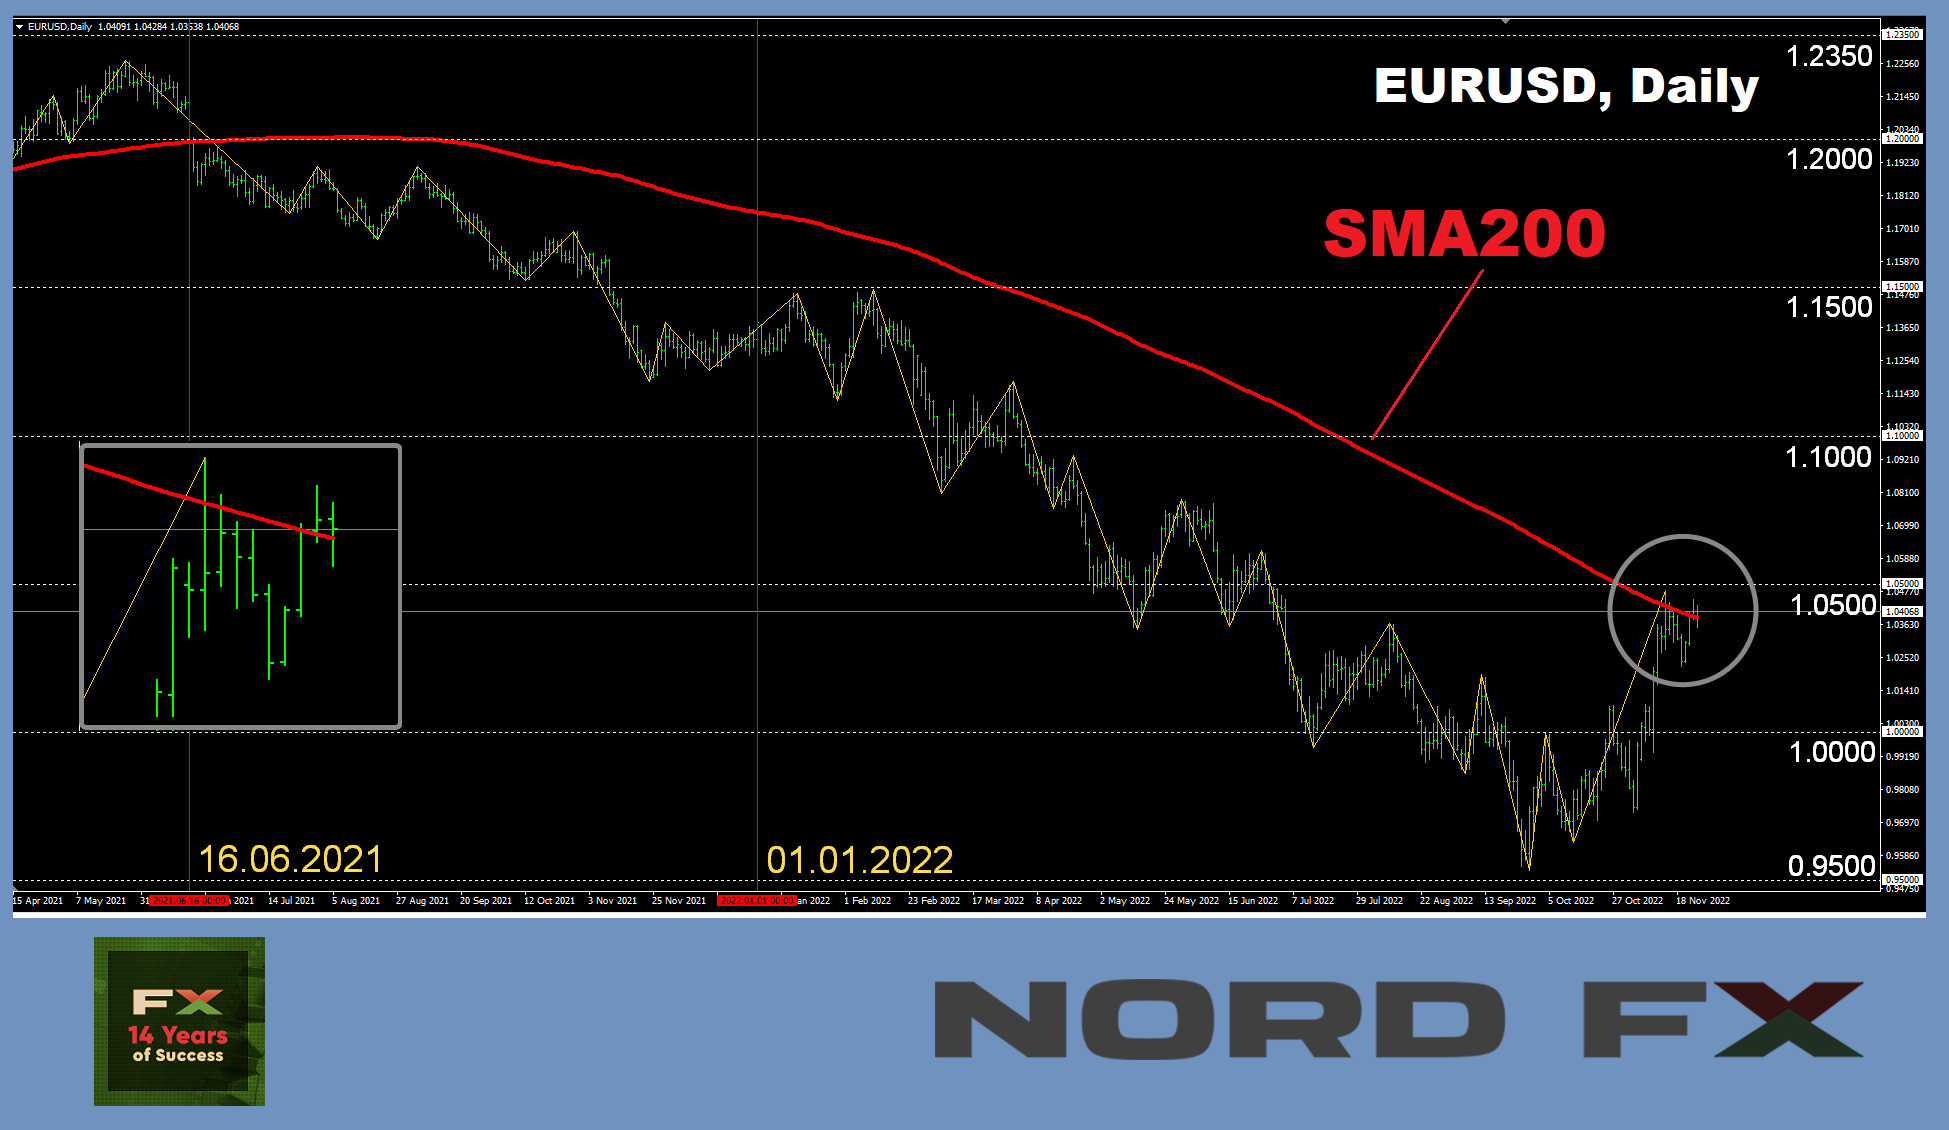
● Last week ended quietly: the US celebrated Thanksgiving. But its first part was marked by the weakening of the dollar, as a result of which EUR/USD rose by more than 200 points, from 1.0222 to 1.0448. It has risen above its 200-day moving average (SMA) for the first time in 17 months, since June 16, 2021.
The reason for this behavior of the US currency was the forecasts regarding the future policy of the US Federal Reserve. Market participants expect the regulator to slow down the rate of interest rate hikes significantly. And the minutes of the November meeting of the FOMC (Federal Open Market Committee), published on November 23, confirmed the validity of such expectations.
They state that “Some of the Fed's leaders have observed that monetary policy has reached a point where it is sufficiently restrictive to meet FOMC targets and it would be appropriate to slow down the rate hike. The vast majority of participants in the meeting considered that a slowdown in the pace of recovery is likely to be appropriate in the near future.”
At the same time, some of the FOMC members believe that the rate "should reach a slightly higher level than previously expected," since both inflation and the imbalance of supply and demand in the US economy remain at a fairly high level. Combining these two points of view, we can conclude that the peak of monetary tightening (QT) may be higher than previously planned, but the rise to it will be longer and smoother.
● Recall that the Fed has raised rates by 75 basis points (bp) four times in a row, and the market is now expecting a 50 bp rise in December, with the prospect of moving to a step of 25 b.p. in 2023. The key rate for the dollar is 4.00% at the moment.
As for actions on the other side of the Atlantic, the ECB raised the euro rate by 50 bps in July and then twice by 75 bps, and it is at 2.00% now. The swap market estimates it will rise by 50 b.p. in December, with a probability of 62%, and by 75 b.p. with a probability of 38%. The European regulator may also move to a step of 25 b.p. next year. In this case, the gap between the rates on the dollar and the euro will remain, which will give EUR/USD an incentive to fall below the parity line of 1.0000 again.
● It should be noted that the ECB's monetary tightening has not had a suffocating effect on the European economy so far. Moreover, there is a way out of the energy crisis caused by the sanctions imposed on Russia because of its armed invasion of Ukraine. The EU countries have decided to exclude Russian gas from joint purchases. European Commissioner for Energy Kadri Simson said that the EU managed to replace the Russian fuel completely with the help of energy resources from other sources. Gas storages, primarily in Germany, are already filled to the very neck. And the risks of Europe experiencing rolling blackouts or freezing this winter have been drastically reduced.
Against this background, the Business Activity Index (PMI) in the German manufacturing sector rose from 45.1 to 46.7 instead of the expected fall, while it rose from 47.3 to 47.8 in the Eurozone as a whole. The IFO business climate index in Germany has also started to improve: with the forecast of 85.0, it rose from 84.5 to 86.3 in reality. These macro statistics, along with Germany's GDP growth of 0.4% in Q3 (0.1% in Q2, the forecast is 0.3%), give the ECB the green light for further rate hikes. And this, in turn, according to a number of analysts, may push EUR/USD further up, to the zone of 1.0500-1.0600.
● The week closed at 1.0400, above the 200-day SMA. Scotiabank experts believe that this could strengthen the bullish momentum. And their colleagues from Commerzbank say that the comfort level for the pair is likely to be between 1.0400 and 1.0500. In general, among the analysts surveyed, 30% of analysts expect the pair to continue to grow, and 40% expect it to turn to the south. The remaining 30% of experts point to the east. The picture is different among the oscillators on D1. All 100% of the oscillators are colored green, while 15% is in the overbought zone. Among the trend indicators, the 100% advantage is on the green side.
The immediate support for EUR/USD is at the 1.0380 horizon, then there are levels and zones 1.0280-1.0315, 1.0220-1.0255, 1.0130, 1.0070, 0.9950-1.0010, 0.9885, 0.9825, 0.9750, 0.9700, 0.9645, 0.9580 and finally, the September 28 low at 0.9535. The next target of the bears is 0.9500. Bulls will meet resistance at levels 1.0430-1.0450, 1.0480, 1.0620, 1.0750, 1.0865, 1.0935.
GBP/USD: How Long Will the Pound Continue to Grow?
● Despite the gloomy global outlook for the pound, a bullish scenario worked in the short term, voted by most experts, 85% of trend indicators and 100% of D1 oscillators. GBP/USD hit its highest level in three months at 1.2153 on Thursday, November 24. As in the case of the euro and other G10 currencies, the reason for its growth was not the achievement of the pound, but the weakening of the dollar.
● The final chord for the pair sounded slightly below the maximum, at around 1.2095. According to Scotiabank strategists, the British currency rebounded strongly enough from the all-time low of September 26 (1.0350) to hold on to current levels. Fiscal policy in the UK has stabilized, market confidence has strengthened, and the pair's uptrend has been fairly stable. These factors, according to Scotiabank, should help the GBP/USD quotes stabilize in the 1.2000 area for the foreseeable future, and possibly even rise a little higher.
Analysts at ING, the largest banking group in the Netherlands, point to an even higher target. “We believe positioning has played a major role in the recovery of the pound, and GBP/USD could see further temporary gains towards the 1.22/23 area, which we see once again as the best level for the rest of the year,” they write.
● At the same time, experts do not rule out a new bearish impulse and draw attention to the risks of the end of this year and the beginning of 2023, when the Central Banks of leading countries will raise rates during the recession. As we wrote earlier, rising inflationary pressures in the UK could lead to more aggressive rate hikes by the Bank of England (BoE). However, according to many economists, the regulator is likely to avoid drastic steps, since excessive tightening of monetary policy could knock out the UK economy for two long years. According to forecasts, the UK's current account deficit will remain at more than 5% of GDP in 2023-24. The result of such careful actions of the BoE may be the resumption of the downtrend of the British currency
● The median forecast for the near term does not give any clear guidance: 45% of experts side with the bulls, exactly the same number side with the bears, and the remaining 10% prefer to remain neutral. Among the oscillators on D1, 100% are on the green side, however, 25% of them give signals that the pair is overbought. Among the trend indicators, the ratio of 85% to 15% is in favor of the greens, like a week ago. The levels and support zones for the pair are 1.2030, 1.1960, 1.1800-1.1840, 1.1700-1.1720, 1.1600, 1.1475-1.1500, 1.1350, 1.1230, 1.1150, 1.1100, 1.1060, 1.0985-1.1000, 1.0750, 1.0500 and the September 26 low of 1.0350. When the pair moves north, it will meet resistance at the levels of 1.2150, 1.2210, 1.2290-1.2330, 1.2425 and 1.2575-1.2610.
● Among the events concerning the economy of the United Kingdom, Thursday 01 December attracts attention this week, when the value of November's Business Activity Index (PMI) in the country's manufacturing sector will be known.
USD/JPY: The Yen Thanks the Fed
● As an analyst wrote, "The whole world (except the US) thanks the Fed for the minutes of its meeting, which reinforced the dovish reversal, crashing the dollar and US bond yields, and gave respite to the fallen currencies around the world." Indeed, the DXY Dollar Index went down and 10-year Treasury yields hit a 7-week low.
As the yields on these US Treasuries declined, the Japanese currency was among the leaders of growth, and USD/JPY rushed to November lows once again, finding a bottom at 138.04 this time.
(Recall that there is a fairly stable correlation between US government bond rates and USD/JPY. And if the yield on securities increases, so does the dollar against the yen. If the 10-year Treasury bill yield falls, the yen rises, and the pair forms a downtrend).
● Strategists at Singapore's United Overseas Bank (UOB) say that if the dollar continues to weaken, the pair might retest the 137.70 area. ING strategists look even further here. According to their forecasts, if the yield on 10-year treasuries ends 2023 at around 2.75%, USD/JPY may end up in the 125.00-130.00 zone at that moment, that is, where it was traded in May-August 2022. As for the possible upward dollar rally this December, according to ING, it will not be able to lift the pair above the 142.00-145.00 zone. There is no question of updating the maximum of October 21 and a new assault on the height of 152.00.
● In addition, we must not forget about Day X, which is scheduled for April 8 next year. It is on this day that Haruhiko Kuroda, the head of the Bank of Japan, will end hs term, and he may be replaced by a new candidate with a less dovish position. Such a change could lead to a revolutionary push for USD/JPY to the south. After that, it could end 2023 exactly where ING strategists expect it to be.
● As for the current situation, the pair closed last week at 139.05. Only 10% of analysts are counting on the fact that the dollar will try to win back at least part of the losses in the near future, and USD/JPY will turn to the north. 45% vote for a breakthrough to the south and a new fall. And another 45% find it difficult to make a forecast. For oscillators on D1, the picture looks like this: 100% are looking south, 10% of them are in the oversold zone. Among the trend indicators, the ratio is 85% to 15% in favor of the red ones.
The nearest strong support level is located in the zone 138.00-138.30, followed by the levels and zones 137.50-137.70, 136.00, 135.55, 134.55 and the zone 131.35-131.75. Levels and resistance zones are 139.85, 140.60, 142.20, 143.75, 145.30, 146.85-147.00, 148.45, 149.45, 150.00 and 151.55. The purpose of the bulls is to rise and gain a foothold above the height of 152.00. Then there are the 1990 highs. around 158.00.
● No important events regarding the state of the Japanese economy are expected this week.
CRYPTOCURRENCIES: Market of Rumors and Fears
● BTC/USD fell to its lowest level in two years on Monday, November 21. It was also trading in the $15,500 area on November 21, 2020. The local bottom was found at $15,482 this time. The main cryptocurrency was kept from falling further by the growth of risk sentiment, which is pushing up the S&P500, Dow Jones and Nasdaq stock indices. Additional support was provided by the minutes of the last Fed meeting published on November 23, in which the market saw dovish sentiment. But despite this, cryptocurrencies are still under strong bearish pressure, and many experts believe that a new collapse is inevitable.
● JPMorgan analysts have warned that the collapse of major digital assets is not over, and the FTX crash crisis could act like a domino and lead to “cascading liquidations”. And now the market is gripped by anxiety related to the possible bankruptcy of Genesis, a subsidiary of the Digital Currency Group (DCG) fund. This happened after the company failed to raise $1 billion in funding. Citing the difficulties of Genesis, the lending arm of the Gemini crypto exchange has already frozen the withdrawal of client assets. Bloomberg estimates their volume at $700 million.
● Investors are already afraid of their own shadow. And then Ethereum co-founder Vitalik Buterin added fear by posting a mysterious tweet. Without going into details, he wrote that "the rumor is that something important is about to happen." Almost at the same time, information appeared from somewhere that he was getting rid of his Ethereum reserves, and this alerted the crypto community furthermore. A wallet allegedly owned by Vitalik Buterin sold 3,000 ETH worth $3.75 million in the middle of the night, just hours after FTX crashed.
● Jordan Belfort, a former stockbroker convicted of fraud and commonly known as The Wolf of Wall Street, believes that the FTX trading platform's bankruptcy was intentional, and Sam Bankman-Fried is a sociopath who implemented FTX pump and dump schemes.
The author of the world-famous book Rich Dad Poor Dad, Robert Kiyosaki, tried to soften the intensity of passions, saying that he still believes in the bright future of the two flagship digital assets bitcoin and Ethereum. According to him, bitcoin is not the same as Sam Bankman-Freed. The situation around FTX must be considered as a special case, and conclusions about the entire industry cannot be drawn only on its basis.
● But it seems that investors are in no hurry to listen to Mr. Kiyosaki. Analytics firm Glassnode said in their November 21 report that recent market weakness has “shattered the confidence of bitcoin holders” and the looming crypto winter is following in the footsteps of its 2018-19 predecessor. According to Glassnode, most of the whales (wallets with more than 1,000 BTC) are now lying on the bottom, waiting for better times.
At the height of the previous bear market, bitcoin fell by 84% from its maximum. It took just under a year for the asset to fall from $20,000 in November 2018 to $3,200. It took about the same time this time to drop 77.3% and crash from $69,000 on November 21 to a new cycle low of $15,482. At the same time, some analysts believe that BTC should not be expected to recover soon, because several months had passed after the collapse of 2018 before the first noticeable upward impulse appeared.
In addition, last week saw the fourth-largest spike in realized losses with a daily volume of $1.45 billion. This dumping of crypto assets by long-term players “is often a sign of fear and capitulation among this more experienced cohort,” the Glassnode report notes.
● According to the IntoTheBlock platform, out of 47.85 million BTC holders, 24.56 million addresses (51%) suffer losses. About 45% of wallets are still in the black, and the remaining addresses are in the break-even zone. According to IntoTheBlock analysts, the last time a similar situation was observed after the March market crash. At the same time, one of them added that the share of unprofitable addresses usually exceeds 50% at the moment when the market is at the bottom. Thus, he hinted that a more significant fall in the cryptocurrency should not be expected. However, statistics show the opposite: the share of addresses that suffered losses reached 55% in December 2018, and this figure exceeded 62% during the dominance of the bearish trend in 2015.
● Arthur Hayes, former CEO of BitMEX, has increased the negative outlook for bitcoin to $10,000. American economist Benjamin Cowen does not rule out another decline in quotations either. He has recently published a comparison chart of the current bear market with the previous three, which shows that bitcoin is at a very interesting point today. On the one hand, 379 days have passed since ATH (the all-time high). In the previous two bearish markets, this period was 363 days in 2018 and 410 days in 2015. On the other hand, the current ROI (return on investment) is 0.247. In previous times, it has always fallen below the value of 0.2, which indicates a possible further fall of the market.
● Another chart was published by a well-known cryptanalyst named Dave the Wave. According to his charts, bitcoin is now right at the lower end of the long-term LGC, which has historically acted as support. BTC's history has already seen price actions below this curve: for example, in the 2015 bear market or during the crash at the start of the COVID-19 pandemic in March 2020. However, such a fall did not last long then, and the cryptocurrency quickly restored its long-term support. This usually signaled the end of the bear market and the start of a new bull market.
Dave the Wave noted in a comment on his chart that special attention should be paid to the end of the month. According to him, there is technically nothing catastrophic in the price action yet, but the lower border of the model is hardly holding. If bitcoin closes the month below $16,000, LGC support is highly likely to collapse, and the fall will continue. And vice versa: if it manages to hold on and bounce up, this may be a signal for the beginning of a new bull market.
● In the meantime, at the time of writing this review (Friday evening, November 25), BTC/USD is trading in the $16,520 zone. The total capitalization of the crypto market is $0.833 trillion ($0.832 trillion a week ago). The Crypto Fear & Greed Index fell from 23 to 20 points in seven days and could not get out of the Extreme Fear zone.
NordFX Analytical Group
Notice: These materials are not investment recommendations or guidelines for working in financial markets and are intended for informational purposes only. Trading in financial markets is risky and can result in a complete loss of deposited funds.
#eurusd #gbpusd #usdjpy #Forex #forex_forecast #signals_forex #cryptocurrency #bitcoin #nordfx


