
The Top Five Chart Patterns in Forex Trading: How to Spot Them and What to Expect
There are many different chart patterns that can occur in the Forex market.
The custom Indicator below is developed for helping traders identify these patterns while trading, on automatic mode
Trendlines Chart Patterns Indicator
https://www.mql5.com/en/market/product/47773
By being aware of the five most common patterns, you can improve your chances of success in trading.
The patterns are:
Head and shoulders, double top/bottom, ascending/descending triangle, bullish/bearish engulfing, and marubozu.
In this article, we will look at the characteristics of each pattern and what to expect when they form.
1. The head and shoulders pattern
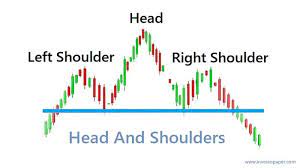
The head and shoulders pattern is a common chart pattern that traders use to identify potential reversals in the market. The pattern is formed when the price of a security moves higher and then moves lower but fails to move above the high from the first move. This creates a peak and trough pattern, with the peak being the head and the trough being the shoulders.
The head and shoulders pattern can be used to identify a number of different trading opportunities, including reversals, breakouts, and pullbacks. Traders typically enter into a position once the price breaks above the neckline of the pattern.
The head and shoulders pattern is a popular pattern among traders because it is relatively easy to identify and provides a clear trading opportunity.
2. The double top/bottom pattern
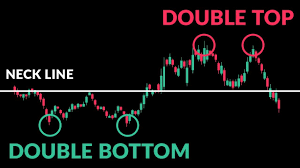
The double top/bottom pattern is a bullish reversal pattern that is formed when a stock makes two consecutive higher highs and two consecutive higher lows.
This pattern is usually confirmed when the stock breaks above the high of the first peak.
3. The ascending/descending triangle pattern
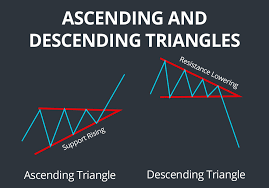
The ascending/descending triangle pattern is a bullish/bearish chart pattern that can be used to identify potential changes in the trend of a security. The pattern is formed when the security's price forms two converging trendlines, with one trendline representing an uptrend and the other trendline representing a downtrend. The price will oscillate between these trendlines until it breaks out in either direction.
The ascending triangle pattern is a bullish pattern that is formed when the security's price forms two converging trendlines, with the trendline representing the security's uptrend. The price will oscillate between these trendlines until it breaks out in the upward direction.
The descending triangle pattern is a bearish pattern that is formed when the security's price forms two converging trendlines, with the trendline representing the security's downtrend. The price will oscillate between these trendlines until it breaks out in the downward direction.
4. The flag/pennant pattern
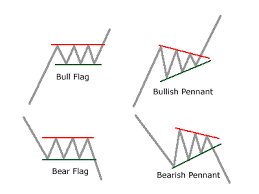
Flag and pennant patterns are among the most commonly used continuation patterns. flags are rectangles that have a long upper trendline and a short lower trendline, while pennants are wedges that have a long upper trendline and a short lower trendline.
Flags and pennants are continuation patterns that usually form during a bullish or bearish trend. They signal a continuation of the previous trend. Flags form after a sharp price movement and pennants form after a consolidation period.
The flag/pennant pattern is a bullish continuation pattern. It is formed after a sharp price movement and signals a continuation of the previous trend. The flag is a rectangle that has a long upper trendline and a short lower trendline. The pennant is a wedge that has a long upper trendline and a short lower trendline.
Flags and pennants are usually traded in the direction of the previous trend. For example, if the flag/pennant is bullish, then the trade would be long. If the flag/pennant is bearish, then the trade would be short.
5. The bullish/bearish engulfing pattern
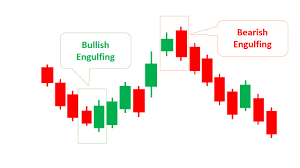
A bullish engulfing pattern is a candlestick chart pattern that signals that the bulls are in control. The pattern is created when a small black candlestick is followed by a large white candlestick that completely engulfs the previous candle. This pattern indicates that the bulls are now in control and that the bears are no longer in control.
A bearish engulfing pattern is a candlestick chart pattern that signals that the bears are in control. The pattern is created when a small white candlestick is followed by a large black candlestick that completely engulfs the previous candle. This pattern indicates that the bears are now in control and that the bulls are no longer in control.


