Technical Chart Pattern Analysis for US Dollar, S&P 500, Gold and Crude Oil - Gold Aims Higher, Crude Oil Stalling Below $57

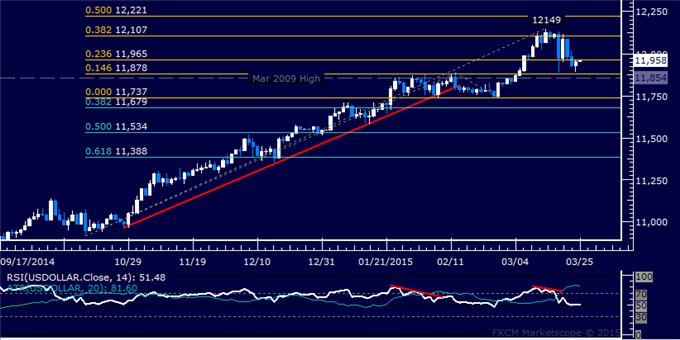
US DOLLAR TECHNICAL ANALYSIS
Prices reversed downward as
expected, making good on bearish cues telegraphed through negative RSI
divergence. Near-term support is in the 11854-78 area (March 2009 high,
14.6% Fibonacci expansion), with a break below that on a daily closing
basis exposing the 11679-737 region (February 26 low, 38.2% Fib
retracement).
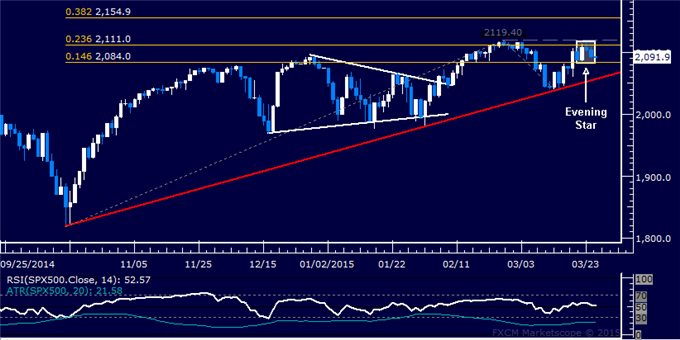
S&P 500 TECHNICAL ANALYSIS
Prices put in a bearish Evening
Star candlestick pattern below February’s swing high, hinting a move
lower is ahead. A daily close belowthe 14.6% Fibonacci expansion at
2084.00 exposes rising trend line support at 2057.10.
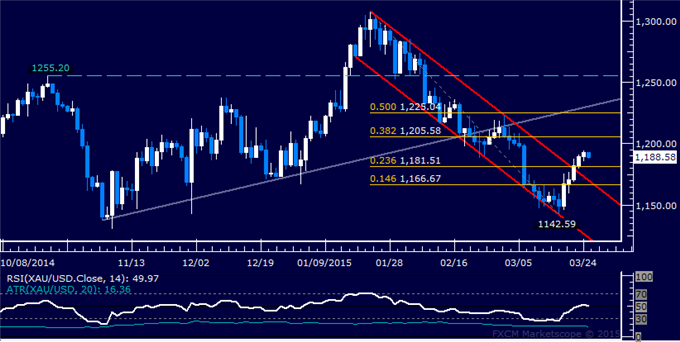
GOLD TECHNICAL ANALYSIS
Prices look poised for another move
above the $1200/oz figure. A break above the 38.2% Fibonacci retracement
at 1205.58 exposes the 50% level at 1225.04. Alternatively, a turn
below the 23.6% Fib at 1181.51 targets the 1166.67-1170.09 area (channel
top resistance-turned-support, 14.6% retracement).
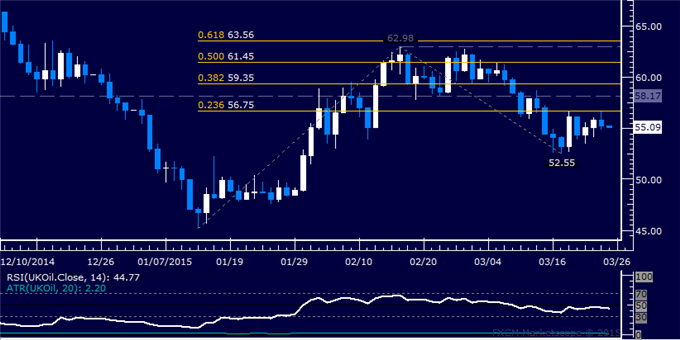
CRUDE OIL TECHNICAL ANALYSIS
Prices continue to stall below the
$57.00/barrel figure. A daily close above the 23.6% Fibonacci expansion
at 56.75 exposes support-turned-resistance at 58.17. Near-term support
is at 52.55, the March 17 low.