TPTSyncX V4 SERIES – 14 Essential Parameters for MetaTrader 5
TPTSyncX V4 SERIES – 14 Essential Parameters for MetaTrader 5
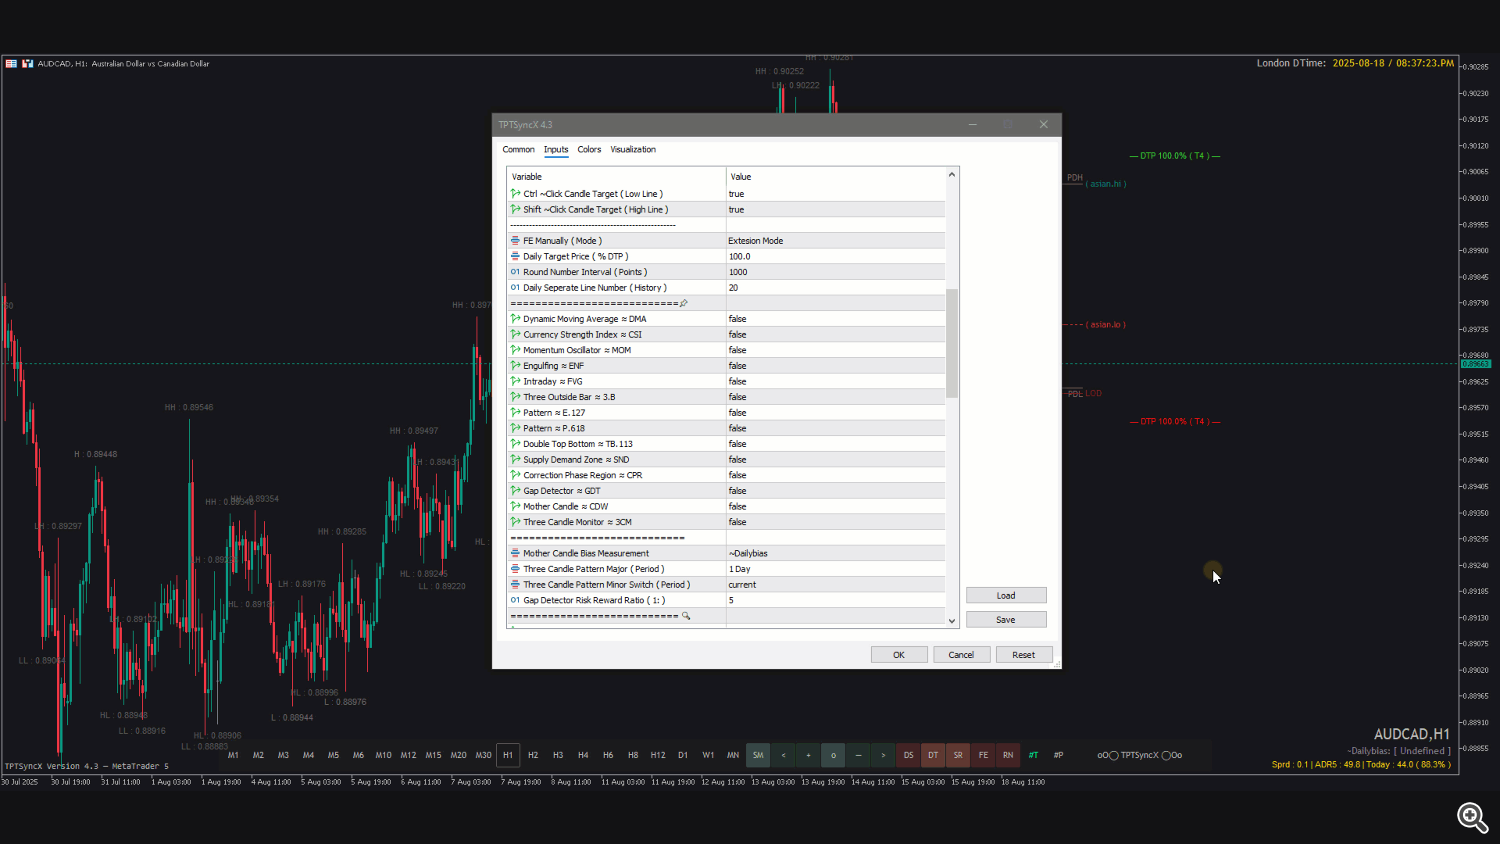
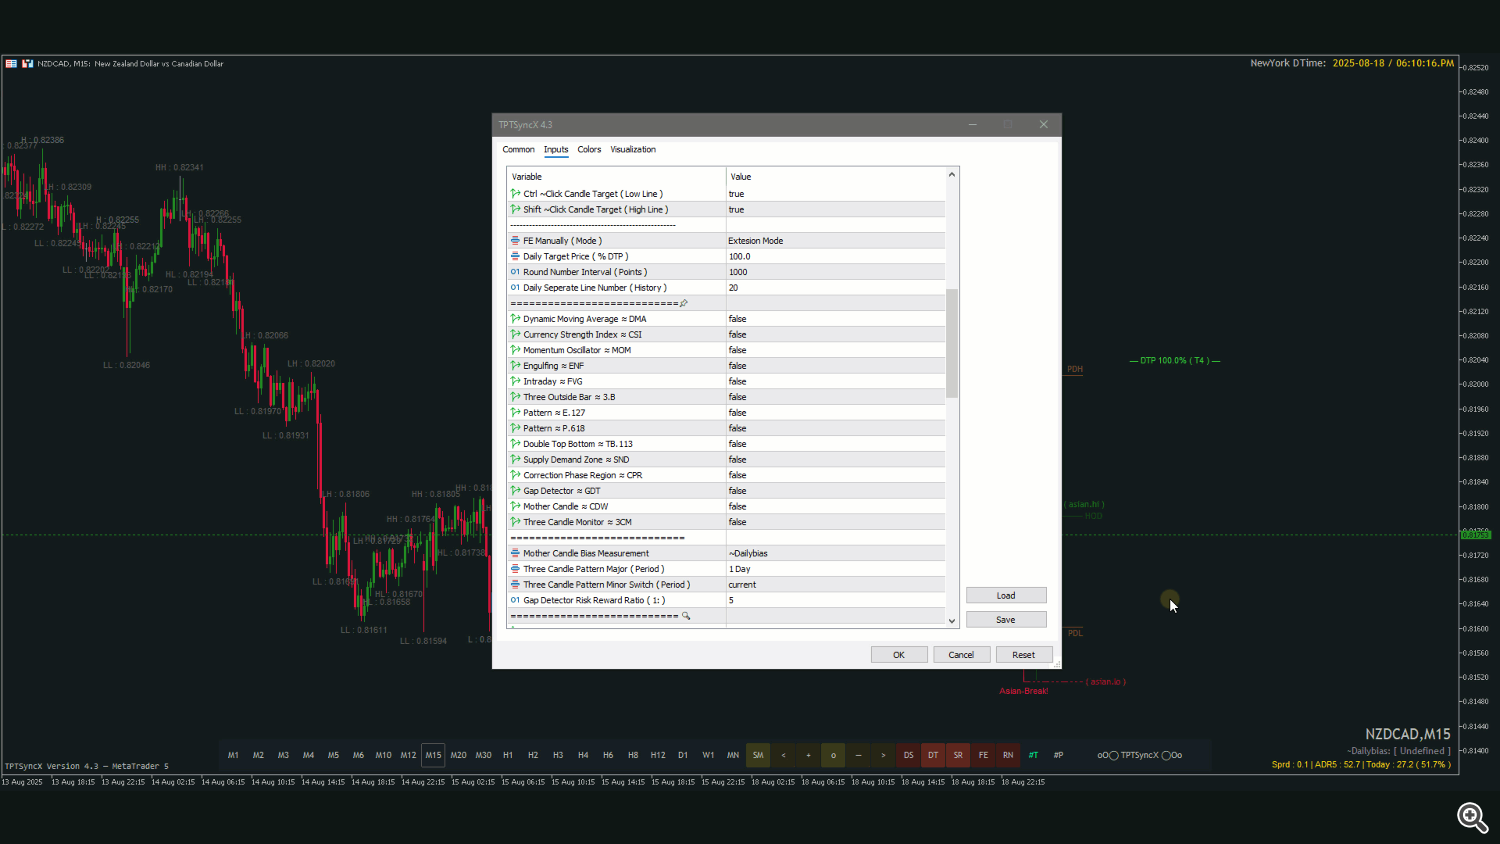
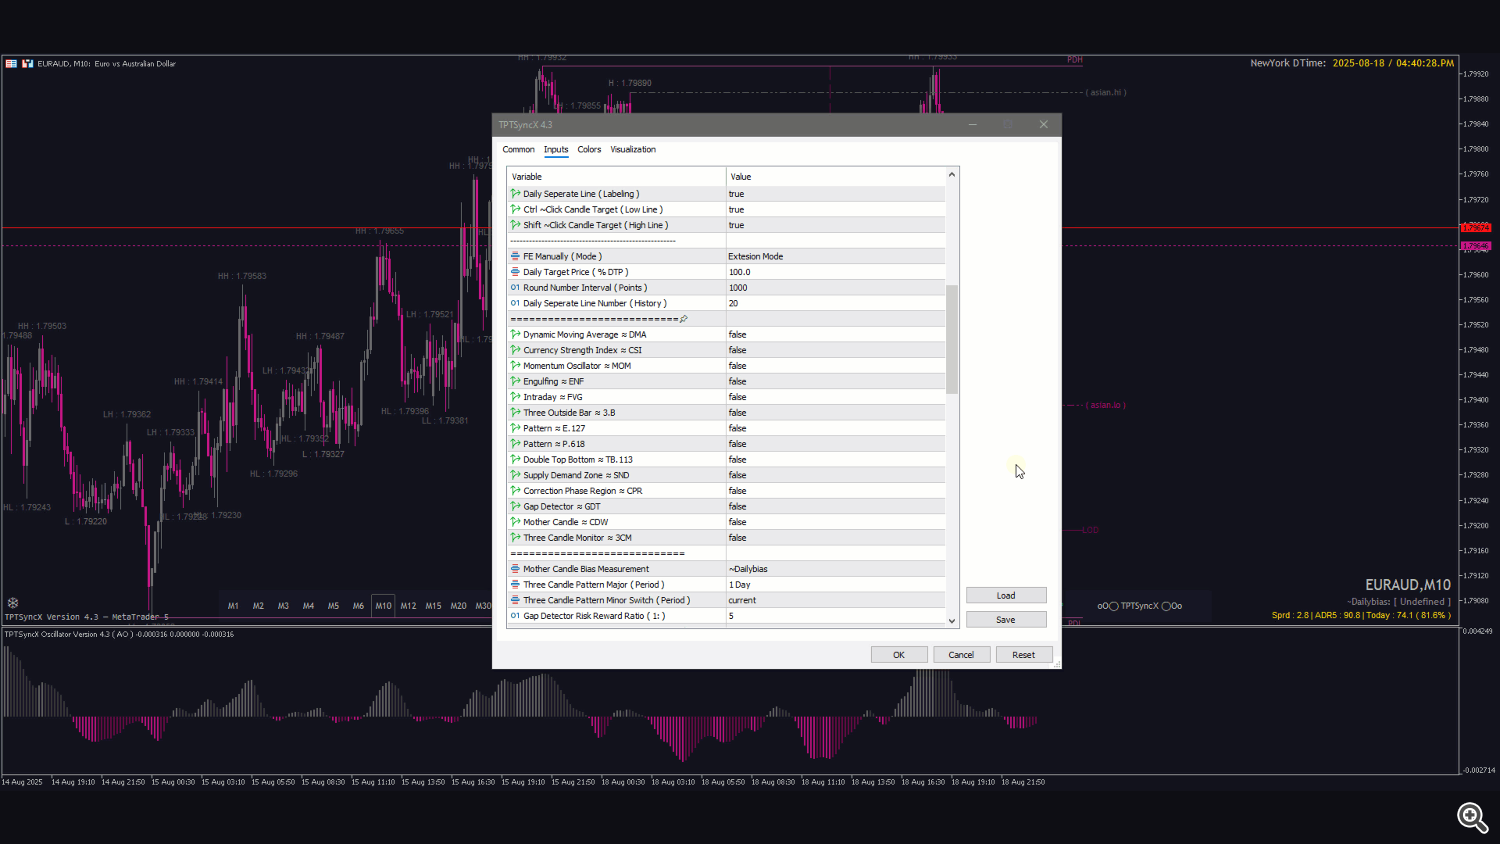
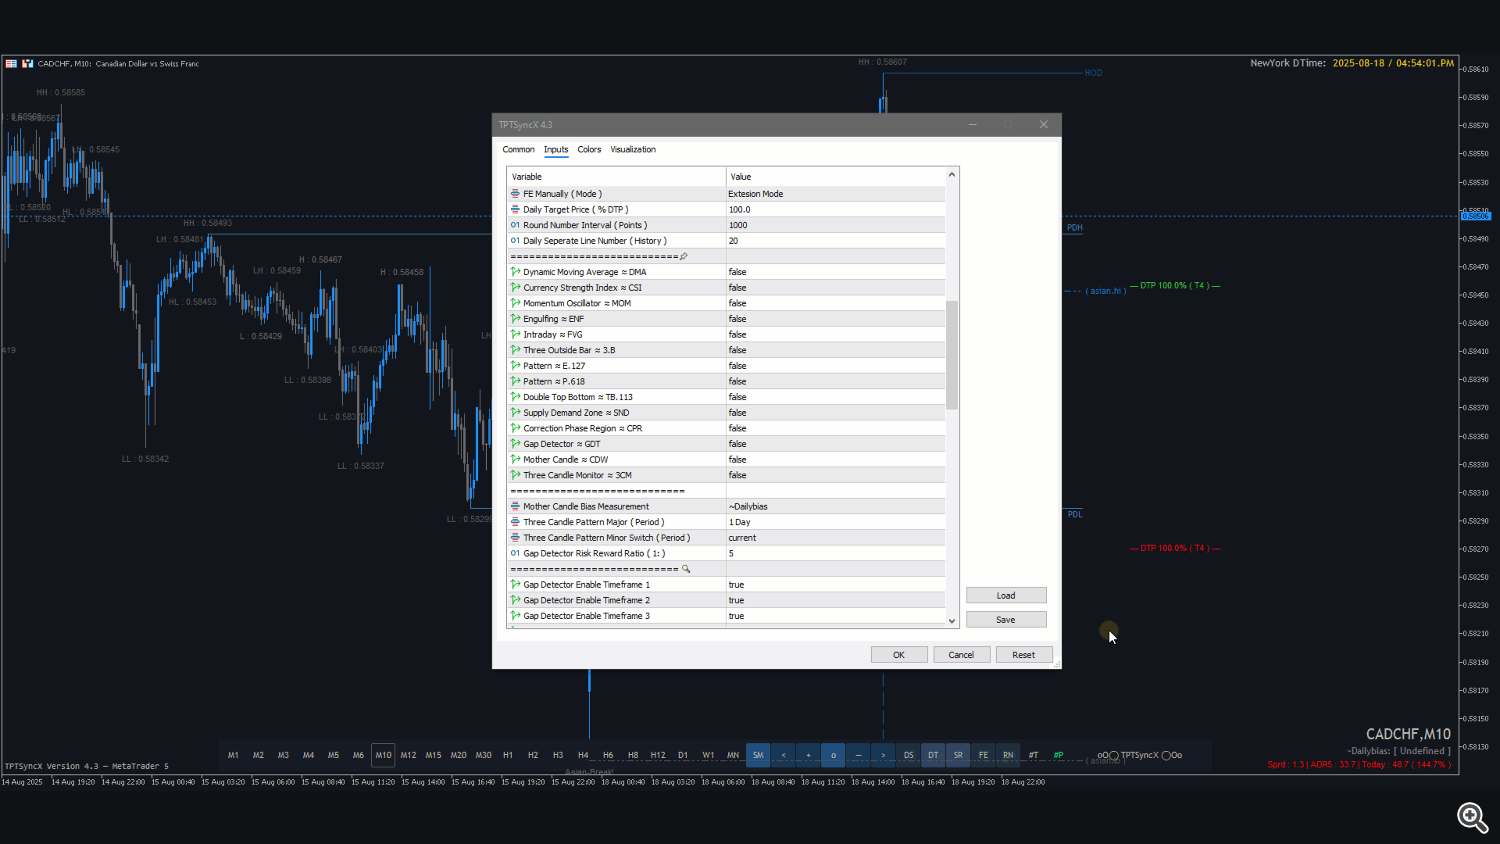
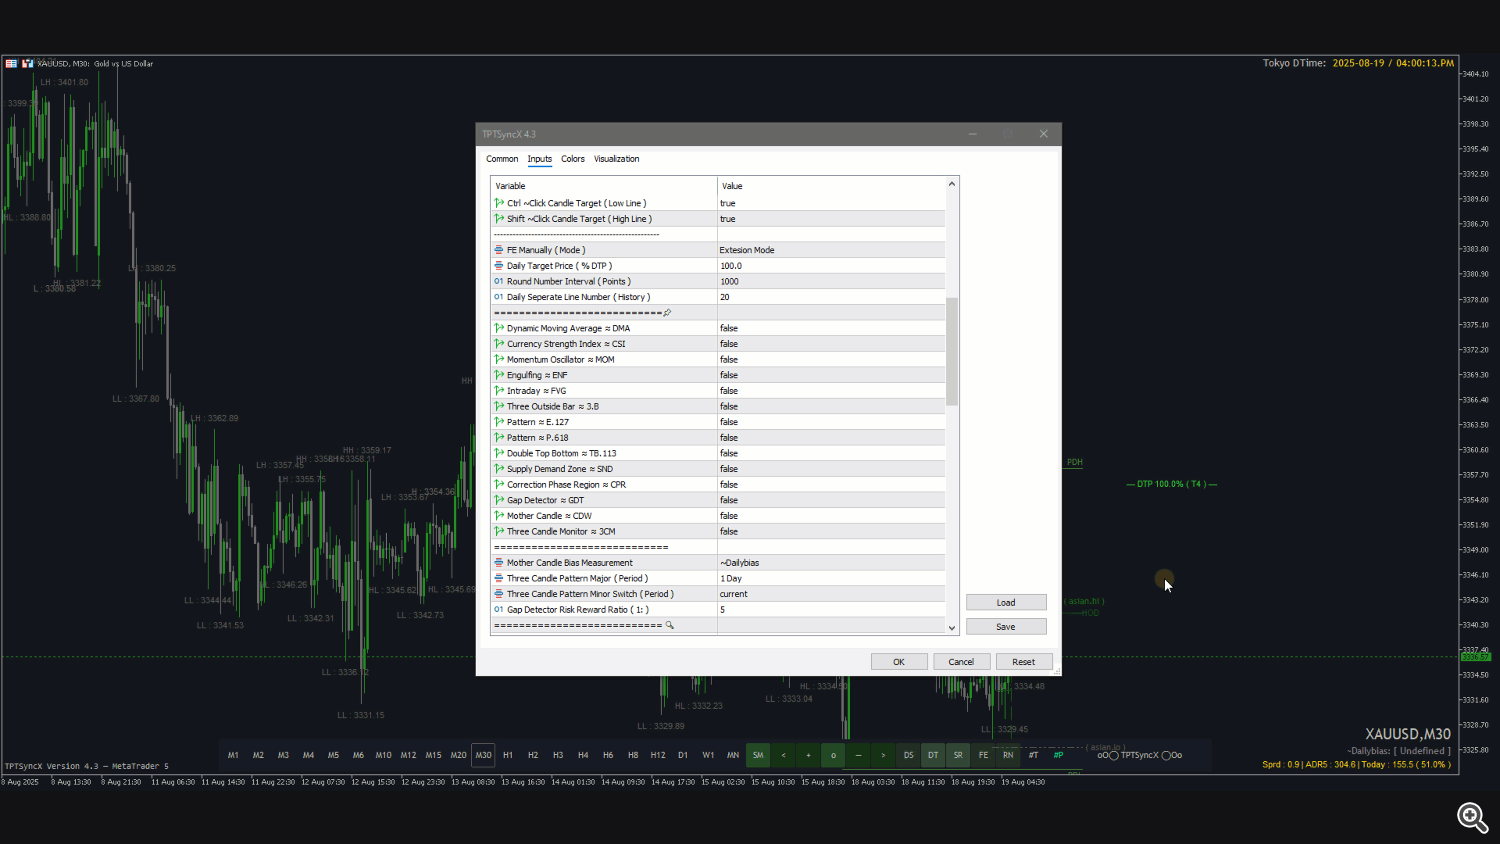
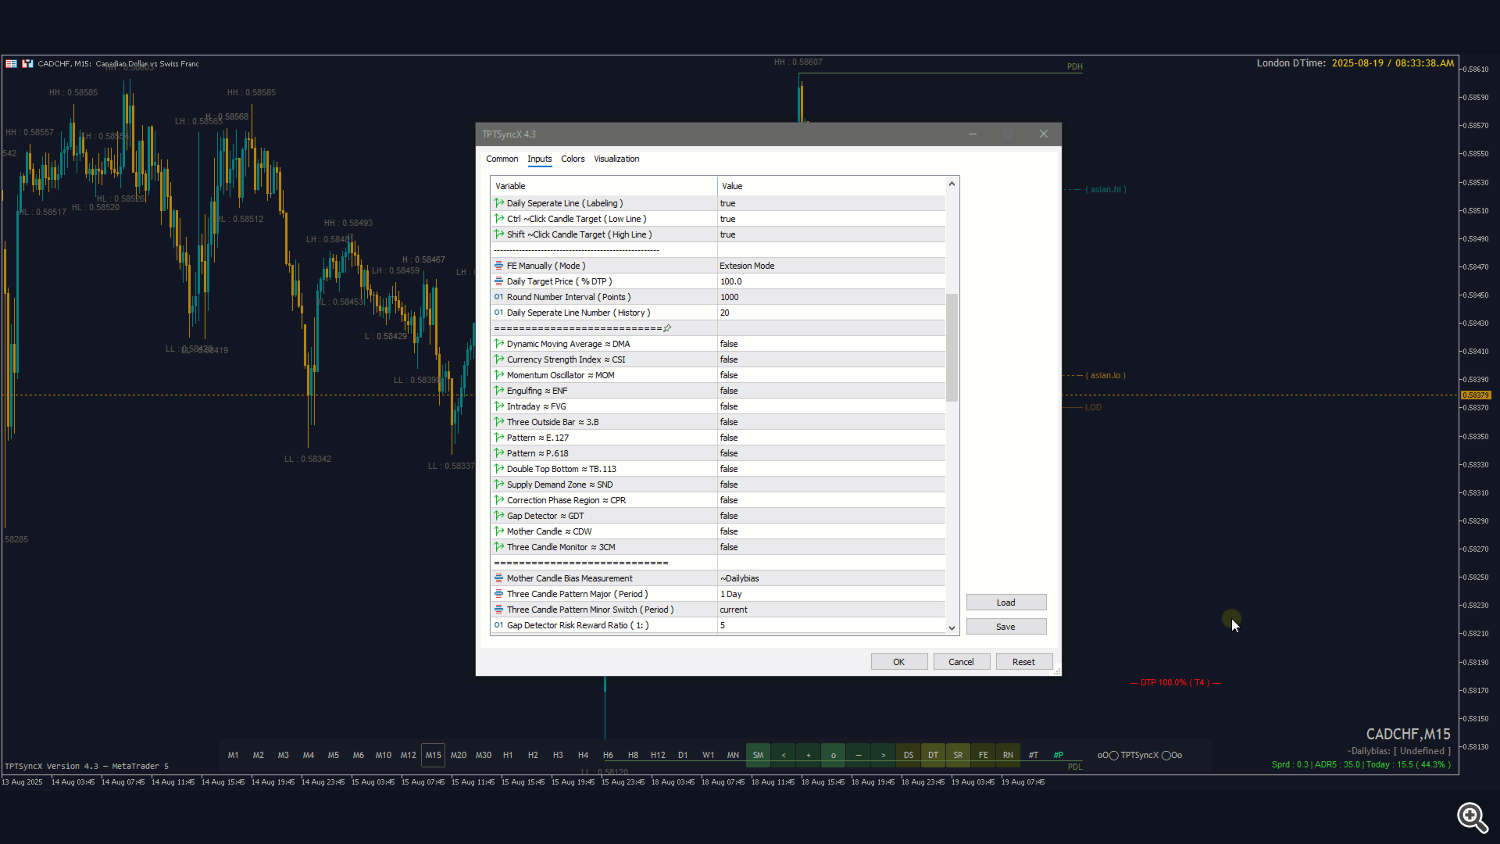
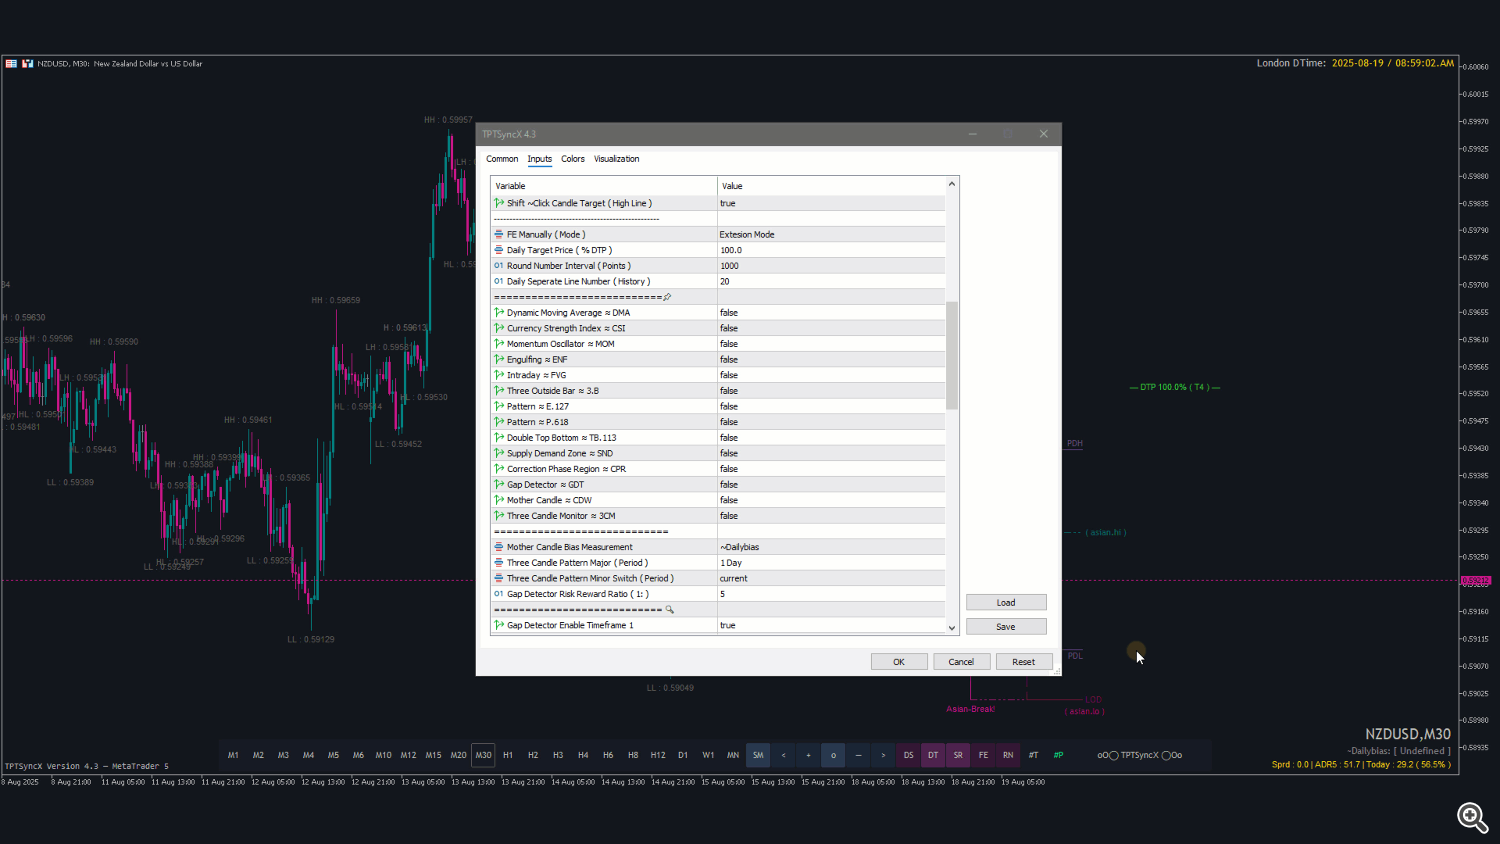
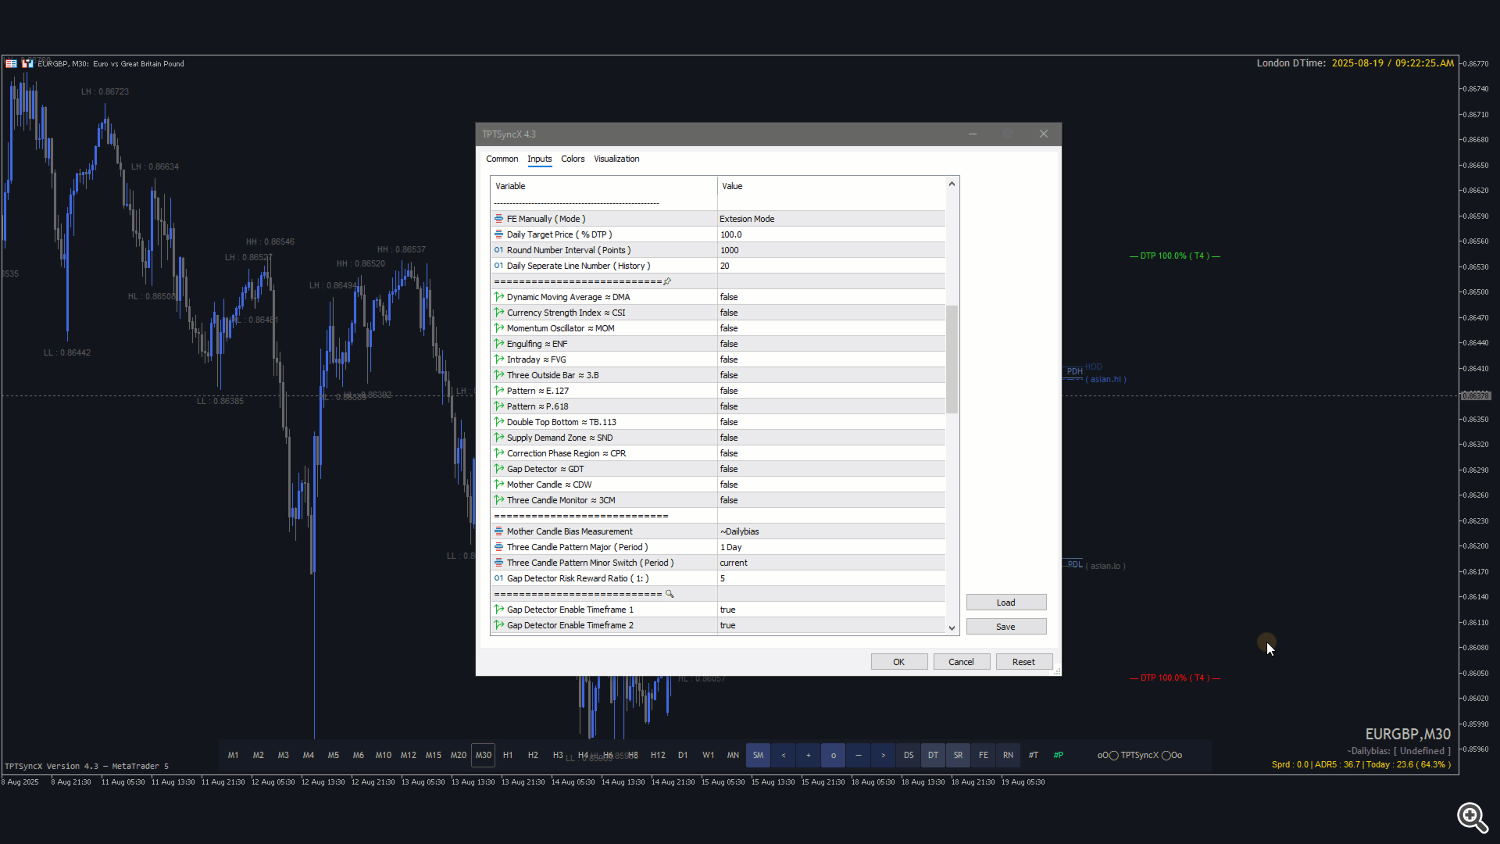
📚 Manual Guide ( Click the images to preview chart movement )
This blog will guide you through these 14 essential parameters, explaining their purpose, how they interact with market behavior, and how you can integrate them into your trading strategy. Whether you are refining entries, filtering noise, or building a disciplined trading system, the TPTSyncX V4 SERIES provides the structured edge you’ve been looking for.
1.Dynamic Period Moving Average ≈ DMA
A flexible moving average that automatically adapts to market volatility and trend conditions. Unlike traditional moving averages with fixed periods, the DMA dynamically adjusts its smoothing factor based on price movement, allowing it to respond faster during strong trends while filtering out noise in ranging markets. This makes it useful for identifying trend direction, spotting potential reversals, and aligning entries with the dominant market bias.2.Currency Strength Index ≈ CSI
The Currency Strength Index (CSI) is designed to reveal the true balance of power between currencies. Instead of focusing on a single chart, the CSI compares multiple pairs simultaneously, showing which currencies are gaining strength and which are losing momentum.In TPTSyncX V4, the CSI is calculated based on the average of RSI values across selected pairs. This approach combines the reliability of the Relative Strength Index with a broader market perspective. By averaging RSI readings, the CSI smooths out individual price fluctuations and highlights consistent currency performance trends.This makes it easier to spot high-probability opportunities, such as strong-versus-weak currency setups, while avoiding pairs that are equally matched and likely to move sideways. With CSI as part of your toolkit, you can align entries with the dominant market flow and trade with greater confidence.
3.Momentum Oscillator ≈ MOM
The Momentum Oscillator (MOM) in TPTSyncX V4 is built based on the Awesome Oscillator, providing a clear visual of market acceleration and deceleration. By tracking the strength of bullish and bearish momentum, it offers traders an intuitive way to anticipate shifts in price dynamics.When applied with Trading Chaos Theory, this oscillator becomes even more powerful. Its wave-like patterns can be used to measure and validate Elliott Wave structures, helping traders identify where the market currently sits within the broader cycle. This combination allows for precise timing—spotting continuation waves early and detecting potential reversal points before they unfold.With MOM, traders not only see momentum in motion but also gain a structured framework to map market psychology through Elliott Wave.
4.Engulfing ≈ ENF
The Engulfing pattern (ENF) is one of the most reliable candlestick formations for signaling potential market reversals or strong continuation moves. It occurs when a candle’s body completely engulfs the body of the previous candle, reflecting a decisive shift in control between buyers and sellers. the Engulfing detection is fully automated across multiple timeframes, allowing traders to spot these high-probability setups without manually scanning charts. A bullish engulfing suggests renewed buying strength after a down move, while a bearish engulfing indicates fresh selling pressure after an up move.
5.Intraday ≈ FVG
The Intraday Fair Value Gap (FVG) highlights areas of price imbalance created when the market moves too aggressively, leaving untested zones between candles. These gaps often serve as liquidity pools where price is drawn back to restore balance.With automated detection in TPTSyncX V4, traders can instantly identify intraday imbalances and use them as precise reference points for retracements, continuation entries, or potential reversals. This provides a strategic advantage in timing trades around zones where institutional activity is most likely concentrated.
6.Three Outside Bar ≈ 3.B
A three-candle reversal pattern detetion in multi-timeframes that confirms a decisive shift in market momentum. It forms when the second candle fully strong reaction, and the third closes further in the same direction, validating the change. This structure strengthens reversal signals and provides traders with higher confidence for timing entries after a trend shift.
7.Pattern ≈ E.127
A projection pattern built around the 127% extension level, commonly applied through the AB=CD 1.27 projection. In this setup, the CD leg extends 1.27 times the AB leg, creating a precise reference point for anticipating price reactions. In TPTSyncX V4, this pattern can be detected across multiple timeframes and currency pairs simultaneously, making it easier to align intraday signals with higher-timeframe bias. By projecting price behavior beyond the prior swing, traders can identify whether the market is approaching an exhaustion zone or preparing for a strong continuation. This combination of projection accuracy, multi-timeframe context, and cross-currency analysis provides a sharper edge in recognizing high-probability continuation opportunities.
8.Pattern ≈ P.618
A projection pattern centered on the 61.8% retracement–projection level, often regarded as the golden ratio for reversals. When price reaches this zone, it frequently signals exhaustion of the current move and the potential start of an opposite leg. In TPTSyncX V4, the P.618 is tracked across multiple timeframes and currency pairs, allowing traders to detect alignment between short-term pullbacks and higher-timeframe reversal zones. This makes it a powerful filter for identifying turning points, refining entries by focusing on the most critical Fibonacci projection level.
9.Double Top Bottom ≈ TB.113
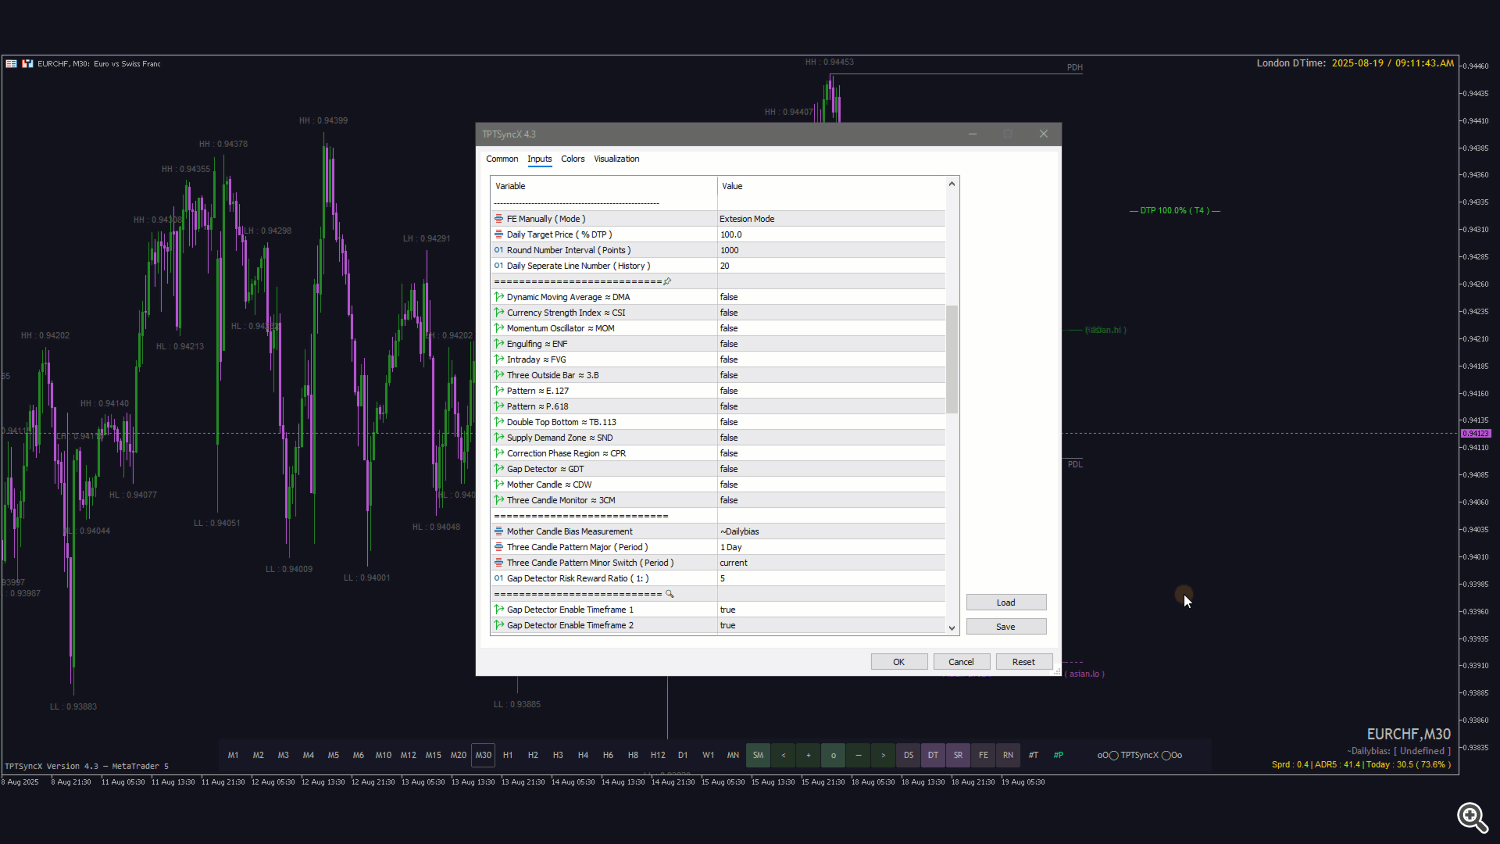
A classic reversal formation where price fails to break beyond the same resistance or support level twice. The Double Top indicates selling pressure at a repeated high, while the Double Bottom reflects buying strength at a repeated low. TB.113 automatically tracks these setups across multiple timeframes, currency pairs, and with special focus on intraday price action, allowing traders to catch early signs of exhaustion within the trading day. This makes it an effective tool for spotting intraday turning points, tightening risk control, and aligning short-term reversals with broader market context.
10.Supply Demand Zone ≈ SND
An automatic zone detector that maps supply and demand on the current chart using liquidity cues—rapid displacement, unfilled impulse moves, wick absorption, and clustered order-flow footprints—to reveal where large resting orders likely sit. By reading these liquidity signatures in real time, SND highlights high-probability reaction areas for precise entries, protective stops just beyond the zone, and measured targets as price rebalances into available liquidity.
11.Correction Phase Region ≈ CPR
A structural mapping that identifies the market’s corrective phases within a trend. Instead of chasing every swing, CPR highlights zones where price is temporarily consolidating, retracing, or absorbing liquidity before the next expansion. this detection is automated on the current chart with multi-timeframe and multi-paris awareness, allowing traders to distinguish between healthy pullbacks and potential reversals. By focusing on correction phases, traders can better time entries in line with trend continuation or prepare for shifts when corrective structures fail.
12.Gap Detector ≈ GDT
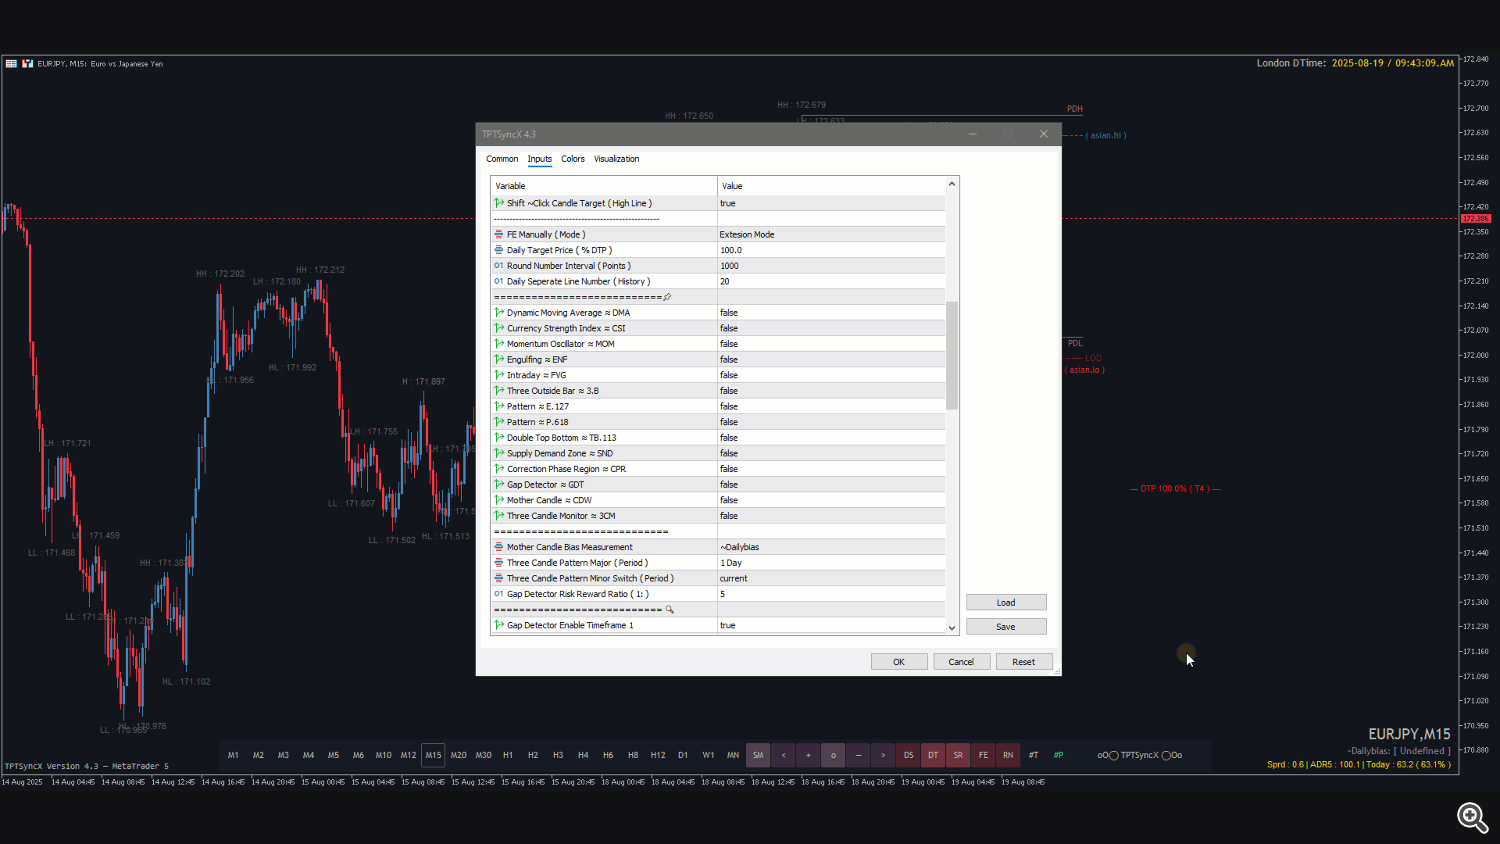
A specialized tool that scans for price gaps in the current time, across multiple pairs and multiple timeframes simultaneously. It automatically highlights imbalance zones where liquidity was skipped, giving traders clear references for potential retracements or continuations. GDT is also presented in the form of a dashboard on the current chart, allowing instant monitoring and comparison without switching symbols or timeframes, making it highly efficient for both intraday and swing strategies.
13.Mother Candle ≈ CDW
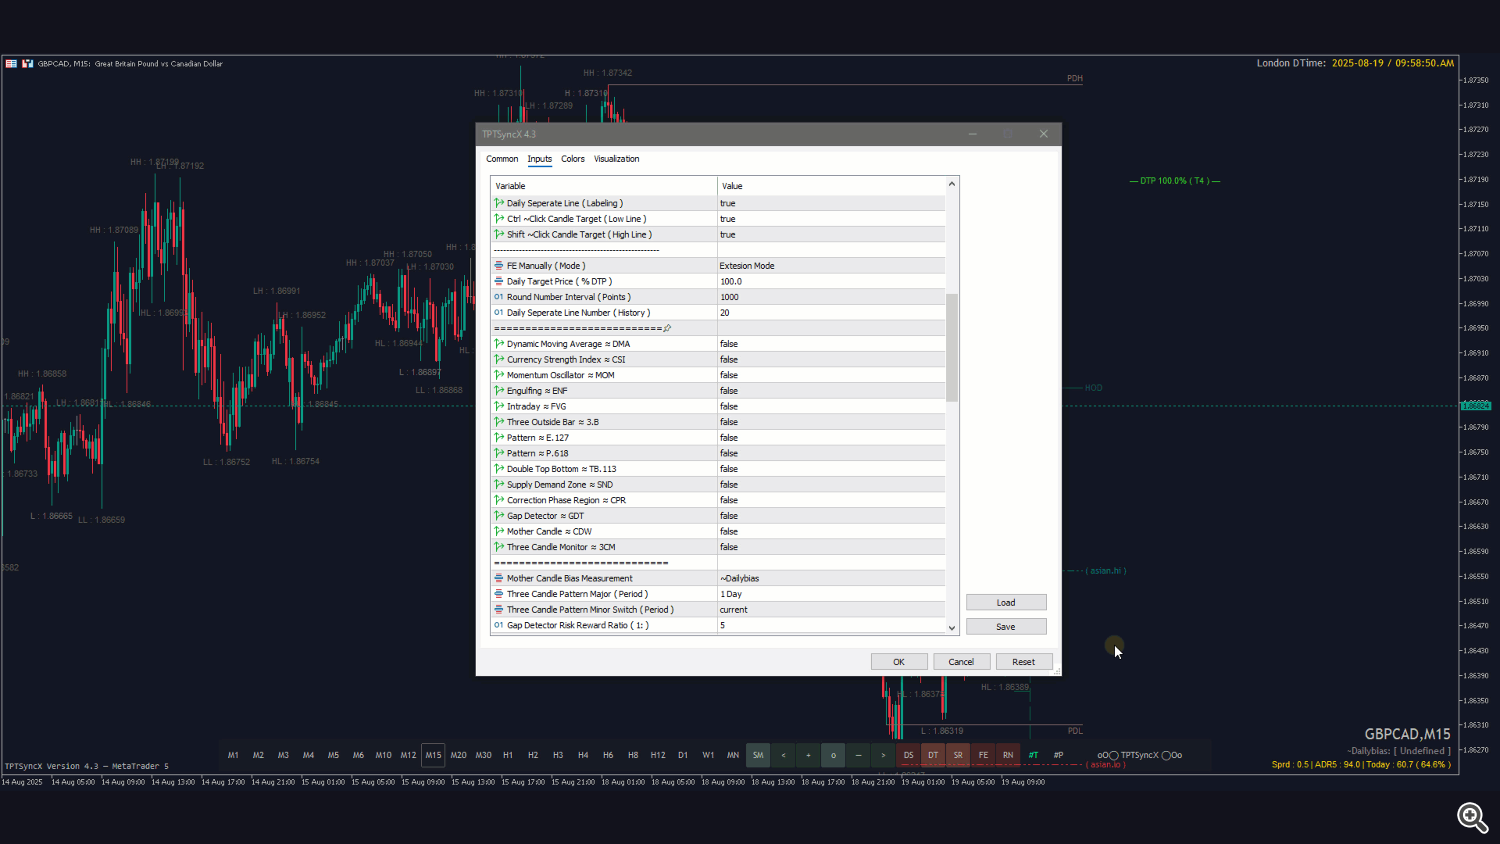
A candlestick-based reference that focuses on a single current candle in the daily and weekly timeframe. The Mother Candle defines the dominant high–low range that contains subsequent price action, acting as a boundary for breakout or continuation setups. By tracking this candle in real time, traders gain a clear map of the market’s immediate structure, using its range as a guide for intraday positioning, breakout confirmation, and higher-timeframe bias alignment.
14.Three Candle Monitor ≈ 3CM
A formation tracker that monitors sequences of three candles on both minor and major timeframes, with the flexibility to switch views instantly. This feature allows traders to study short-term momentum shifts while aligning them with broader structural moves, making it easier to validate setups, confirm bias, and synchronize entries across different trading horizons.
Additional Supporting Functions
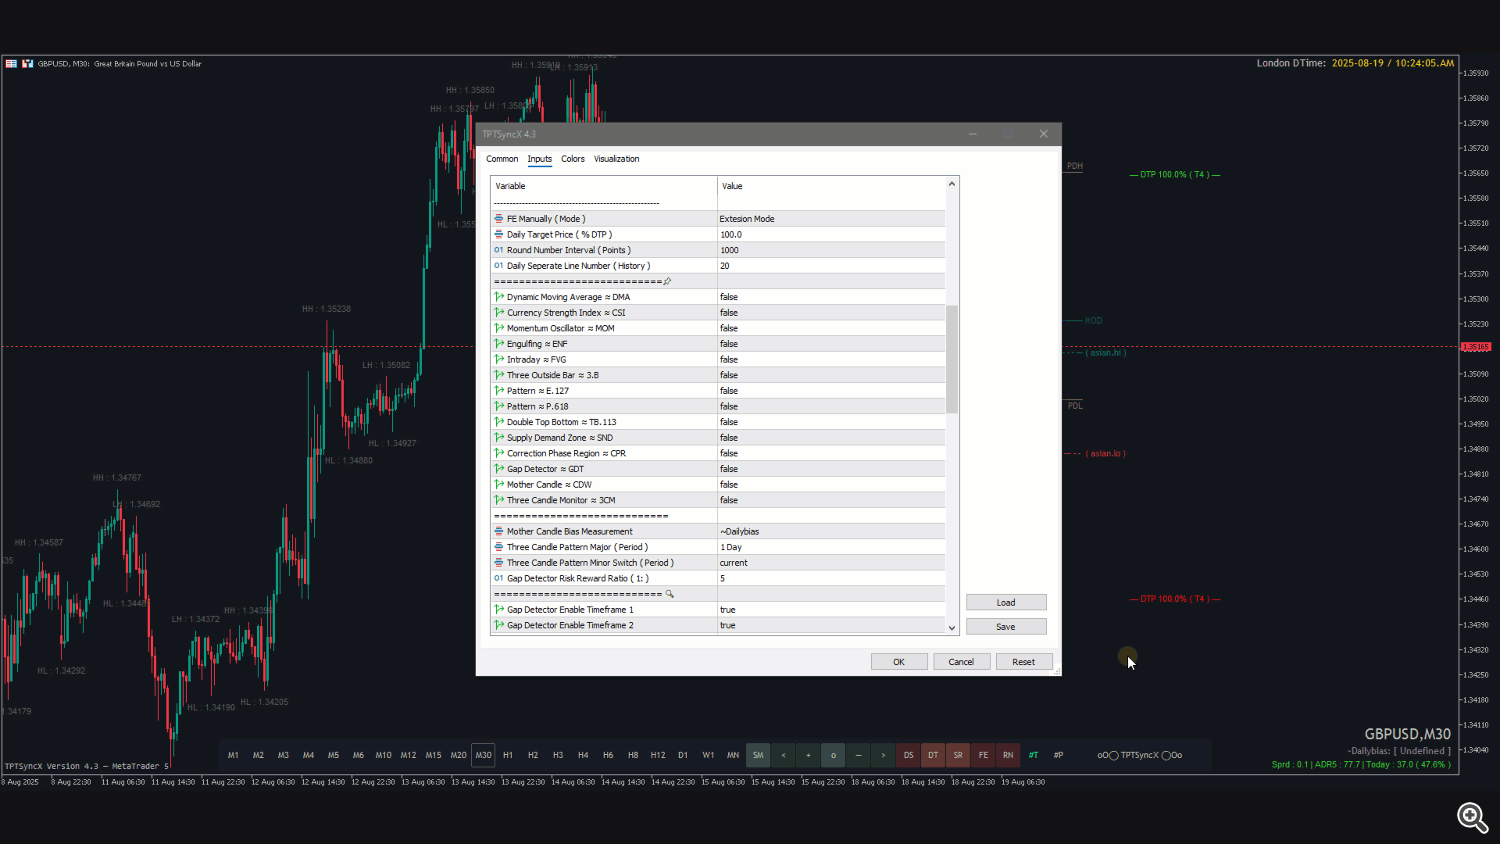
A collection of practical enhancements designed to simplify and streamline the trading process. Core features include daily reference lines for clarity, manual Fibonacci extension tools for projection, round number markers to spot psychological price levels, daily target price indicators for measured objectives, and time session guides to track market openings and overlaps. These supporting functions provide traders with a cleaner workflow, reducing chart clutter while enhancing decision-making. And with many more utilities integrated, they collectively serve as a comprehensive toolkit to support consistency, precision, and efficiency in everyday trading.
🛠️ Troubleshooting Guide ⚙️
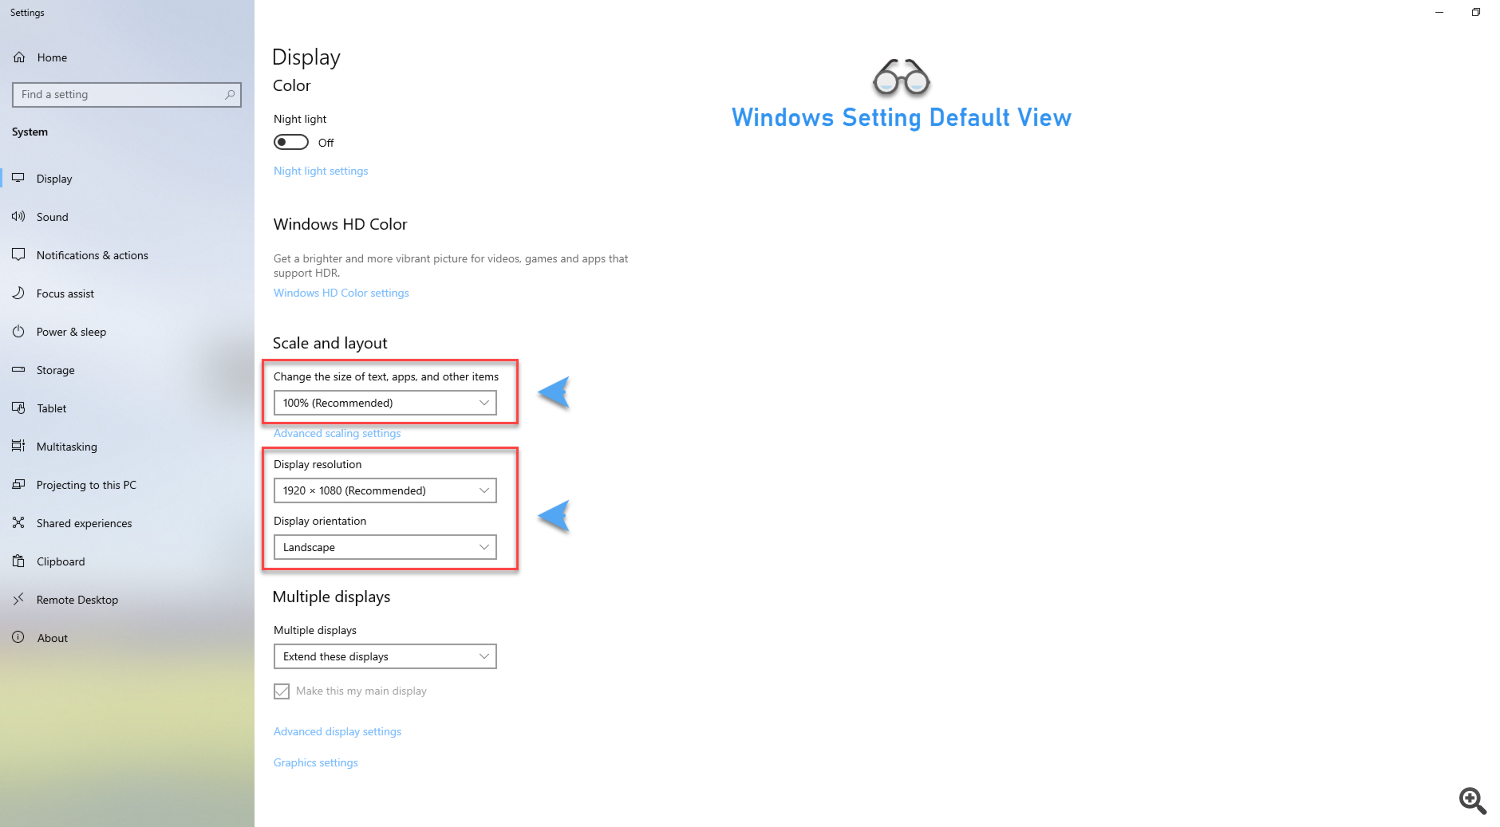
- Display Settings
To ensure the chart appears proportional to the reference image, the default setting window must be configured at HD 1920×1080 resolution with text scaling set to 100%.
- Performance During Initial Load
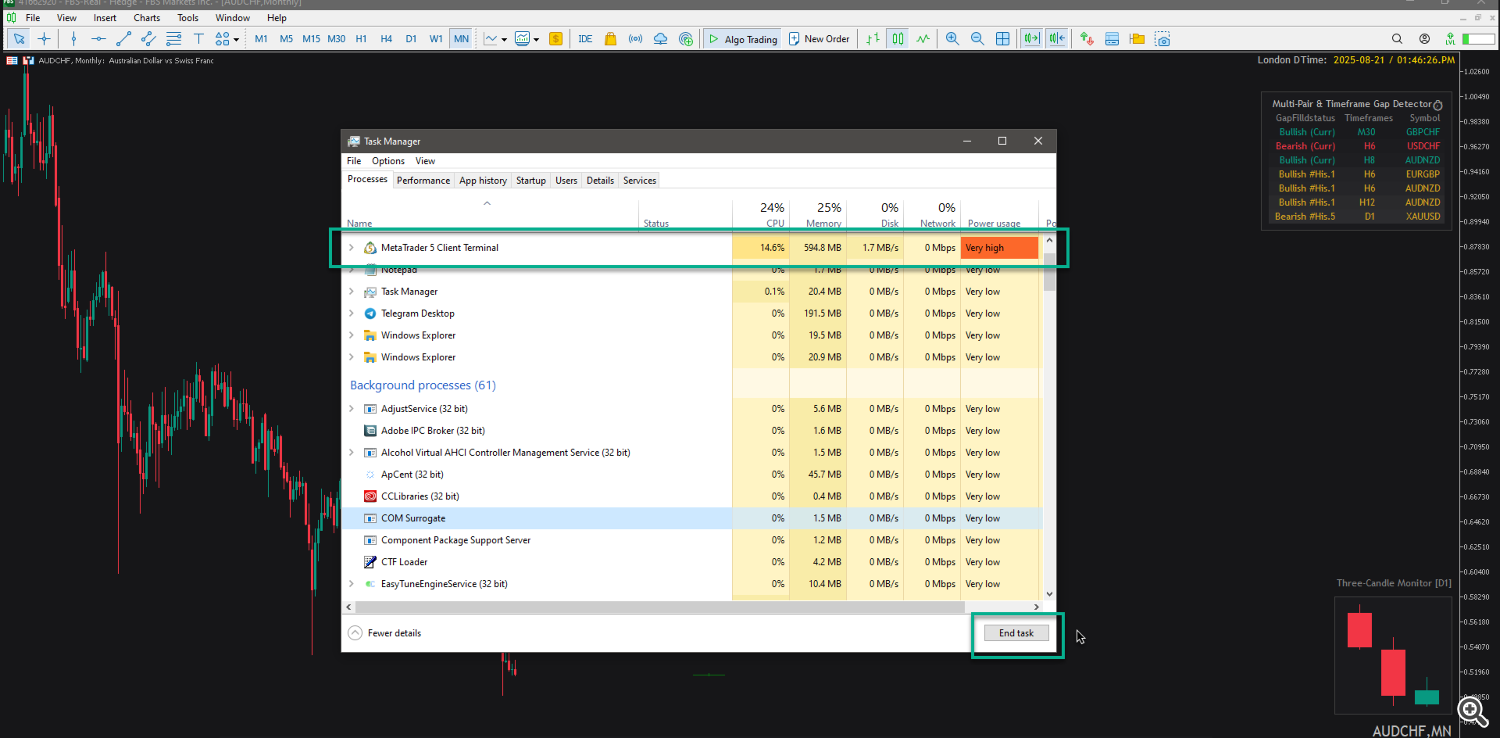
A newly installed MetaTrader 5 terminal may exhibit lag or become temporarily unresponsive. This is a result of downloading and indexing history bars necessary for calculation. Users should allow the synchronization to finish. If the terminal freezes, Open Task Manager use Ctrl + Alt + Del to end the process and restart. System performance will stabilize once data loading is complete, normally within three days.
- Object Tooltip Navigation
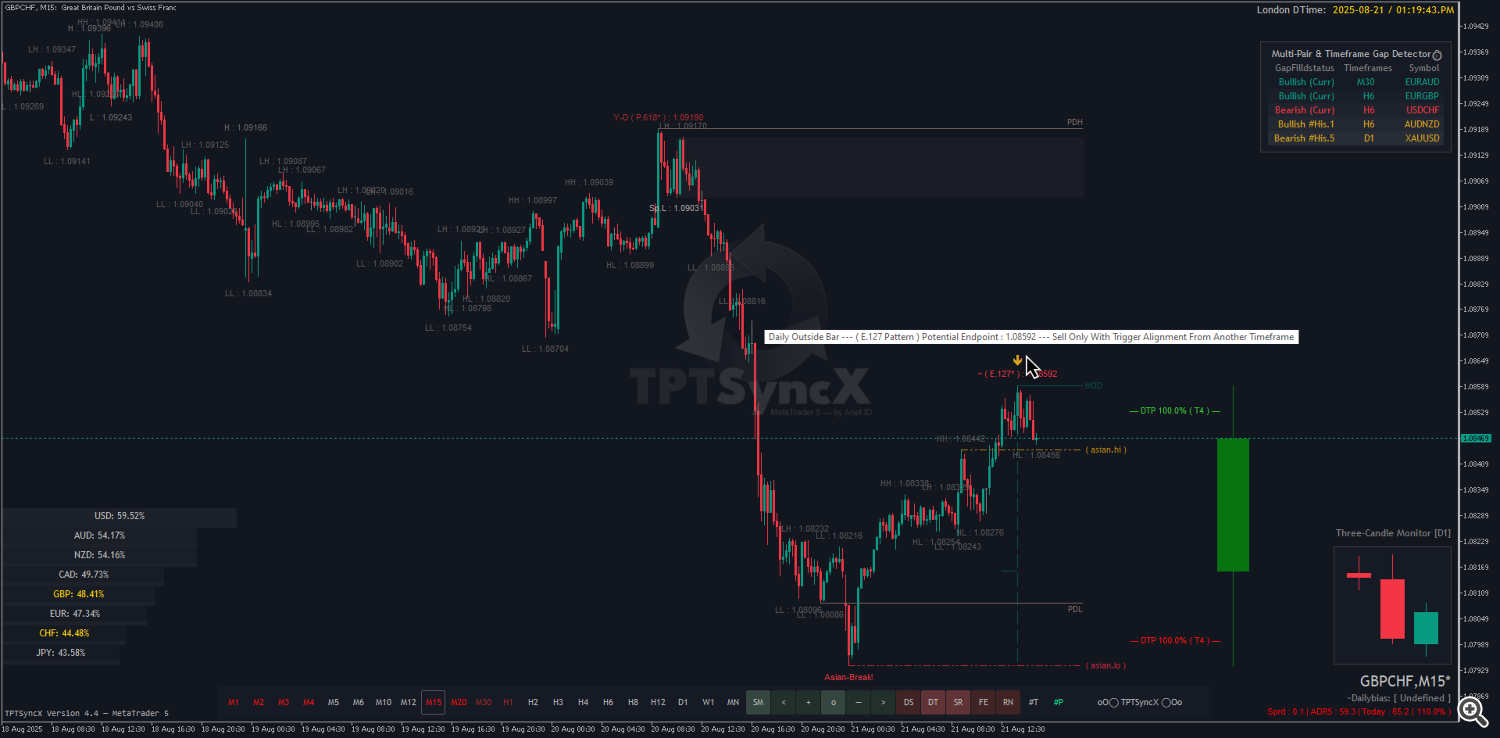
Provides navigation information for each object when the mouse pointer hovers over it.
⚡ Get it now — TPTSyncX for MetaTrader 5, available exclusively on the official website, Click the Image below to view the product ▼
🎁 FREE AUX MT5 Indicator & EA Bundle — Requires TPTSyncX
Enhance your MetaTrader 5 trading setup with this exclusive FREE download of advanced auxiliary tools — designed to complement and extend the capabilities of the TPTSyncX indicator.
⚠️ Note: This bundle requires the TPTSyncX indicator as the primary tool. AUX tools are designed to work alongside it for full functionality
What’s Included in the AUX Package:
🔹 AUX Oscillator Indicator for Elliott Wave Counting ( FREE )
An intelligent oscillator that supports Elliott Wave analysis (Based on Trading Chaos Theory), helping you visually identify wave structures and potential reversal zones with ease. just double click target on the indicator window and the zone will appear.
🔹 EA Trade Manager for Risk Management ( FREE )
Automate your risk control with this smart EA — including dynamic lot size calculation, auto SL/TP placement or manually functionality, all aligned with professional money management principles.
🔹 EA to Close All Positions Based on Target Equity ( FREE )
Set your daily, weekly, or custom equity targets, and let this EA automatically close all positions once your profit goal is reached — helping you secure gains and stick to your trading discipline.
✅ Requires the TPTSyncX indicator (not included in this download)
📥 Download the AUX TPTSyncX files below
