

The bigger picture for Gold remains the same with a deeper correction on the table. However, hesitation to break EMA 20 on the daily chart might be an indication of a temporarily recovery ahead. The temporary bullish scenario is even more likely because shorter term charts indicate the same trend.
Gold Daily Chart - July 18, 2016
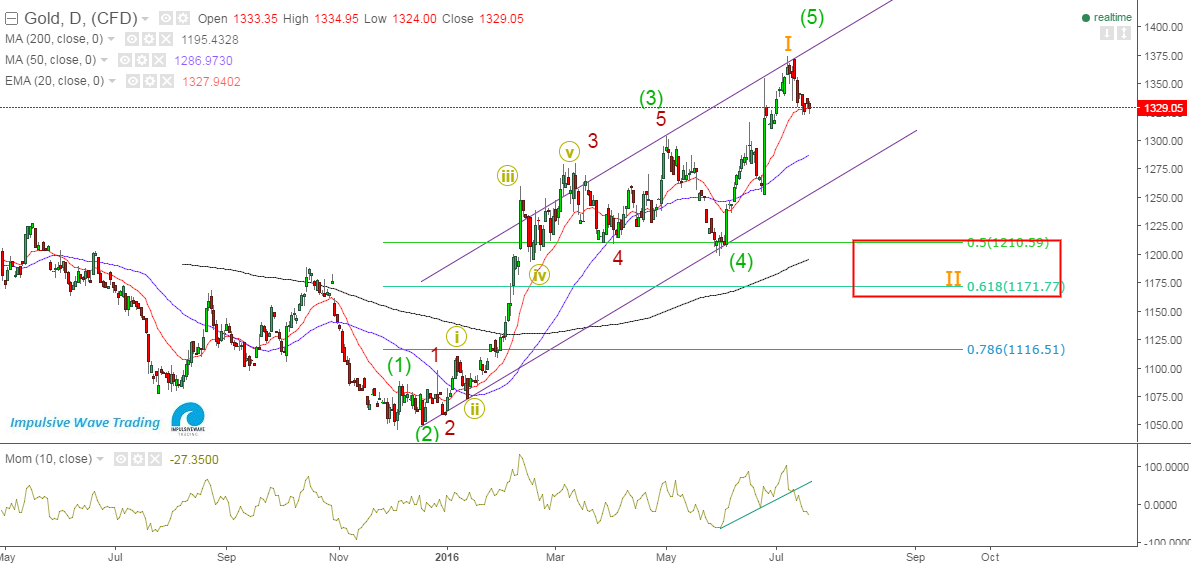
In the latest update, Gold: A Bounce Might Be On The Way, price was testing the lower $1330 area and hit $1320 before going as we stated into reversal mode and testing the upper bound of the yellow channel. It could ...Read More


")
")
")