
Market Update: January 03-06; Futures, Commodities & ETFs!

Author: Favio Poci
In this weekly market update you will see charts, wave counts and Fibonacci targets on the following instruments:
- E-Mini, SPX
- Dow E-Mini (YM), IWM (Russell ETF)
- Gold, GLD & GDX
- Crude Oil
- T-Bond Futures (ZB)
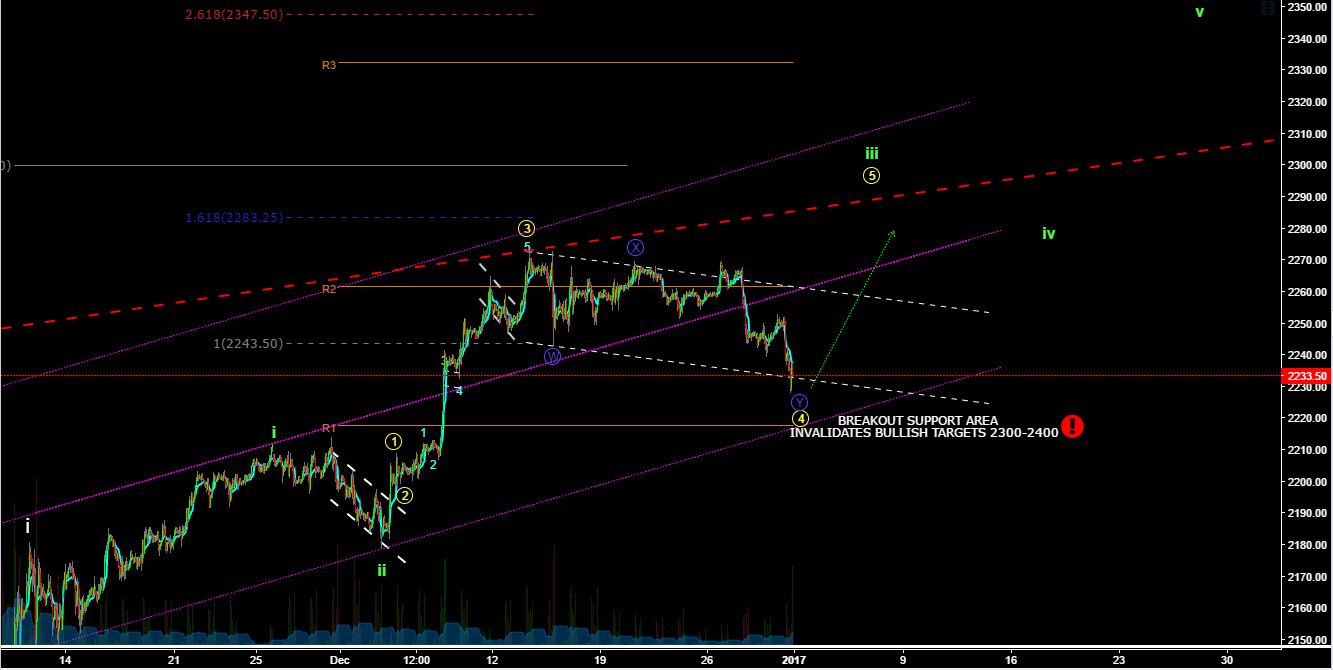
E-Mini traded on a corrective wave during the last week of 2016 and it is at our lower target area for a wave 4. We expect market to start rallying towards new highs in the first days of 2017. Our KEY level for the invalidation of the bullish scenario is 2213 but any move below 2220 can damage the medium-term bullish view.
E-Mini 60Min Chart - January 2, 2017
Primary Count
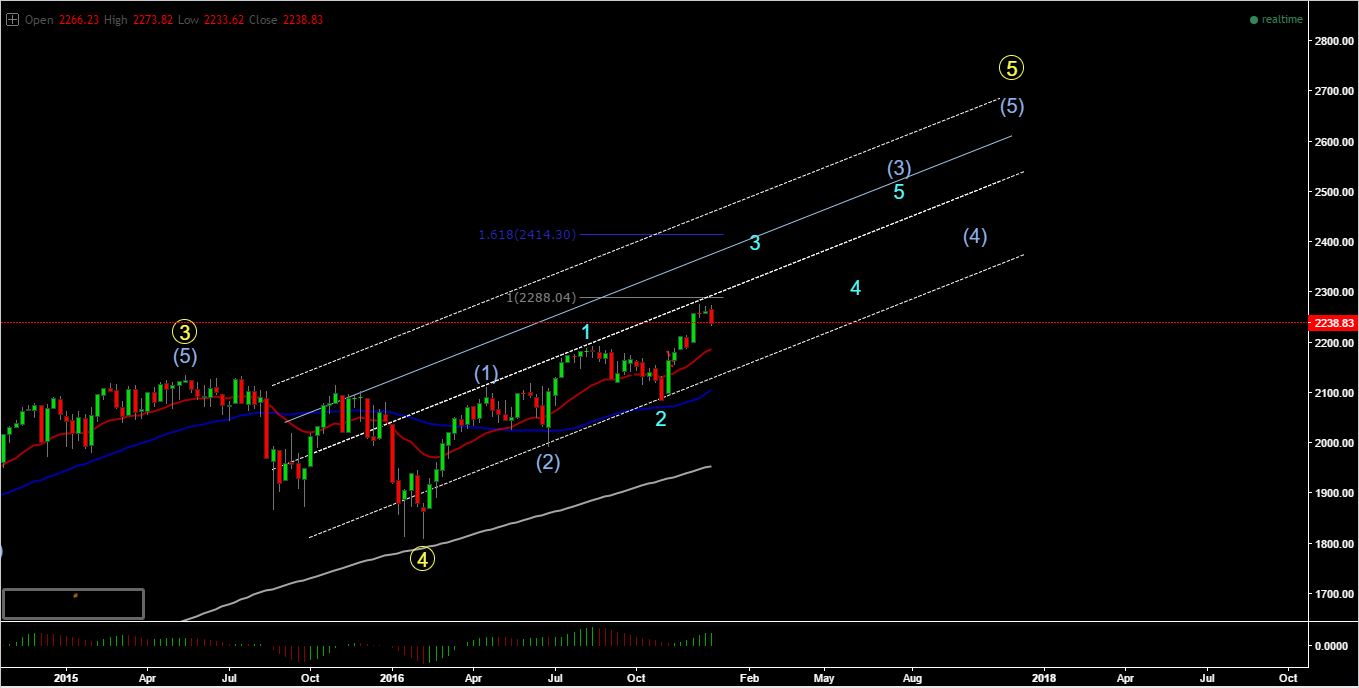
SPX Weekly Chart - January 2, 2017
YM 1H Chart - January 2, 2017
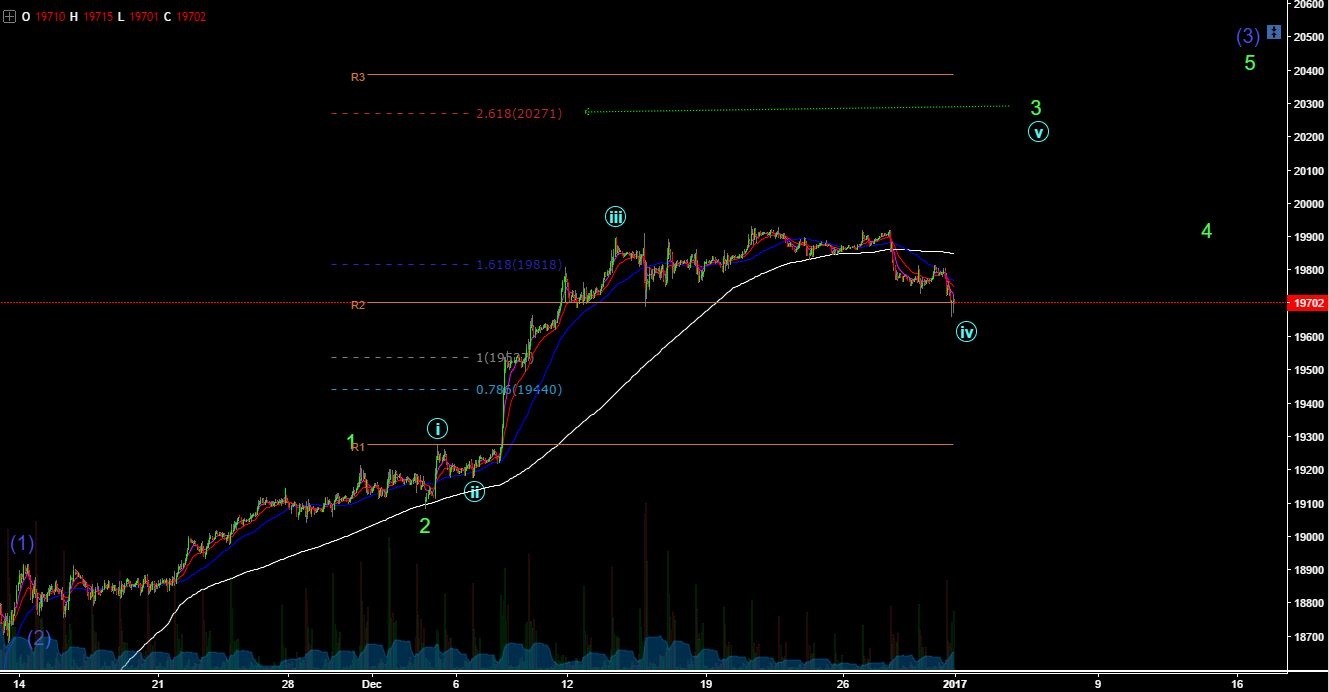
YM has a completed (ideal) flat wave iv and it is at important monthly market pivotal area. View remains bullish and we expect the next rally to start soon. We are paying attention to 19,500 support level as the 1st red-flag to damaging the bullish view. Main target for the next leg up is 20,200.
Gold 4H Chart - January 2, 2017
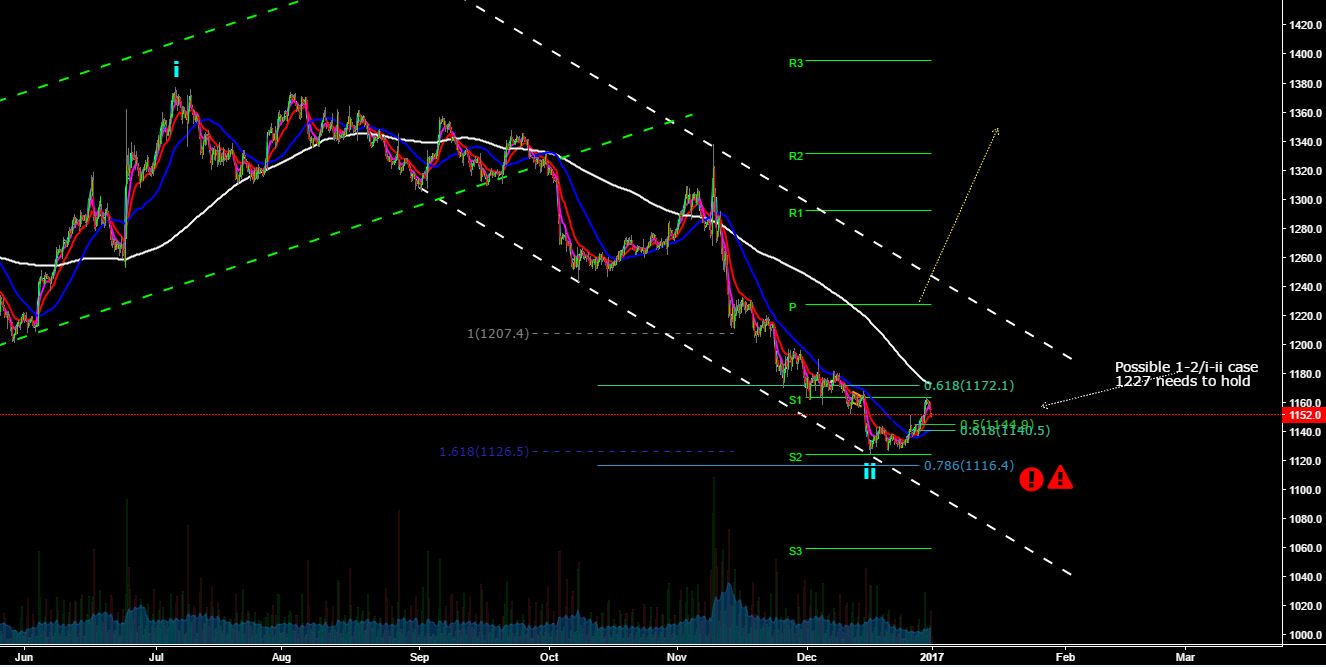
Gold has a completed corrective wave ii and the last days of 2016 might have been a struggling start for the next bullish leg above 1220. In order for bulls to turn this bounce into a rally then we need a series of 1-2/i-ii where 1227.50 is the invalidation level.


")
