Heiken Ashi Scanner
Heikin-Ashi charts, developed by Munehisa Homma in the 1700s. Munehisa Honma was a rice merchant from Sakata, Japan who traded in the Dojima Rice market in Osaka during the Tokugawa Shogunate. He is considered to be the father of the candlestick chart. The man who invented the use of candlestick charts for finding and profiting from chart patterns.He was a billionaire trader on those days if we compared his net-worth with todays dollar.
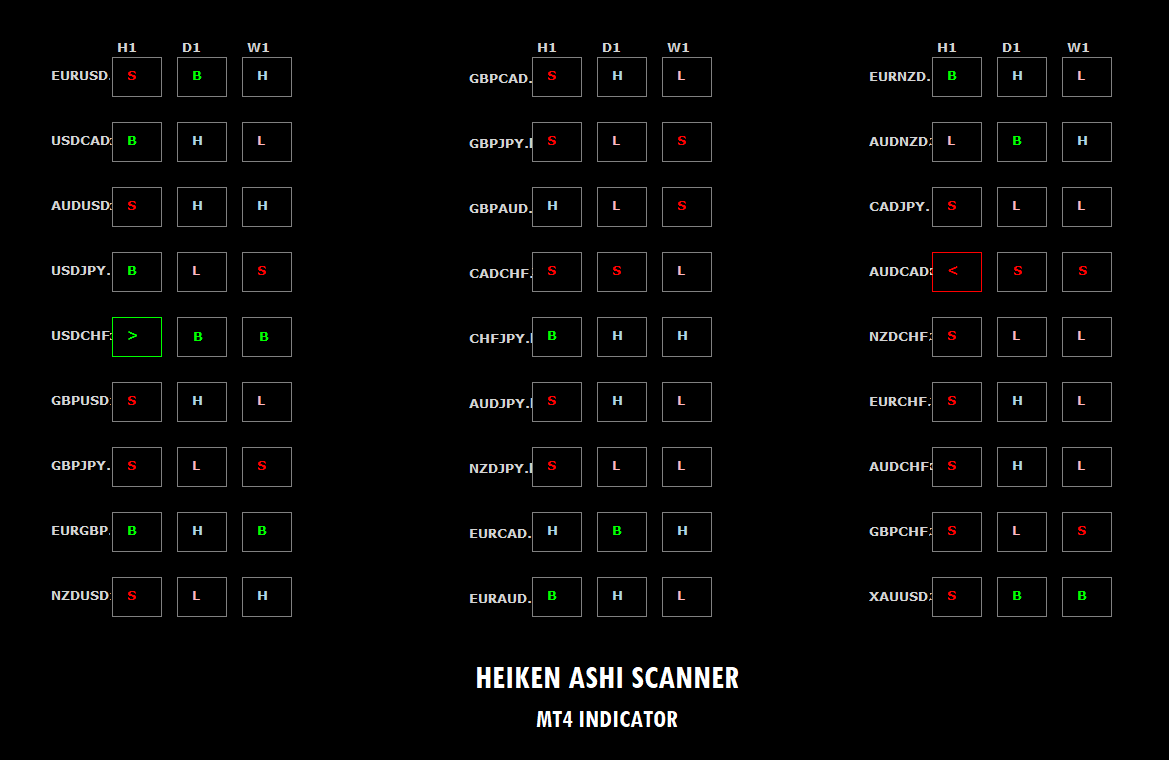
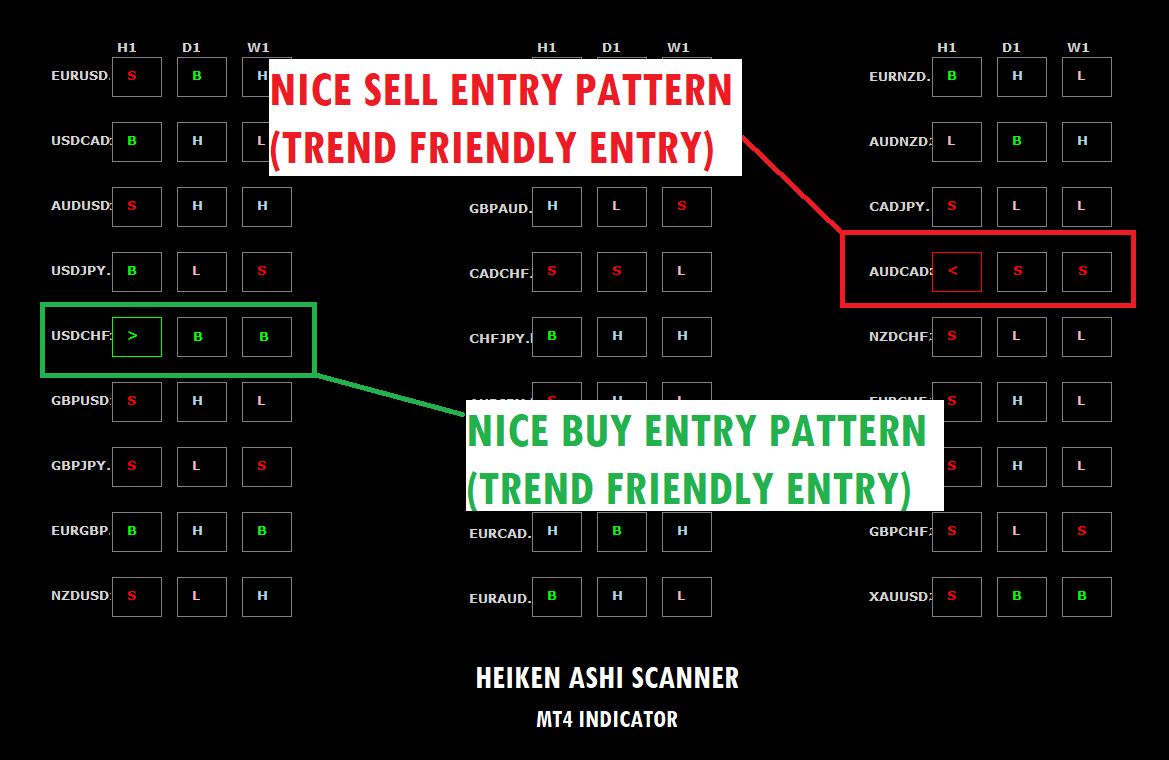
Heikin Ashi Scanner is an Multi-Currency and Multi-Timeframe Dashboard Indicator.This Indicator will display certain codes to identify the underlying instrument Price structure based on TimeFrames.I'll share few of my trade signal patterns along with this indicator through Blogs and Screenshots.
The Heikin Ashi Chart is used by technical traders to identify a given trend more easily. Because the Heikin-Ashi technique smooths price information and reduces Noise effectively, it makes trends, price patterns, and reversal points easier to spot. Candles on a traditional candlestick chart frequently change from up to down, which can make them difficult to interpret. Heikin-Ashi charts typically have more consecutive colored candles, helping traders to identify past price movements easily.
CHECK HERE - https://www.mql5.com/en/market/product/51358
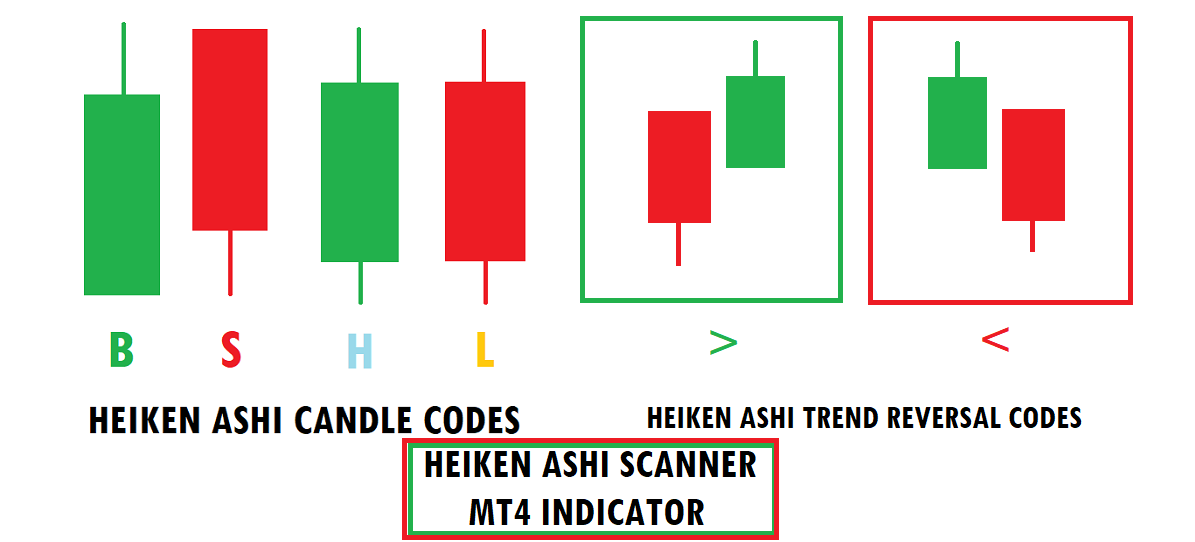
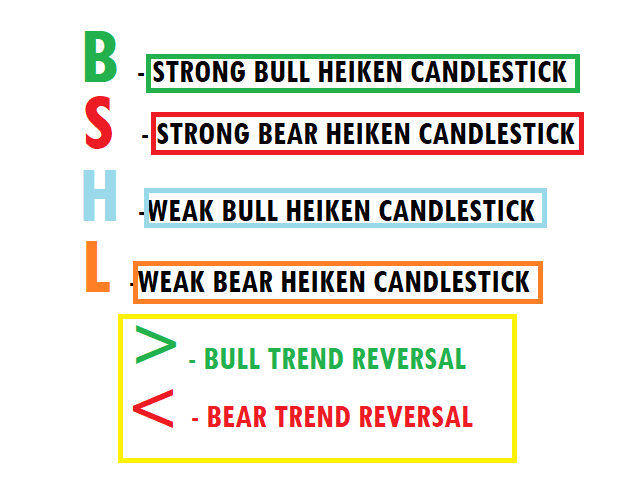
Heiken Ashi Scanner Codes:
B - STRONG BULL HEIKEN CANDLESTICK
S - STRONG BEAR HEIKEN CANDLESTICK
H - WEAK BULL HEIKEN CANDLESTICK
L - WEAK BEAR HEIKEN CANDLESTICK
> - BULL TREND REVERSAL
< - BEAR TREND REVERSAL