Overfitting in Expert Advisors: Why a Perfect Backtest Means Nothing

| Core idea A good strategy learns the signal. An overfit strategy memorises the noise. That is why a slightly less impressive backtest can be much more valuable than a flawless one: robustness matters more than cosmetic smoothness. |
Every week someone sends me a screenshot. A smooth equity curve climbing at 45 degrees, a profit factor north of four, a win rate that would embarrass a casino. Then the question: is this EA any good?
Almost always the honest answer is the same. I don't know, and neither do you. A backtest that looks perfect is not evidence the strategy works. Very often it is evidence of the exact opposite.
This is the single most expensive lesson in algorithmic trading, and almost nobody selling you an EA wants to explain it. So let's do that here.
What overfitting actually is
Price data is part signal and part noise. The signal is the small, repeatable structure that comes from how markets actually behave: liquidity, order flow, session timing, how people react to news. The noise is everything else, the random wobble that will never repeat in the same shape twice.
A good strategy learns the signal. An overfit strategy memorises the noise.
The problem is that on any single stretch of history, a model that memorises the noise looks better than one that learns the signal. It nailed every wobble. The catch is that those wobbles are gone forever, so the moment you run it forward on data it has never seen, it has nothing left to trade.
| |
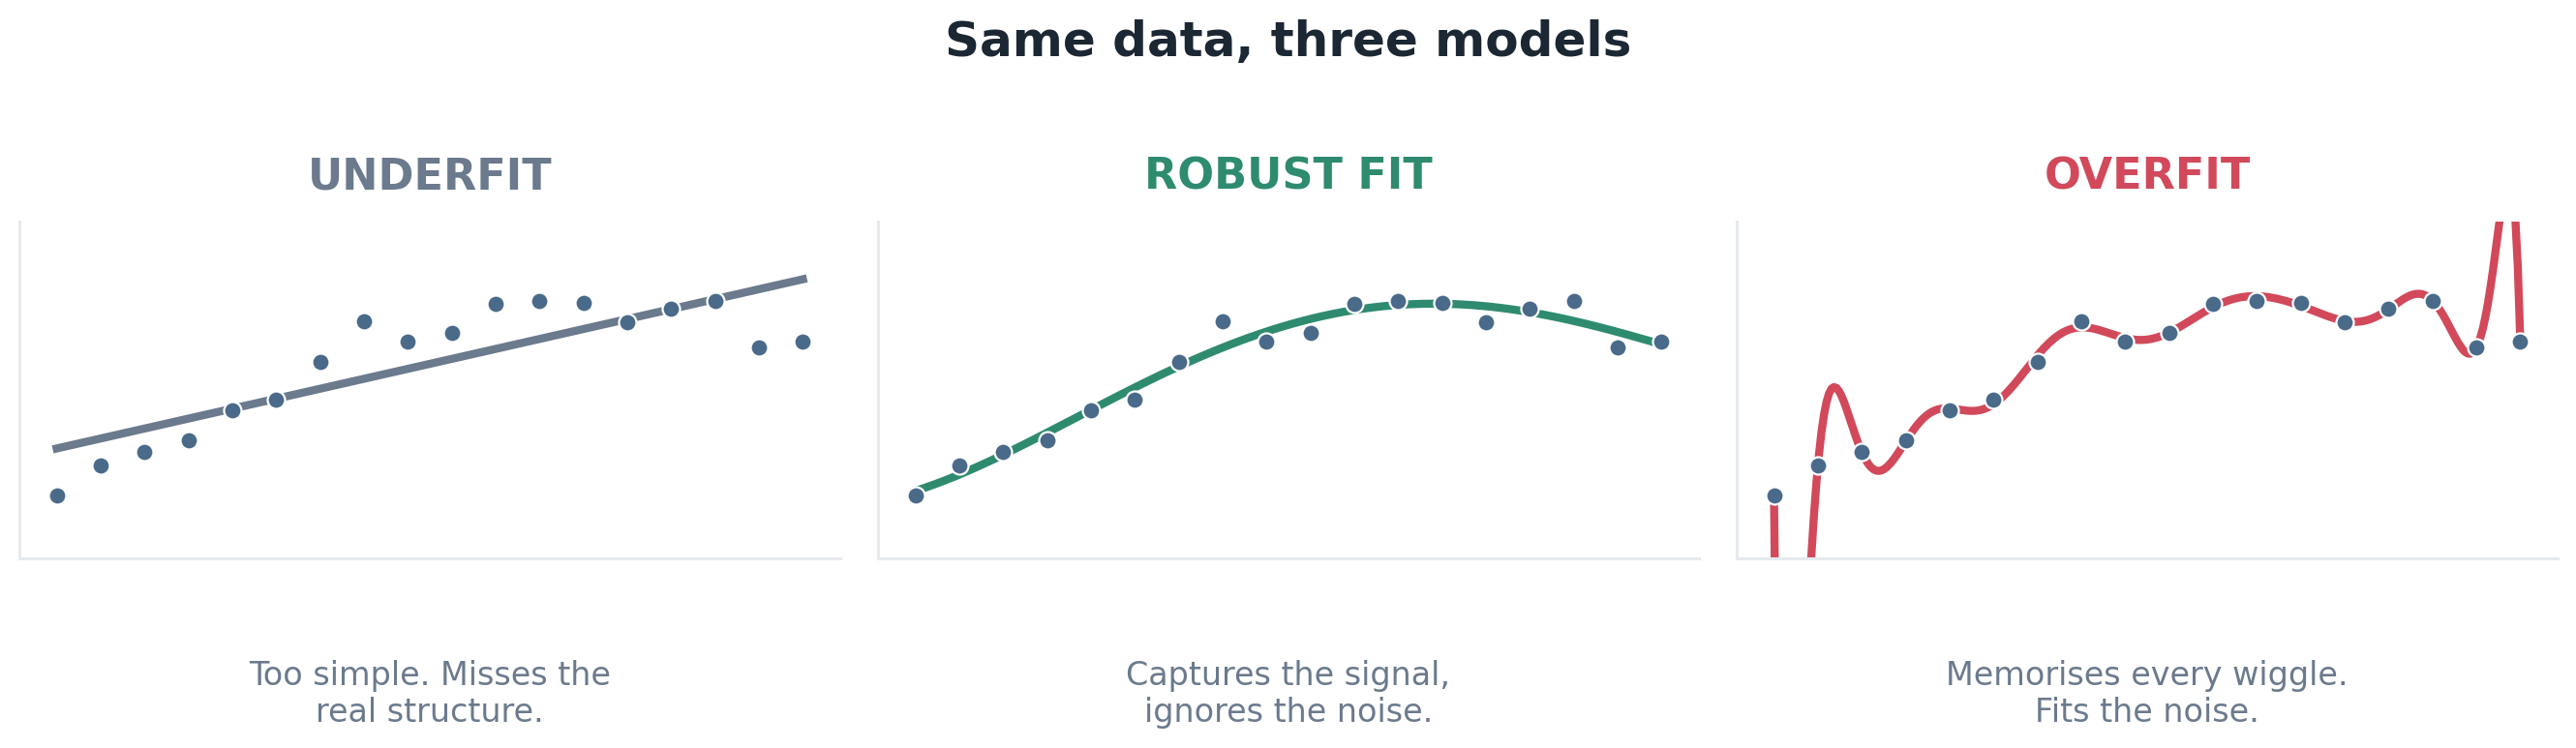
Figure 1. The same data fit three ways. The overfit model on the right hits every point and tells you nothing about the next one.
That middle picture is what you actually want. It ignores the individual points and tracks the shape. It will look slightly worse on the history and hold up far better on the future. Most EA sellers are optimising for the picture on the right and showing you the result as if it were skill.
The part nobody shows you: the math
Here is where it gets uncomfortable, and where the academic quant world is decades ahead of the retail EA market.
Marcos López de Prado and David Bailey wrote a paper with a title that says everything: Pseudo-Mathematics and Financial Charlatanism. Their core proof is brutal. High backtest performance is not hard to achieve. It is trivial. The more parameter combinations you try, the more certain you are to find one that looks brilliant purely by chance.
They put a number on it. If you have five years of data and you test more than roughly 45 independent configurations, you are almost guaranteed to produce a strategy with an in-sample Sharpe ratio of 1 whose true out-of-sample Sharpe is zero. Forty-five. The MT5 genetic optimiser burns through that before you finish your coffee.
It gets worse with scale. Run 1,000 independent backtests on pure noise, keep the best one, and the expected top Sharpe ratio is about 3.26. That is not a good strategy. That is the mathematical shadow of having looked 1,000 times.
| |
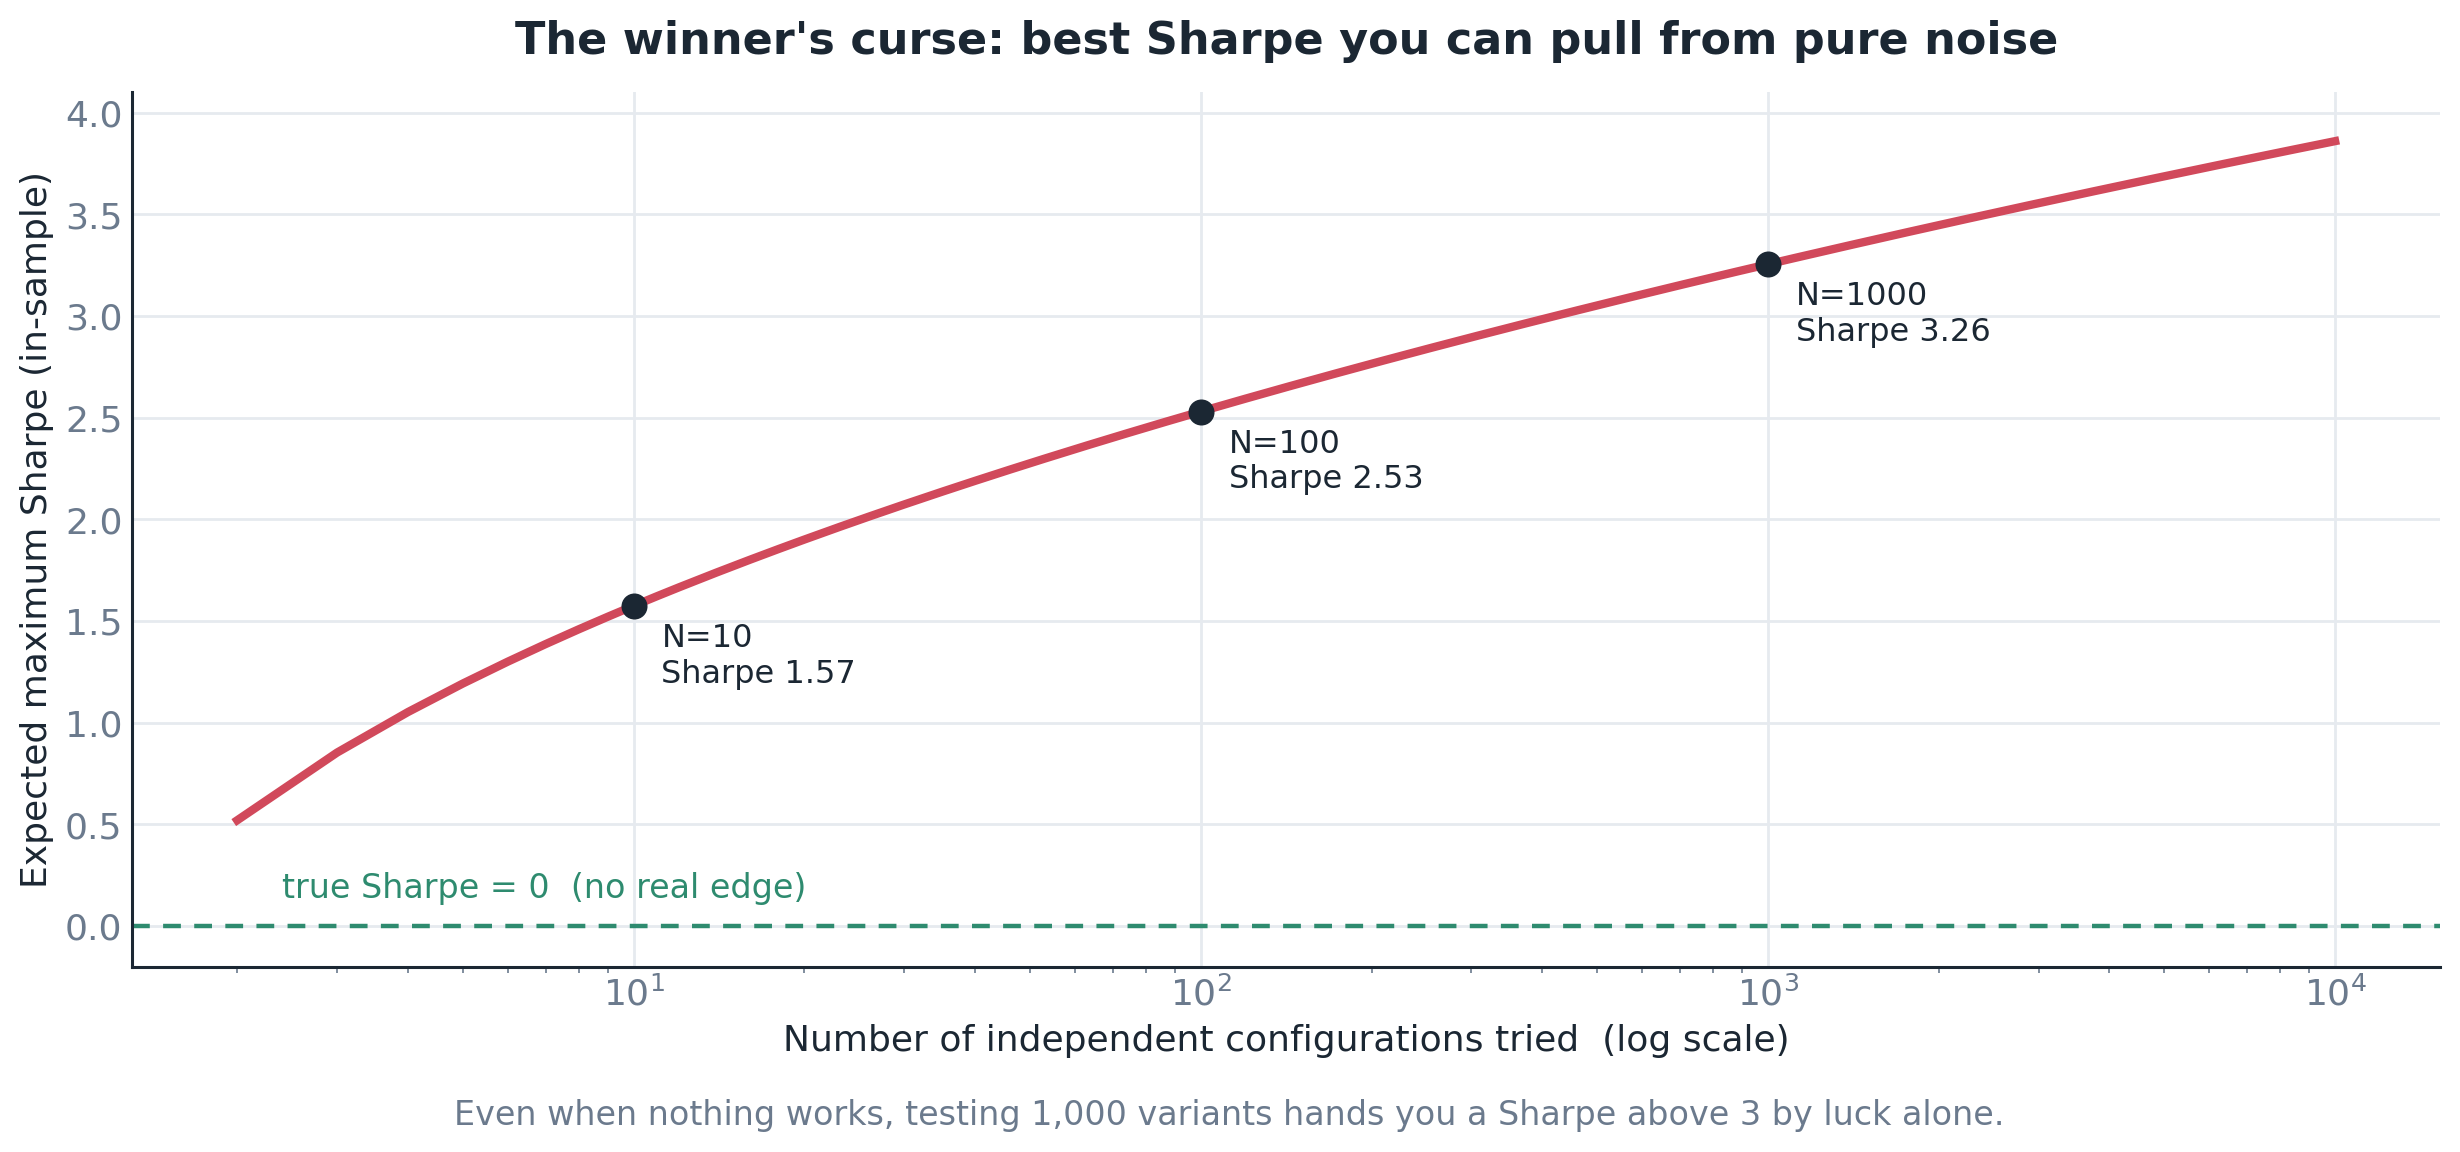
Figure 2. The winner's curse. Even on pure noise with no real edge, testing enough configurations hands you a high Sharpe ratio by luck alone.
This is why the professionals stopped trusting raw Sharpe ratios and built better tools. Three worth knowing by name:
The Deflated Sharpe Ratio (DSR) takes your headline number and discounts it for two things nobody likes to admit: how many variations you tried before picking the winner, and how non-normal your returns are (fat tails, skew). A Sharpe of 2 from one honest test is real. A Sharpe of 2 selected from 500 attempts is mostly noise, and the DSR shows you that.
The Probability of Backtest Overfitting (PBO) answers a sharper question. Of all the configurations you tried, take the one that ranked best on your training data. What is the chance it ranks below the median on data you held back? If that probability is high, your selection process is fitting noise, and your "best" setting is no better than a coin flip out of sample.
Purged and embargoed cross-validation deals with leakage. When trades overlap in time, ordinary validation lets information bleed from the test set into the training set. You purge the overlapping samples and add a gap (an embargo) so the model is genuinely tested on independent data.
This matters most when observations are not independent, for example when trades overlap in time or when a setup holds positions across multiple bars. Without purging and embargoing, the test set can quietly leak information back into the training set.
| You don't need to code all of this to be a good developer. You need to internalise what it means: every extra thing you optimise is a loan against your live account, and the interest is overfitting. In practice, this means the development process matters as much as the strategy idea itself. A weak validation process can manufacture a beautiful equity curve out of nothing. |
Winning the backtest is not winning the market
There is one image that made this click for me more than any formula.
Take pure random-walk data, with no edge in it at all. Now run hundreds of strategy variants and plot each one's in-sample Sharpe against its out-of-sample Sharpe. If in-sample performance meant anything, you would see a diagonal line. Good in-sample, good out-of-sample.
You don't. You get a circular cloud centred on zero.
| |
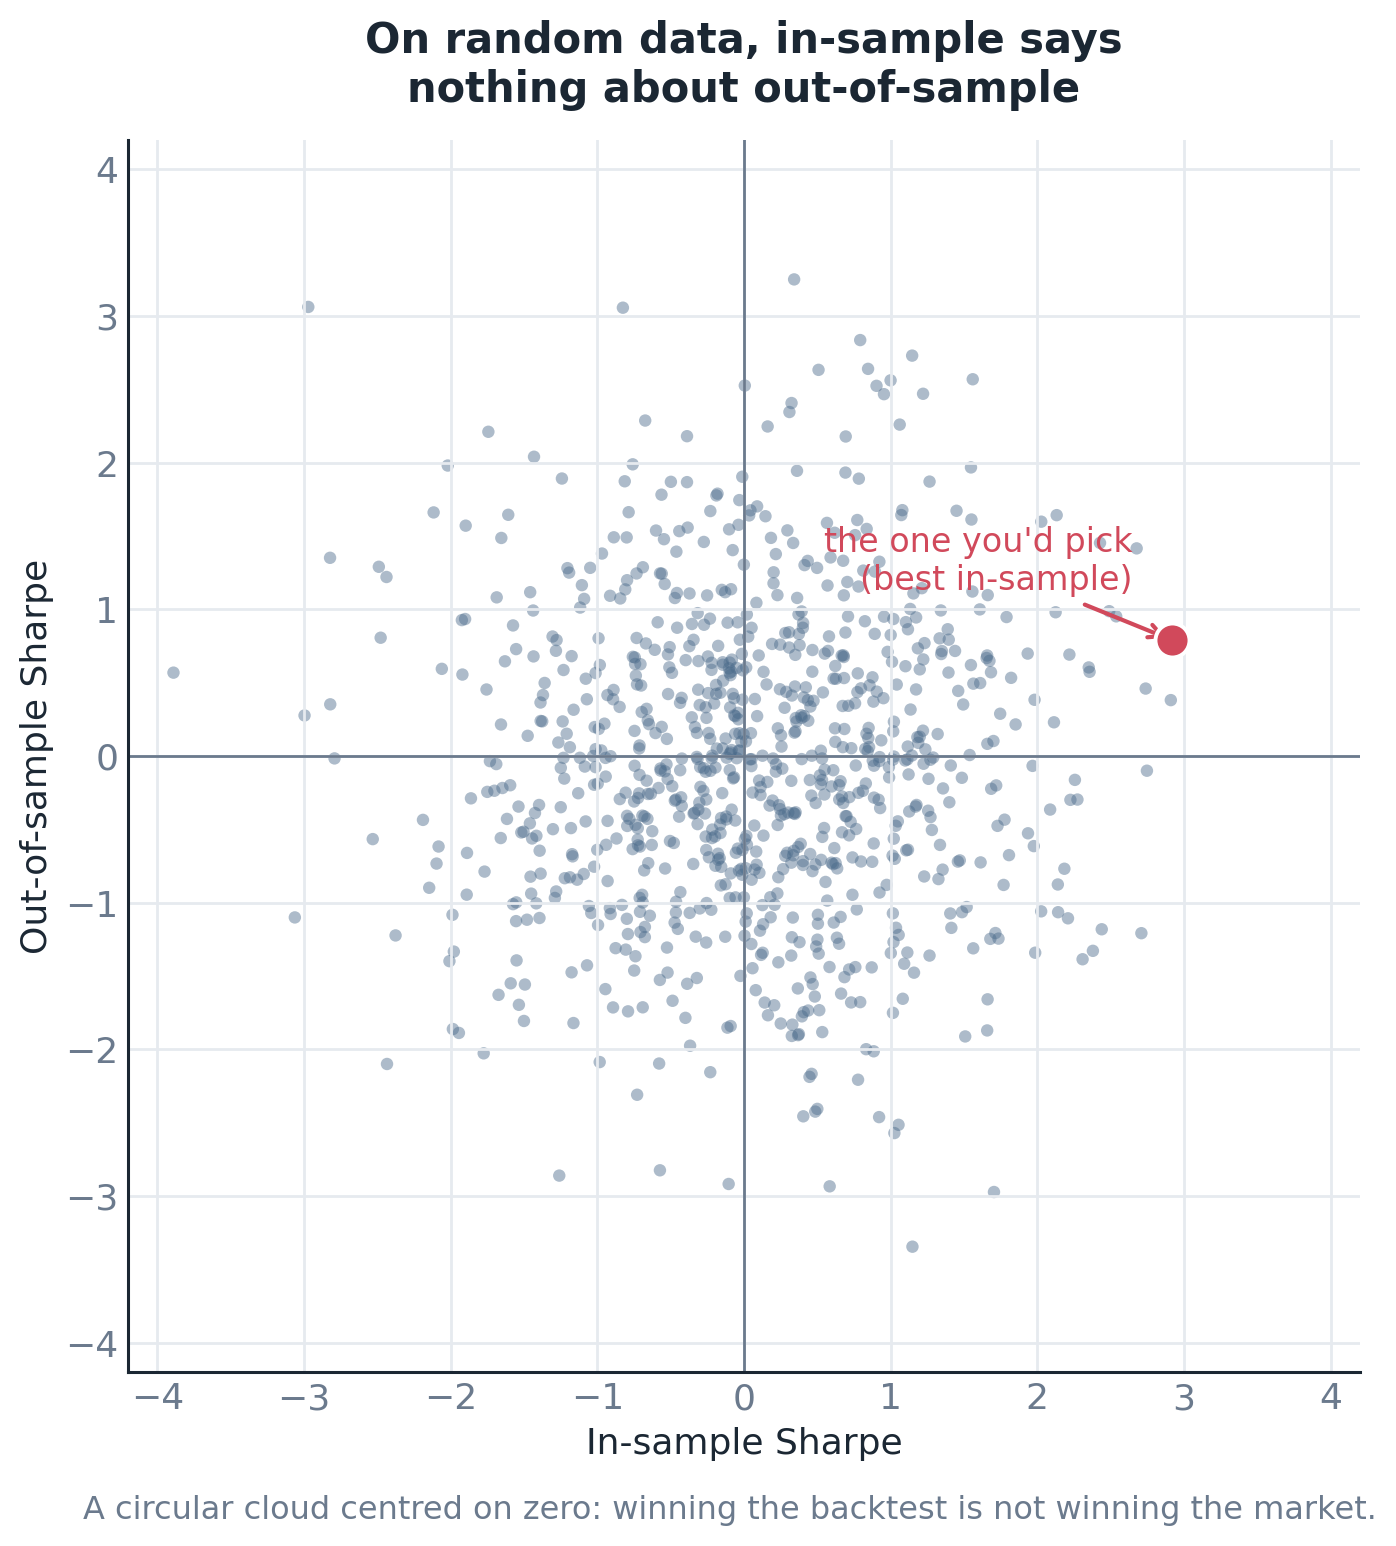
Figure 3. In-sample versus out-of-sample Sharpe on random data. The strategy with the best backtest (far right) is dead average out of sample. The ranking carried no information at all.
The strategy you would have chosen, the one with the highest in-sample Sharpe, lands right in the middle vertically. Its future performance is a coin toss. That is the whole trap in one picture. A great backtest is not a promise about the future. On overfit systems it is not even a hint.
Why it happens to honest people too
Overfitting is not always fraud. Most of the time it is a well-meaning developer falling into the same traps:
Too many parameters. Every input you let the optimiser tune is another degree of freedom, another dial to accidentally fit to the past. Ten free parameters is not ten times more powerful than one, it is ten times more likely to be curve-fit.
Optimising on one dataset. You run a sweep, you pick the peak, you ship it. But the peak of a noisy surface is mostly noise. You didn't find the best setting, you found the luckiest cell.
Testing on your own out-of-sample data. You hold back six months, your EA fails, so you tweak and re-test on those same six months. Do that ten times and your hold-out is no longer a hold-out. You have quietly optimised on it.
Selection bias. You build 30 EAs, one looks incredible, you remember that one and forget the other 29. The survivor feels like proof. It is just the top of a random pile.
The red flags you can check in five minutes
| |
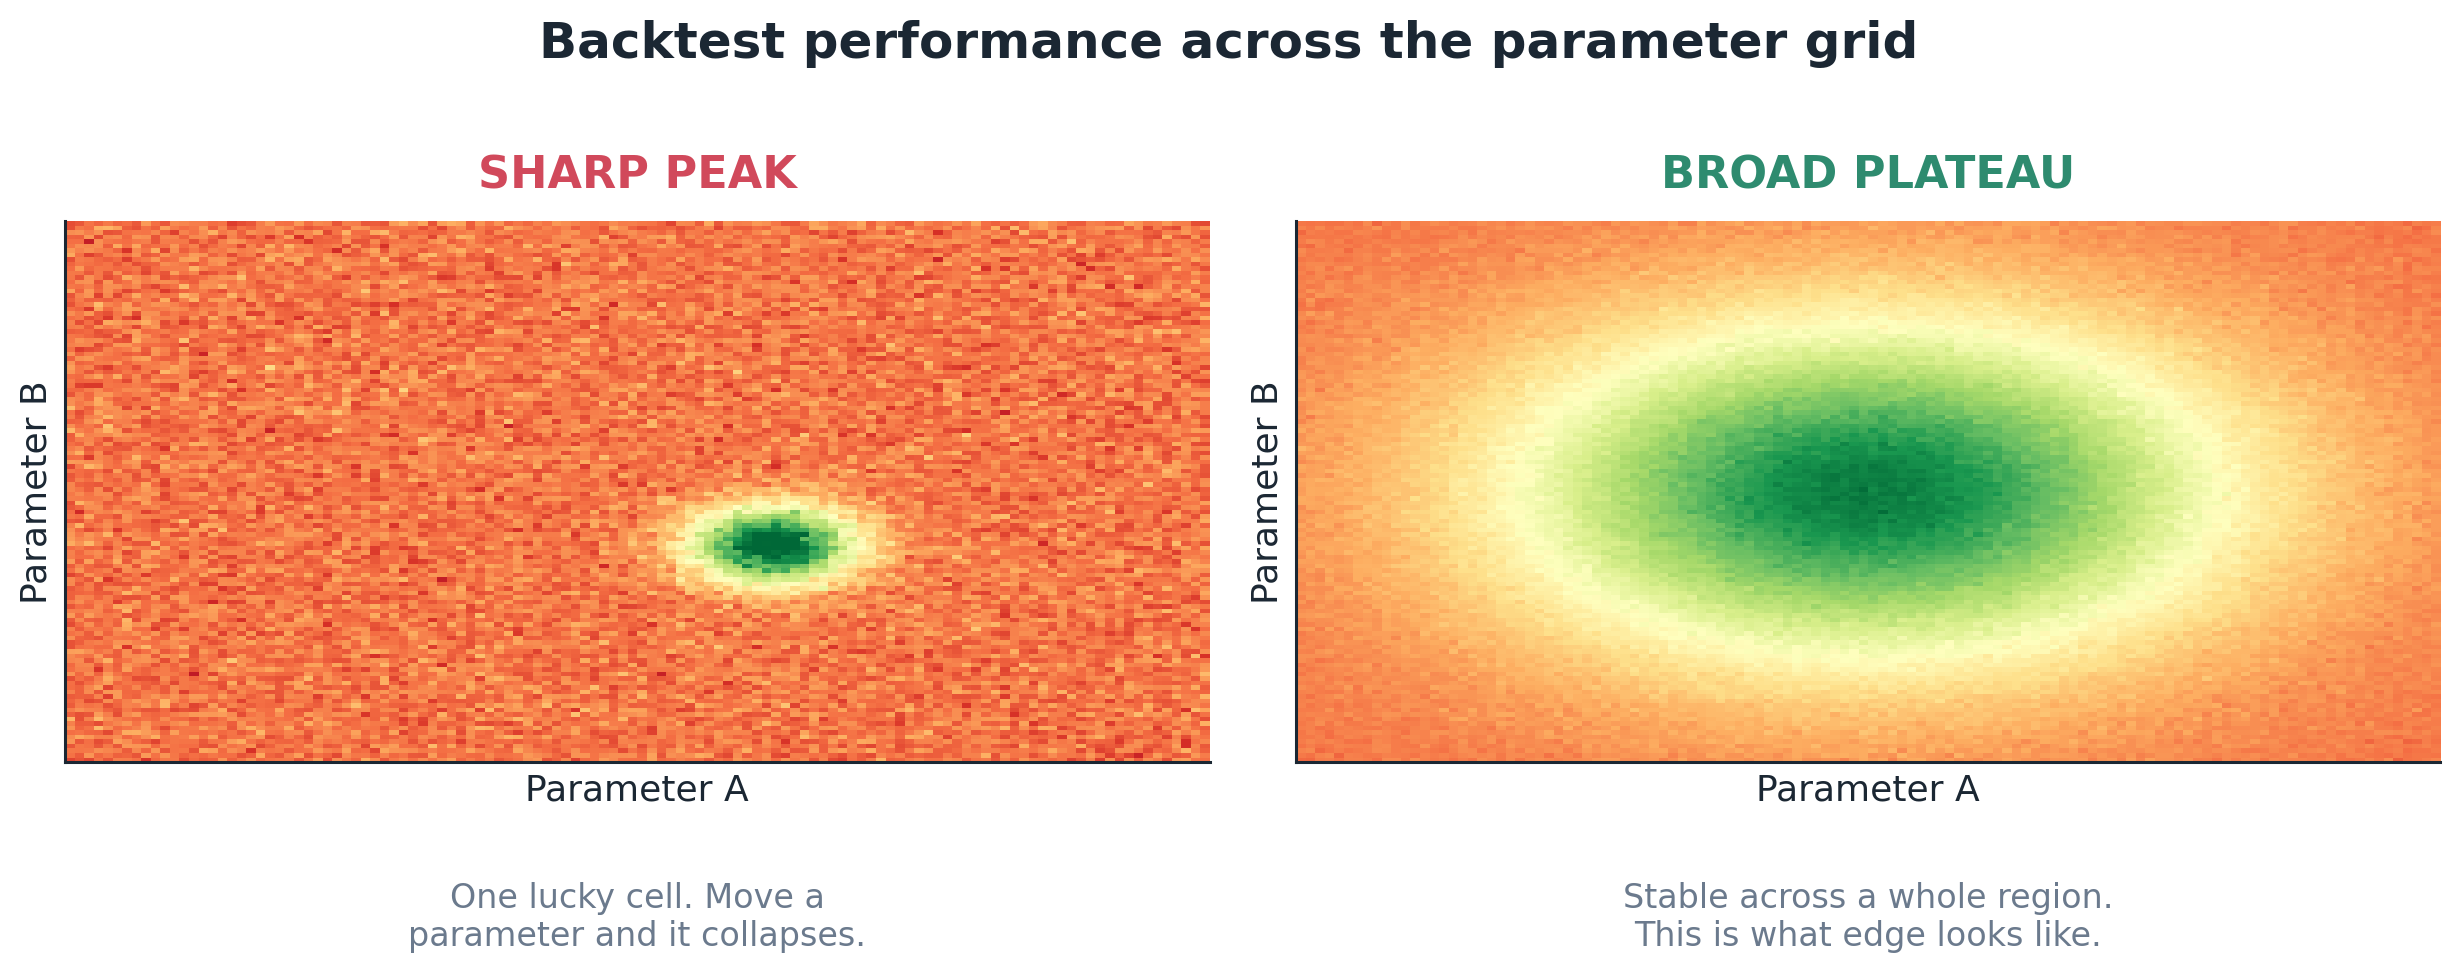
Figure 4. Backtest performance across the parameter grid. A single lucky cell versus a stable region. You want the plateau. If your result only exists at one exact combination, it is a coincidence, not an edge.
| Before you trust any backtest, yours or someone else's, run down this list. Numbers that are too clean. A Sharpe above 5, a profit factor above 4, a win rate above 90 percent over hundreds of trades. Real edges are modest and messy. Perfection is a fingerprint of fitting. An equity curve with almost no drawdown. Real strategies breathe. A straight diagonal line usually means the losses got optimised away in hindsight, which is exactly what won't happen live. A big gap between in-sample and out-of-sample. If it prints money on the optimisation window and stalls the moment the hold-out begins, that cliff is the overfitting showing itself. Fragile parameters. Nudge a setting by a few percent. If performance collapses, you were sitting on a lucky spike, not an edge. Too few trades. Under 100 trades is an anecdote, not evidence. A profit factor of 4 over 8 trades tells you nothing. Wrong data source. This one is quiet and deadly. Bar data (OHLC) structurally overstates any path-dependent logic like trailing stops or breakeven, sometimes by many multiples, because it never sees the real intrabar path. A backtest run on cheap data with a tight trail can look several times better than the same EA on real ticks. Always ask what data was used. If nobody will tell you, assume the worst. If the strategy depends on intrabar behaviour such as trailing, breakeven, partial exits, or rapid stop management, real-tick testing is the benchmark that matters. Otherwise the tester is effectively guessing the path price took inside the bar. |
The single best test: live signal versus backtest
| Everything above is theory until you get one thing that cannot be faked: forward performance the strategy has never seen. Forward data forces honesty because it removes the one thing optimisers rely on: the ability to keep searching the past until something attractive appears. |
A live signal, or even a proper forward run on demo, is the ultimate out-of-sample test. Nobody can optimise against data that hasn't happened yet. So compare the two, side by side, and look for divergence.
What you are looking for is behavioural consistency, not perfect profit replication. The win profile, holding times, trade frequency, and drawdown character should still resemble the backtest if the system is genuine.
Watch the win rate, the average holding time, the drawdown profile, and how often it trades. When the live behaviour drifts far from the backtest, that gap is telling you the backtest was leaning on something that isn't there in reality.
I once reverse-engineered an EA that backtested at 71 percent win rate with trades held 35 to 49 minutes. The live signal ran at 98 percent, with a median hold of about 2.5 minutes. That is not the same strategy. The backtested version was quietly using logic the Strategy Tester couldn't run, so the two lived in different worlds. The divergence was the evidence.
Slippage and spread are part of this too. A backtest assumes clean fills. Live, a tight-trailing system clips small winners and eats full stops, and the asymmetry only shows up in real execution. If someone shows you a backtest and refuses to show a matching live record with the same magic number, that silence is your answer.
Three things people confuse with overfitting
Not every EA that fails live is overfit. Getting the diagnosis right matters, because the fix is different for each.
Overfitting is a method problem. You fit the noise. The fix is fewer parameters, honest validation, and real hold-outs.
Look-ahead bias is a bug. Your logic uses information it could not have known at decision time, like a filter reading the current day's close to make a morning entry. I have seen a strategy go from clearly profitable to statistically flat the instant one look-ahead line was corrected. This is not overfitting, it is a leak, and no amount of validation catches it if you never inspect the code.
Regime change is the world moving on. The edge was real, then volatility or market structure shifted and it stopped working. That is not a flaw in your process, it is trading. The answer is monitoring and knowing when to stand down, not more optimisation.
An honest strategy can therefore underperform for extended periods without being defective. The key question is whether the weakness is consistent with the edge profile, or whether the strategy simply collapses whenever it sees unseen data.
A regime profile is honesty, not a flaw
Here is the flip side, and it matters. A strategy performing differently across market conditions is not automatically overfit. It can be a completely honest edge with a known profile.
Take a breakout system. It needs directional movement to work. Give it a trending, expansive market and it delivers. Drop it into a choppy, range-bound stretch and it takes small losses on false breaks and mostly waits. Those are not two different strategies, and neither one is broken. It is one edge meeting two different environments.
| |
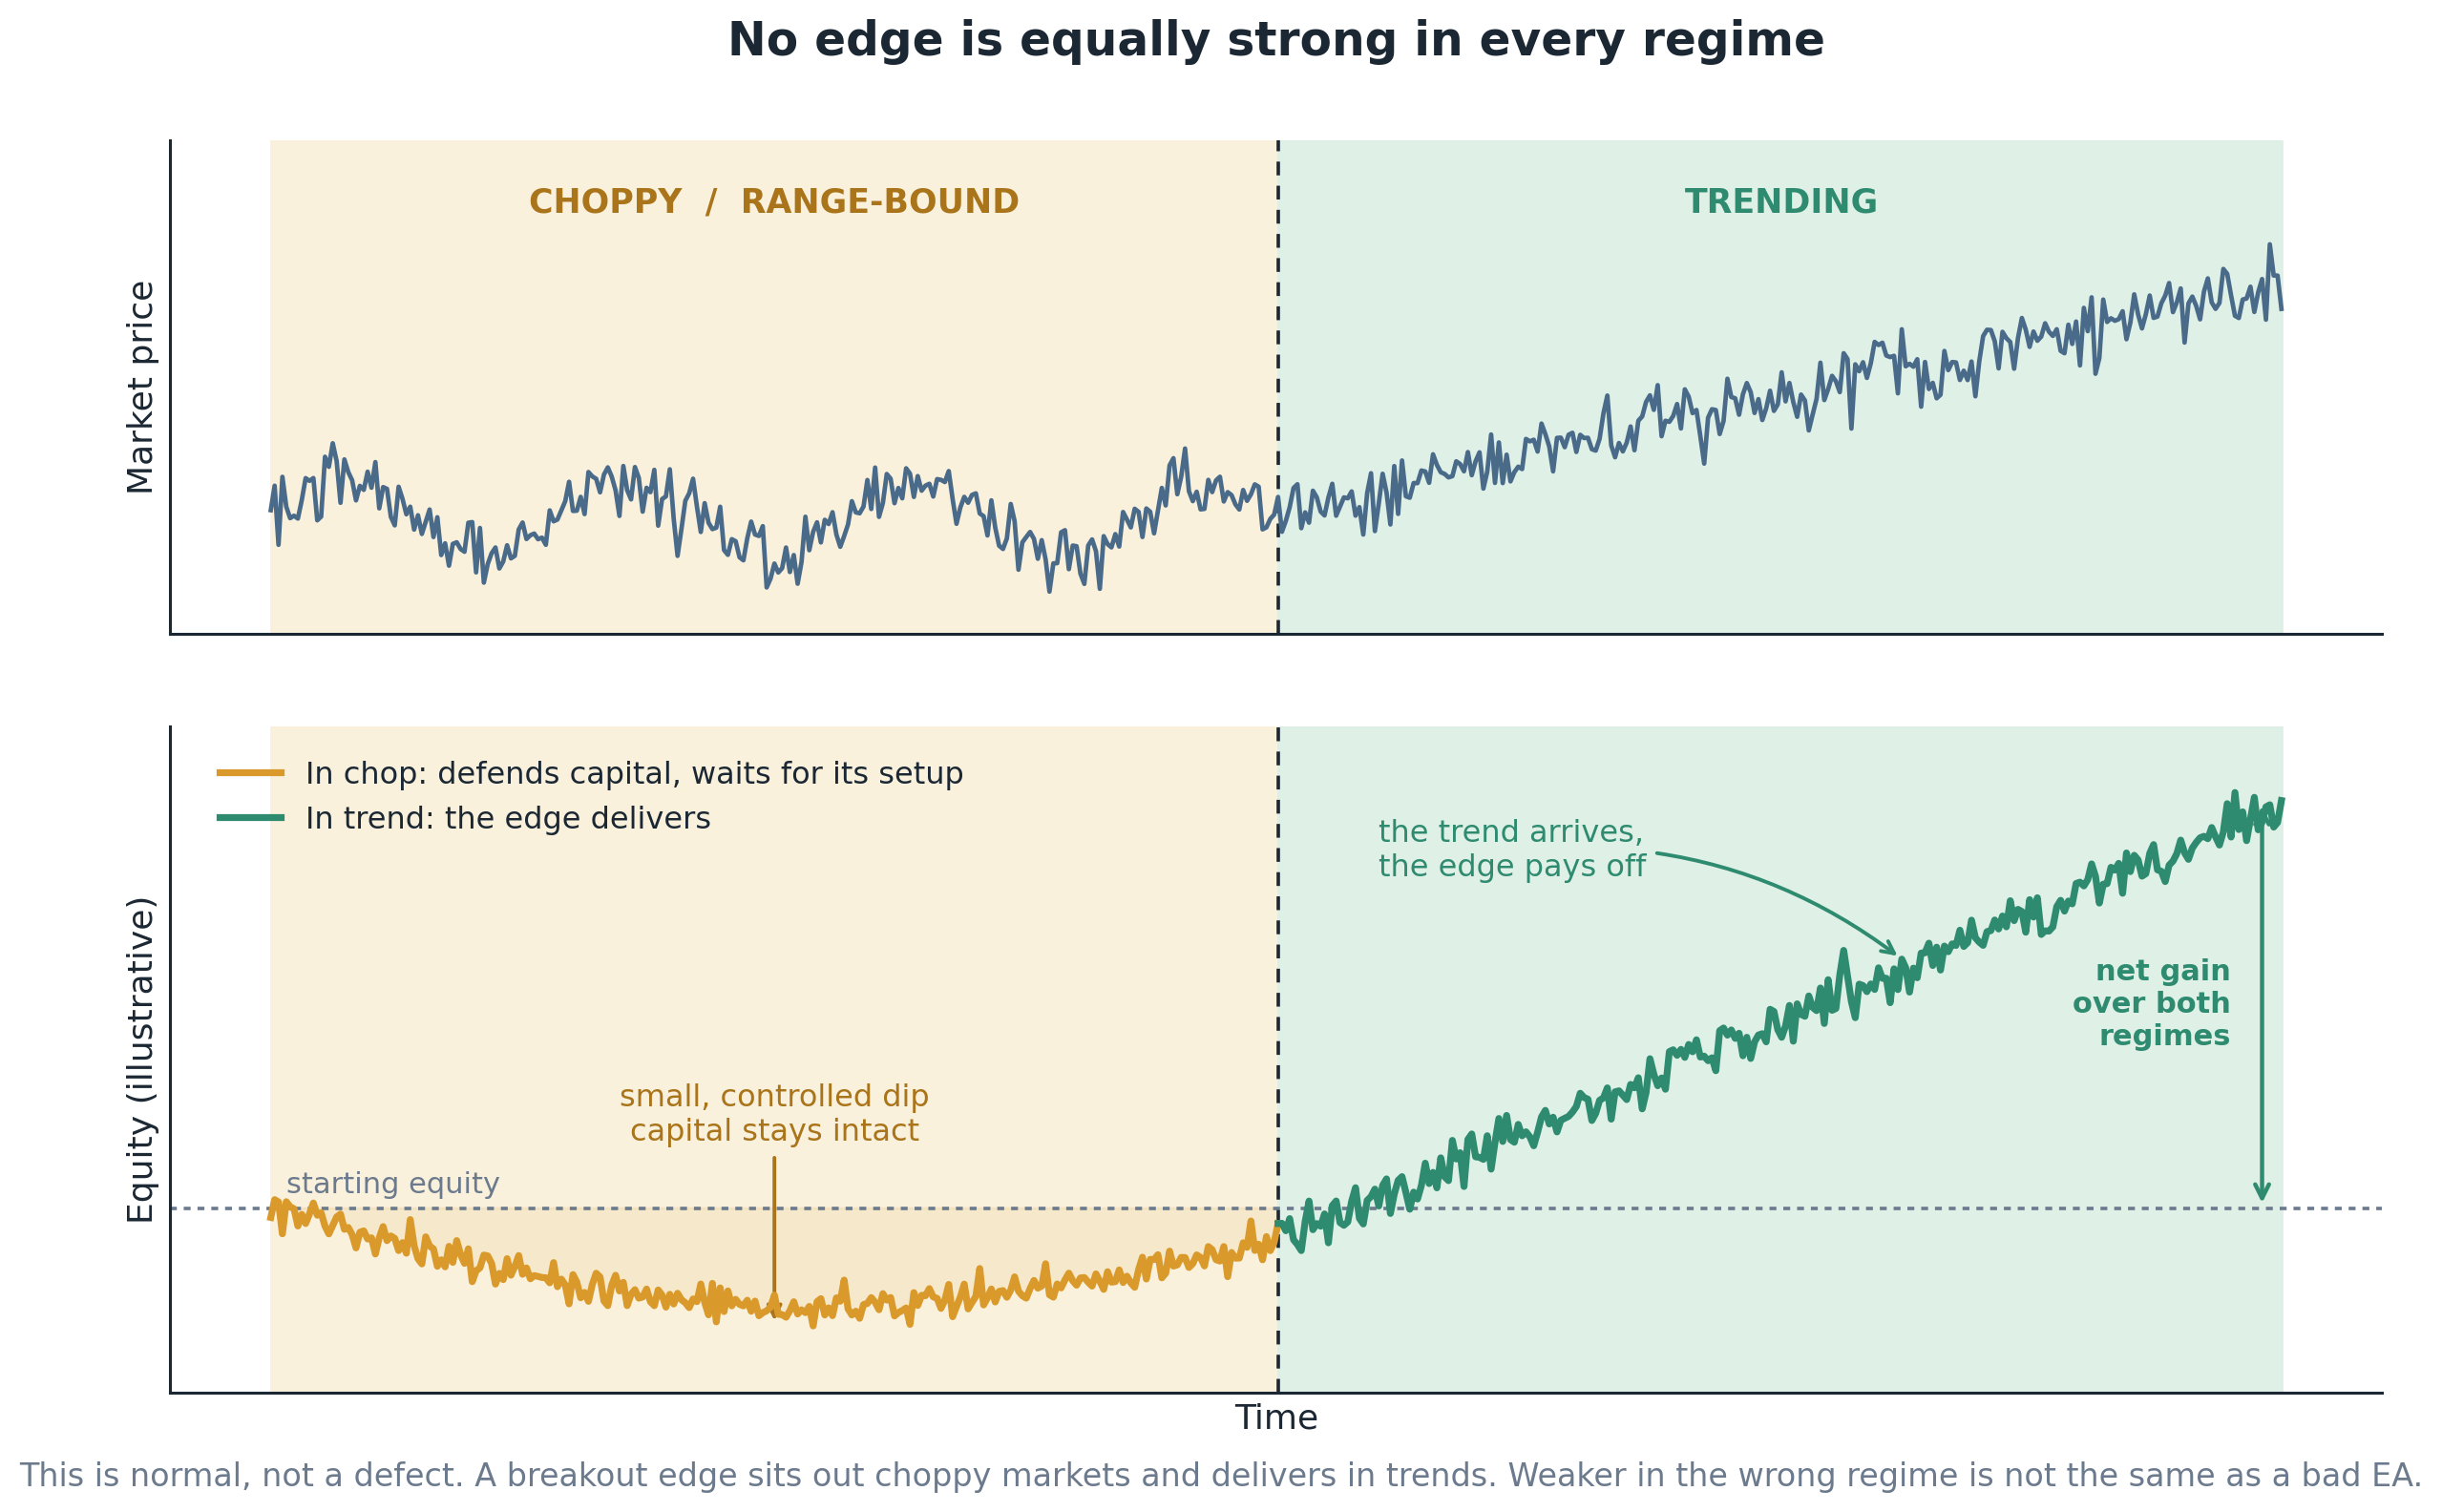
Figure 5. The same edge in two regimes. In chop it defends capital and waits, taking only small controlled dips. In a trend it delivers. Net result over both: up. Being weaker in the wrong regime is not a broken EA, it is a profile you can explain in advance.
| The difference between this and overfitting is the difference between a reason and a coincidence. A regime-dependent edge fails in chop for a structural reason you can name up front, and you can see the condition changing in the market itself. An overfit system fails on new data for no reason at all, in conditions that look identical to the ones it was built on. A profile can be explained in advance. Overfitting can only be explained after the failure happens, which is precisely why it is dangerous. |
So when a developer tells you plainly that their EA is a breakout system that underperforms in ranging markets, that is not a weakness in the product. That is someone who understands their own edge and isn't hiding it from you. The ones to be careful with are the ones who claim their system prints money in every condition, every month, forever. That EA does not exist. That backtest was fit.
How to build something that actually survives
The whole discipline comes down to one idea: prove the edge is real before you fall in love with the numbers.
Keep it simple. Fewer parameters, fewer dials, a logic you can explain in one sentence. Complexity is where overfitting hides.
Hold out real data and touch it once. Lock the last stretch of history away, develop on the rest, and run the hold-out a single time as a genuine go or no-go. The moment you re-test on it, it's contaminated.
| |
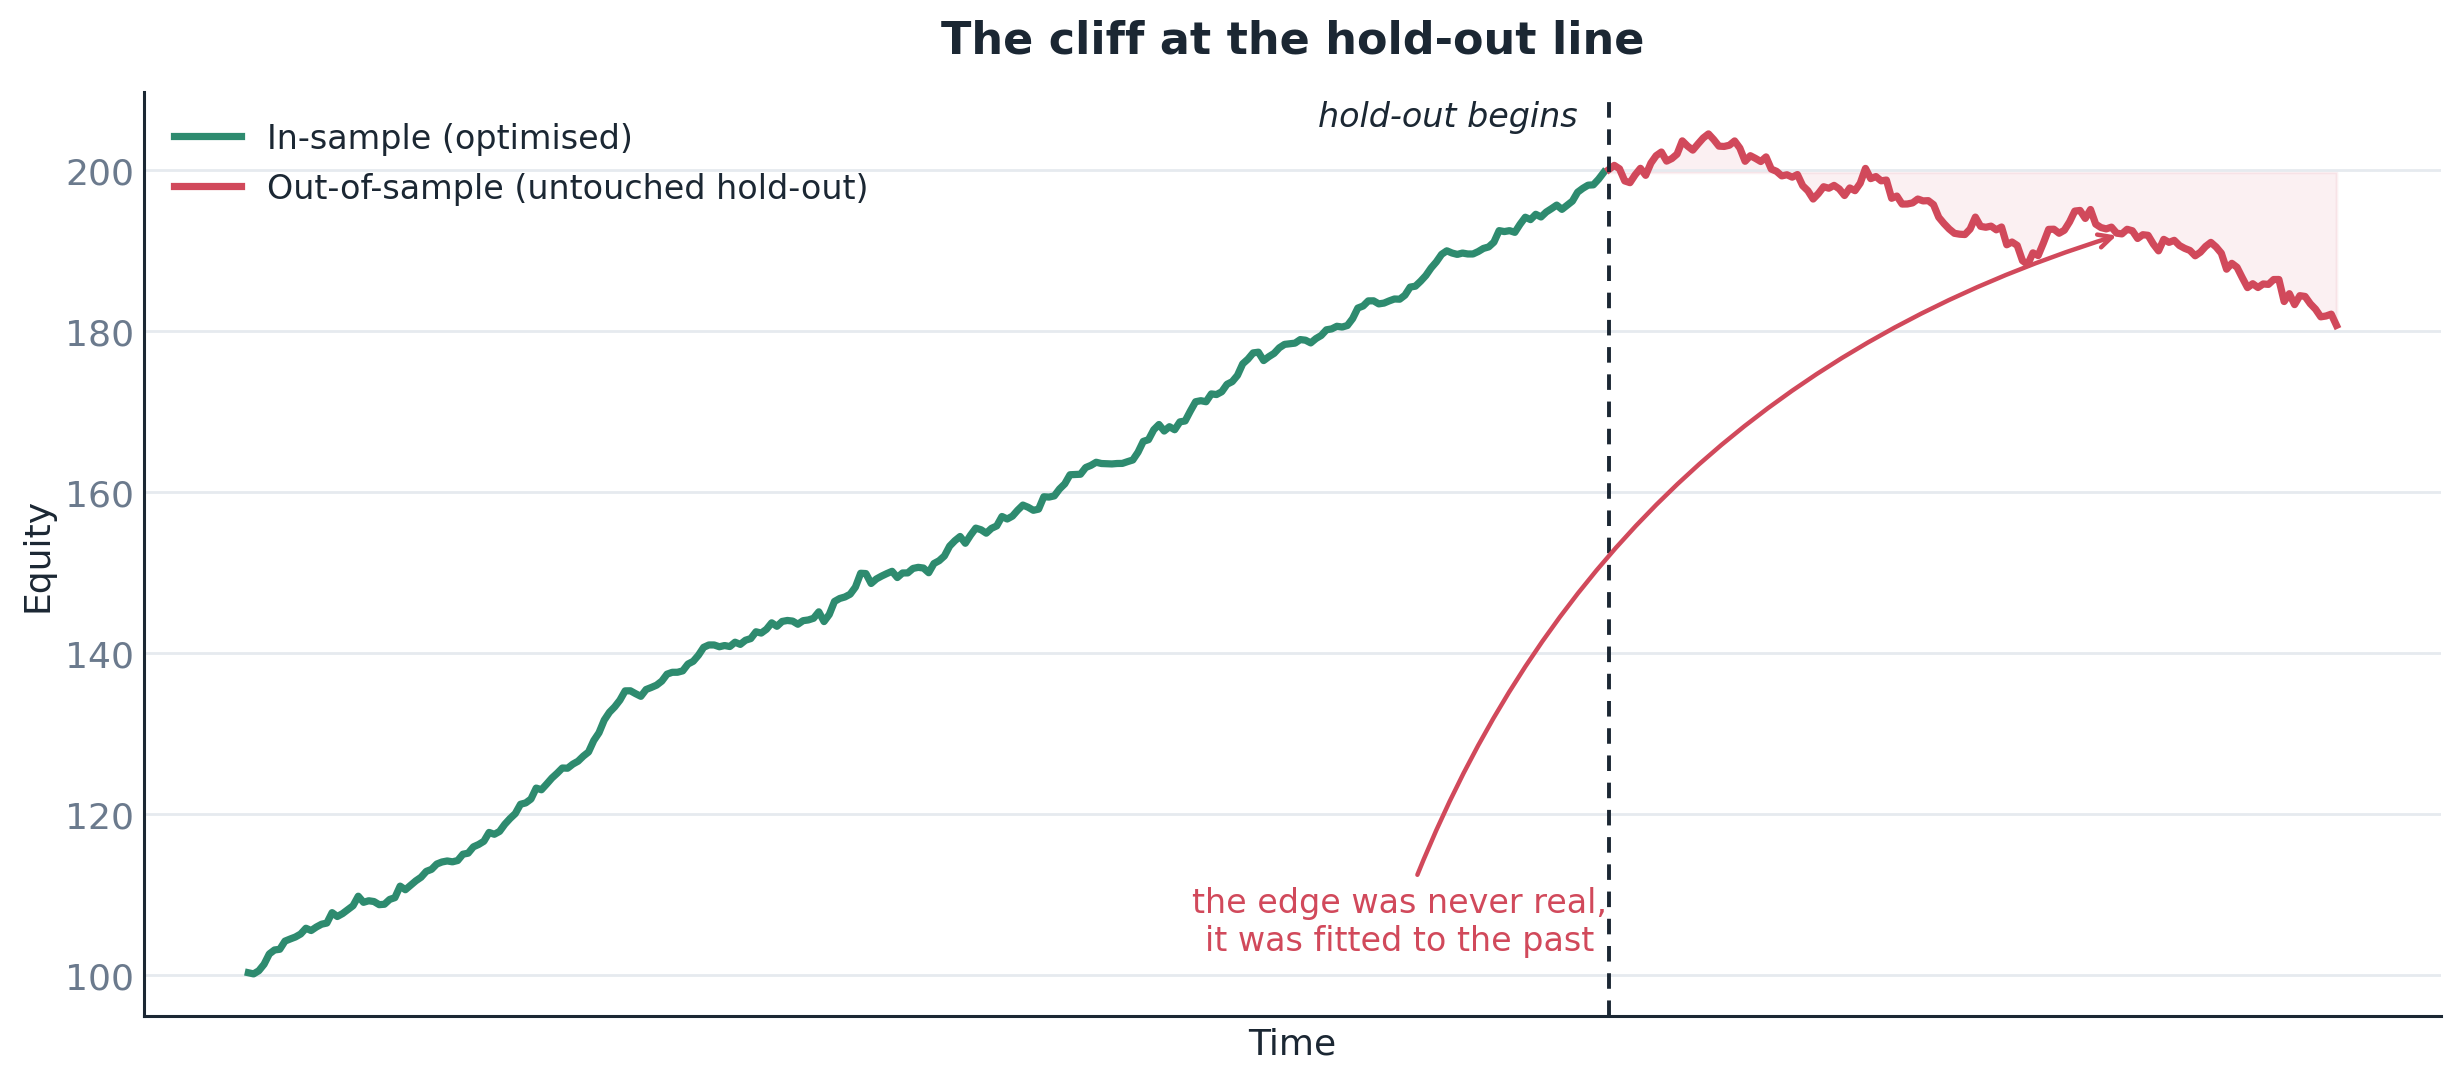
Figure 6. A properly untouched hold-out is where overfitting comes to die. If the curve falls off the cliff at the hold-out line, you found out before your money did.
Walk it forward. A single train-test split is weak. Roll the window forward across multiple folds so the strategy has to prove itself again and again on fresh data.
If the strategy only looks good in one split but not in the others, you do not have a repeatable edge. Walk-forward testing is valuable because it repeatedly asks the system to prove itself on fresh unseen windows.
Stress the costs. Add realistic spread, commission, and slippage, then check the edge is still there. If it only survives on perfect fills, it doesn't survive.
This is especially important for active systems with small average trade expectancy. A strategy can survive idealised costs and still be structurally untradable once realistic execution friction is applied.
Use Monte Carlo. Shuffle the trade order, resample, vary the start point. A robust system stays profitable across the spread of outcomes. A fragile one only works on the exact sequence it was built on.
Monte Carlo is useful because it asks a practical question: if the exact order of wins and losses had been different, would the system still look acceptable? Robust strategies survive many plausible paths, fragile ones only survive the one they were born with.
Demand a story. This is the one most people skip. A real edge has a reason it exists: a structural inefficiency, a behavioural pattern, a timing quirk you can name. If you cannot explain why it should work, all you have is a shape that fit the past. Numbers without a reason are just a pretty coincidence waiting to be exposed.
A reason does not need to be academic jargon, but it does need to be coherent. If the developer cannot explain why the edge should exist, then the backtest is likely describing a pattern in the sample rather than a durable market tendency.
Bottom line
| A backtest is a hypothesis, not a track record. Its only job is to be falsified. The developers worth trusting are the ones actively trying to break their own systems before you ever see them, and the ones who show you live results next to the backtest with nothing to hide. The right use of a backtest is not to prove a strategy works, but to identify where it breaks, how sensitive it is, and whether it deserves forward capital at all. |
The next time you see a flawless equity curve, don't ask how much it made. Ask how many configurations were tried, what data it ran on, whether there's a hold-out, and whether the live signal still looks like the backtest.
If the seller can't answer those, you already have your answer.
| You can follow the live performance of my own systems here |