

Ultra Charts: Complete User Guide
Introduction
Ultra Charts is a powerful Expert Advisor that transforms your MetaTrader 5 platform by enabling multiple alternative chart types beyond the standard candlestick, bar, and line charts. This tool gives traders access to Second Charts, Tick Charts, Renko, Range, Line Break, and Heiken Ashi charts—all within the familiar MT5 environment.
This guide will walk you through each chart type, explain the settings, discuss performance considerations, and show you how to use the control panel effectively.
Getting Started with MT5 Ultra Charts
The Control Panel Overview
Once activated, MT5 Ultra Charts displays a user-friendly control panel with six main buttons:
- Add New: Creates a new custom chart based on your selected parameters
- Clear: Closes & removes all currently displayed custom charts for the chart type
- Scroll Up: Navigates upward through your list of charts
- Scroll Down: Navigates downward through your list of charts
- Open Charts: Opens selected charts in new windows
- Close Charts: Closes & removed all currently opened charts

Chart Types and Settings
1. Second Charts

What Are Second Charts?
Second Charts create new candles based on time intervals measured in seconds rather than minutes or hours. This provides ultra-short-term price action visibility.

Key Settings:
- Period: Number of seconds per candle, with an upper limit of seconds
- Days Back: How many days back worth of data we want to use to create custom bars
Performance with Smaller Ranges:
When using very small second intervals (5-15 seconds), expect:
- High CPU usage during active market hours
- Large data storage requirements
- Excellent granularity for scalping strategies
- More noise in price action
- Faster signal generation
Best Use Cases:
- Scalping strategies
- Order flow analysis
- Entry timing refinement
- High-frequency trading setups
2. Tick Charts
What Are Tick Charts?

Tick Charts create a new candle after a specified number of price changes (ticks) occur, regardless of time. This volume-based approach filters out low-activity periods.

Key Settings:
- Ticks Per Bar: Number of ticks before a new candle forms (e.g., 50, 100, 500)
- Days Back: How many days back worth of data we want to use to create custom bars
Performance with Smaller Ranges:
Using lower tick counts (10-50 ticks per bar) results in:
- Extremely fast candle formation during volatile periods
- Slower candle formation during quiet markets
- Better filtering of time-based noise
- Higher processing demands
- More responsive to actual trading activity
Best Use Cases:
- Volume-based trading strategies
- Market volatility analysis
- Filtering consolidation periods
- Order book analysis
3. Renko Charts
What Are Renko Charts?

Renko charts display price movements using bricks of fixed sizes, filtering out minor price fluctuations and time entirely. A new brick only forms when price moves a predetermined amount.

Normal Renko

Median Renko

Geometric Renko

Turbo Renko
Key Settings:
- Brick Size: The pip/point value for each brick (e.g., 5, 10, 20 pips)
- Calc Type: To use pips/points in the calculation
- Chart Type: Normal, Median, Geometric or Turbo
- Show Wicks: To show wicks on Renko Bars or not
- Days Back: How many days back worth of data we want to use to create custom bars
- Custom Extension and Reversal : Price movement in percentage for custom Renko bars
Performance with Smaller Ranges:
When using smaller brick sizes (2-5 pips):
- More bricks form, showing finer price detail
- Increased sensitivity to minor price movements
- Higher resource consumption
- Better for lower timeframe analysis
- More false signals in ranging markets
Best Use Cases:
- Trend identification
- Support/resistance levels
- Breakout strategies
- Noise reduction in analysis
4. Range Charts
What Are Range Charts?

Range Charts create a new bar when the price moves a specified range from the opening price of the current bar. Each bar represents the same price range movement.

Key Settings:
- Range Size: The price range in pips/points (e.g., 10, 20, 50)
- Calc Type: To use pips/points in the calculation
- Days Back: How many days back worth of data we want to use to create custom bars
Performance with Smaller Ranges:
With smaller range values (5-15 pips):
- More frequent bar creation
- Better visibility of micro price movements
- Increased computational load
- Useful for precise entry/exit points
- Can generate excessive bars in volatile conditions
Best Use Cases:
- Consistent price movement tracking
- Volatility normalization
- Pattern recognition
- Range-bound market trading
5. Line Break Charts
What Are Line Break Charts?

Line Break charts display a series of vertical lines based on price movements. A new line in the same direction forms when price exceeds the previous high/low. A reversal requires breaking multiple previous lines.

Key Settings:
- Number of Lines: How many lines must break for reversal (typically 3)
- Source TF : Source Timeframe
- Days Back: How many days back worth of data we want to use to create custom bars
Performance with Smaller Ranges:
When configured for higher sensitivity:
- More frequent line formations
- Earlier trend change signals
- Better short-term trend capturing
- Increased false reversal signals
- More processing requirements
Best Use Cases:
- Trend continuation/reversal identification
- Breakout confirmation
- Filter for range-bound markets
- Japanese candlestick alternatives
6. Heiken Ashi Charts
What Are Heiken Ashi Charts?

Heiken Ashi charts use modified candlestick calculations that average price data, creating smoother candles that better highlight trends and reduce market noise.

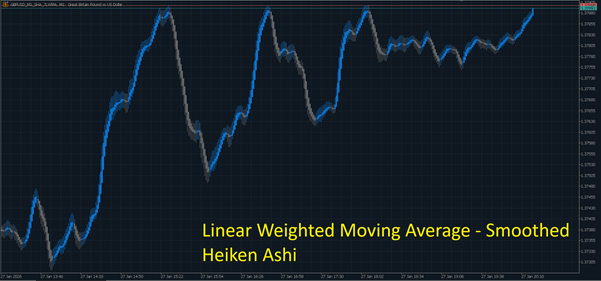
Key Settings:
- Timeframe: Base timeframe for calculations (M1, M5, H1, etc.)
- Smoothing Period: Additional moving average smoothing (optional)
- Type: Standard or Smoothed Heiken Ashi
- MA Period : The period to use for Smoothed Heiken Ashi
- Step Size : The step size for step Heiken Ashi
- Better Formula : Toggle to use better formula Heiken Ashi or not
- Days Back: How many days back worth of data we want to use to create custom bars
Performance with Smaller Ranges:
On lower timeframes (M1, M5):
- Smoother price action even on small timeframes
- Delayed signals due to averaging
- Reduced whipsaw trades
- Moderate resource usage
- Better trend visibility
Best Use Cases:
- Trend identification and following
- Reducing market noise
- Swing trading entries
- Stop loss placement guidance
Using the Control Panel Effectively
Adding New Charts
- Click the Add New button
- Select your desired chart type from the dropdown menu
- Configure the specific settings for that chart type
- Set your preferred symbol and timeframe
- Click "Create" to generate the chart


Managing Multiple Charts
Scrolling Through Charts:
- Use Scroll Up and Scroll Down to navigate through your list when you have multiple charts created
Opening Charts in Separate Windows:
- Select the chart(s) you want to view
- Click Open Charts to launch them in individual MT5 windows
- This allows multi-monitor setups and simultaneous viewing
Clearing Charts:
- Click Clear to remove all custom charts and start fresh
- This frees up system resources
Canceling Operations:
- Use Cancel if a chart is taking too long to generate
- Helpful when processing large historical datasets
- Stops the current operation immediately

Performance Optimization Tips
General Guidelines
- Start with moderate settings before going extremely granular
- Monitor CPU and RAM usage when running multiple custom charts
- Limit historical data loading for very small range charts
- Close unused charts to free resources
- Use on higher-spec computers for best performance with small ranges
Recommended Settings by Trading Style
Scalping:
- Second Charts: 15-30 seconds
- Tick Charts: 50-100 ticks
- Renko: 2-5 pip bricks
Day Trading:
- Second Charts: 1-2 minutes
- Range Charts: 10-20 pip range
- Heiken Ashi: M5-M15 timeframe
Swing Trading:
- Renko: 10-20 pip bricks
- Line Break: 3-line break on H1-H4
- Heiken Ashi: H1-D1 timeframe
Troubleshooting Common Issues
Charts Not Loading
- Verify sufficient historical data is available
Slow Performance
- Reduce the number of active charts
- Load the Expert on a different broker symbol from watchlist
- Increase the range/period settings
- Limit historical bars loaded
- Close other resource-intensive applications
Missing Data
- Confirm your broker provides tick data for the symbol
- Check your data center connection
- Refresh the chart or restart MT5
Conclusion
MT5 Ultra Charts unlocks powerful alternative charting capabilities that can enhance your technical analysis and trading strategies. By understanding each chart type's characteristics and performance implications, you can select the right tools for your trading style.
Start with moderate settings, experiment with different chart types, and gradually optimize based on your specific needs and system capabilities. The intuitive control panel makes managing multiple chart types simple and efficient.

Happy trading!


")