
EURUSD Technical Analysis 2016, 31.07 - 07.08: daily bearish breakout with possible bullish reversal
31 July 2016, 13:37

0
426
Daily price is located below Ichimoku cloud in the bearish area of the chart: the price is on secondary bear market rally to be started on Friday with 1.1191 resistance level to be crossed to above for the rally to be continuing. The price is located within the following key support/resistance levels:
- 1.1381 resistance level located above Ichimoku cloud in the beginning of the bullish trend, and
- 1.0911 support level located far below Ichimoku cloud in the bearish area of the chart.
Absolute Strength indicator is evaluating the breakout to be started.
If D1 price breaks 1.1381 resistance level on close bar from below to above so the bullish reversal will be started with 1.1427 level as a nearest daily target.
If not so the price will be on ranging bearish within the levels.
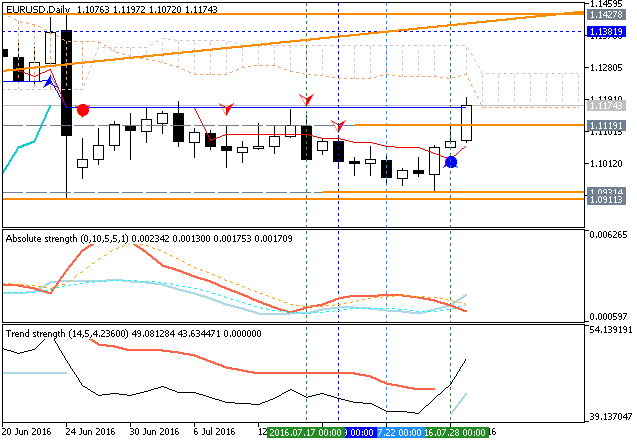
- Recommendation for long: watch close D1 price to break 1.1381 for possible buy trade
- Recommendation
to go short: watch D1 price to break 1.0911 support level for possible sell trade
- Trading Summary: bearish
| Resistance | Support |
|---|---|
| 1.1381 | 1.0911 |
| 1.1427 | N/A |
SUMMARY : breakout


")
