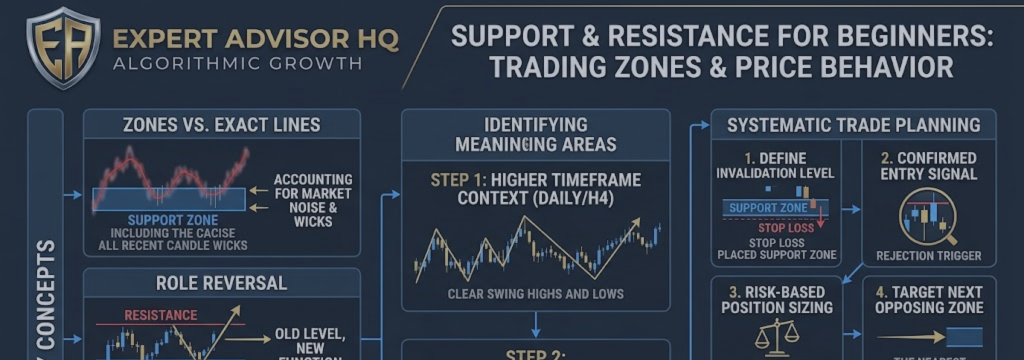

Support and resistance are two of the most widely used concepts in technical analysis. They describe areas on a price chart where the market has previously paused, reversed, accelerated, or attracted noticeable buying and selling interest.
They are useful because markets often react around visible historical price areas. However, support and resistance should not be treated as exact prices, guaranteed turning points, or automatic buy and sell signals.
A better way to think about them is as zones of interest. When price approaches one of these zones, a trader watches for evidence of rejection, continuation, consolidation, or a confirmed breakout.
This guide explains how to identify support and resistance, draw cleaner zones, understand price behavior around them, manage risk, and turn the concept into a repeatable trading process.
Risk warning: Support and resistance analysis is educational and does not predict market direction with certainty. Forex, CFDs, futures, stocks, cryptocurrencies, and other financial instruments involve substantial risk. Always test ideas before using real money and use risk levels appropriate for your account.
What You Will Learn
- What support and resistance mean.
- Why zones are more useful than exact horizontal lines.
- How to identify meaningful areas on a chart.
- How price can react at a support or resistance zone.
- How old support can become resistance and vice versa.
- How to use multiple timeframes without overcomplicating your chart.
- How to turn a visual chart idea into a testable rule.
- How to avoid common beginner mistakes.
What Is Support?
Support is an area below the current market price where buying interest has previously been strong enough to slow, pause, or reverse a price decline.
Traders often describe support as a “floor.” This is only a simple analogy. A floor in a building is fixed. Market support is not fixed. Price can pause above it, touch it, move slightly through it, break below it, or return to test it later.
Support may form near:
- A previous swing low.
- A price area where the market reversed higher several times.
- A consolidation range low.
- A previous breakout area.
- A major round number.
- A higher-timeframe low.
- A moving average or other dynamic reference point.
When price approaches support, it does not mean that price must rise. It means that traders may pay closer attention because buying interest has appeared there previously.
What Is Resistance?
Resistance is an area above the current market price where selling interest has previously been strong enough to slow, pause, or reverse a price advance.
Traders often describe resistance as a “ceiling.” Again, this is a simple analogy, not a guarantee. Price can reject below resistance, pause around it, break through it, or return later to test it from above.
Resistance may form near:
- A previous swing high.
- A price area where the market reversed lower several times.
- The upper boundary of a consolidation range.
- A previous breakdown area.
- A major round number.
- A higher-timeframe high.
- A dynamic reference point, such as a moving average in a downtrend.
When price approaches resistance, it does not automatically mean that price will fall. It means that the area may become important because selling pressure or profit-taking appeared there in the past.
Think in Zones, Not Exact Lines
One of the most important lessons for beginners is that support and resistance are usually zones rather than one exact price.
Price does not move with perfect precision. Spreads, liquidity, volatility, stop orders, profit-taking, and different broker price feeds can all cause price to react slightly above or below a visible level.
For this reason, it is often more useful to draw a shaded area or narrow rectangle than a single thin horizontal line.
For example, imagine that EURUSD created several lows between 1.0800 and 1.0810. Rather than claiming that 1.0805 is the only valid support price, treat the entire region as a possible support zone.
A chart zone should be:
- Wide enough to include normal price noise.
- Narrow enough to define where the trade idea becomes invalid.
- Based on visible historical reactions.
- Consistent with the timeframe being analyzed.
Technical-analysis educators commonly describe support and resistance as zones rather than precise price points because price may briefly move through a level before reacting. [105][110]
Why Support and Resistance Can Matter
Support and resistance areas may matter because many market participants can see them. Traders may place orders, take profits, close losing positions, or wait for confirmation around obvious swing highs, swing lows, range boundaries, and round numbers.
For example:
- Traders who bought near an earlier support area may defend or add near that zone.
- Traders who sold near a previous high may watch the same resistance area again.
- Traders with losing positions may exit when price returns to their entry price.
- Breakout traders may place orders beyond a visible range boundary.
- Traders taking profits may create selling pressure near a previous high or buying pressure near a previous low.
None of these behaviors are guaranteed. Support and resistance are frameworks for organizing market information, not proof that a specific group of traders will act in a particular way.
What Makes a Zone Useful?
A useful support or resistance zone is usually visible without forcing the chart. If you need to zoom in heavily, draw many lines, or explain why a barely visible reaction is important, the area may not be meaningful enough to prioritize.
Look for the following qualities.
Repeated Price Reactions
A zone may become more noticeable when price reacted there more than once. For example, a support area may have produced two or three separate bounces over time.
More touches do not guarantee that a zone will hold. In some situations, repeated testing can weaken a zone as orders are gradually absorbed. The important point is that repeated reactions can make an area more visible and worth monitoring.
Clear Swing Points
Start with obvious swing highs and swing lows. A swing high is an area where price rose, paused, and then moved lower. A swing low is an area where price fell, paused, and then moved higher.
These are often easier for beginners to identify than small intraday fluctuations.
Strong Departure From the Area
A zone can become more interesting when price left it with a clear directional move. For example, price may have paused in a narrow area and then moved sharply higher or lower.
A strong departure does not guarantee that price will react there again. It simply suggests that the area was associated with a meaningful imbalance or change in market behavior at that time.
Higher-Timeframe Relevance
Zones from higher timeframes often deserve more attention than small zones found only on very low timeframes.
For example:
- A weekly or daily zone may influence broad market structure.
- An H4 or H1 zone may be useful for swing or intraday planning.
- An M15 or M5 zone may be useful for detailed entry timing.
A zone visible on both the H4 chart and the M15 chart may be more useful than a level visible only on a very small timeframe. This does not mean it will hold, but it may provide stronger context.
Recent Relevance
Very old levels can remain important, especially on higher timeframes. However, recent and clearly visible areas often deserve priority because current traders are more likely to be watching recent market structure.
If your chart contains dozens of historical lines, remove or de-emphasize the areas that no longer matter. A clean chart usually leads to clearer decisions.
How to Draw Support and Resistance Zones
The following process is simple enough for beginners and structured enough to repeat consistently.
Step 1: Start With a Higher Timeframe
Open a higher-timeframe chart first, such as H4, Daily, or Weekly. Zoom out enough to see broad market structure and several months of price history.
Look for obvious areas where price:
- Changed direction.
- Paused before a major move.
- Formed repeated highs or lows.
- Created a visible range boundary.
Do not begin by marking every candle high and low. Focus on the most visible turning areas.
Step 2: Mark the Price Area, Not One Wick
Use a rectangle or shaded horizontal band instead of a single line. Include the cluster of candle bodies and wicks that represent the area where price reacted.
For a support zone, the upper edge may include candle closes or bodies, while the lower edge may include the deepest relevant wick. For resistance, the same idea applies in reverse.
There is no perfect drawing method. The goal is consistency. Choose one method, document it, and use it the same way during testing.
Step 3: Move to a Lower Timeframe
After drawing important higher-timeframe zones, move to a lower timeframe for more detail.
For example:
- Draw major zones on H4.
- Use H1 to evaluate price behavior near the zone.
- Use M15 to look for a defined entry trigger.
This is called multi-timeframe analysis. It allows the trader to use a larger market context while still defining a practical entry and stop-loss location.
Step 4: Limit the Number of Zones
Too many zones create confusion. If every price area is labeled support or resistance, none of them are useful.
For a beginner, it can be helpful to mark only:
- The nearest major support below current price.
- The nearest major resistance above current price.
- One or two higher-timeframe zones beyond those areas.
Then update the chart when structure changes.
Three Common Price Reactions
When price reaches a support or resistance zone, three broad outcomes are common: rejection, breakout, or consolidation.
1. Rejection
Rejection occurs when price enters or approaches a zone but then moves away from it.
At support, rejection may appear as price moving into the zone and then closing higher. At resistance, rejection may appear as price moving into the zone and then closing lower.
Some traders watch for clues such as:
- Long wicks showing a failed move beyond the zone.
- A strong candle close back inside the previous range.
- A reversal pattern.
- A lower-timeframe change in structure.
- Reduced downside or upside momentum near the zone.
A wick alone is not a complete trading strategy. A wick may show rejection, but it may also be part of normal price movement before a later breakout. Define your confirmation and risk rules before entering a trade.
2. Breakout
A breakout occurs when price moves through a support or resistance zone and continues beyond it.
A potential bullish breakout occurs when price moves above resistance. A potential bearish breakout occurs when price moves below support.
Many traders prefer to see more than a brief wick through a zone. They may wait for:
- A candle close beyond the zone.
- Follow-through movement after the close.
- A retest of the broken zone from the other side.
- A change in market structure.
- Confirmation from volatility, volume, or other filters where available.
A breakout can fail. Price may move beyond a zone briefly and then return inside the previous range. This is why every breakout strategy needs a clear invalidation level and position-size calculation.
3. Consolidation
Consolidation occurs when price pauses and trades back and forth around a zone. Instead of rejecting or breaking immediately, the market may form a range, compress volatility, or wait for new information.
Consolidation is important because it can signal uncertainty. A trader may decide to wait until price clearly breaks the range or until a defined rejection setup occurs.
Waiting is a valid trading decision. You do not need to trade every time price reaches support or resistance.
Support and Resistance Role Reversal
One useful concept is role reversal:
- Old resistance may become support after price breaks above it and later retests it.
- Old support may become resistance after price breaks below it and later retests it.
For example, imagine that price repeatedly fails near a resistance zone. Eventually, price closes above the zone and continues higher. If price later returns to that area and buyers appear, the old resistance zone may now act as support.
This is often called a breakout and retest pattern. It can provide a structured way to think about market behavior, but it is not a guarantee.
A practical rule might require price to:
- Close clearly beyond the original zone.
- Return toward the broken zone.
- Show a defined rejection or confirmation signal.
- Provide enough room to the next opposing zone for the trade to make sense.
Role reversal is a useful framework because it helps traders avoid assuming that every broken level is irrelevant. Once a zone breaks, it may still matter from the opposite side. [106][109]
Using Support and Resistance for Trade Planning
Support and resistance are most useful when they help you define a complete trade plan. A complete plan includes entry conditions, stop-loss placement, profit target logic, position size, and a reason to avoid the trade if conditions are poor.
Planning a Rejection Trade
A rejection-based idea may follow this general structure:
- Identify a higher-timeframe support or resistance zone.
- Wait for price to enter or approach the zone.
- Require a clearly defined confirmation signal.
- Place the stop loss beyond the zone, where the idea is invalidated.
- Set a target before entering, often near the next important opposing zone.
- Calculate position size from the stop-loss distance and chosen account risk.
For a support rejection, a trader may look for evidence that buyers are responding. For a resistance rejection, a trader may look for evidence that sellers are responding.
The important point is that “buy support” or “sell resistance” is not enough by itself. You need rules for confirmation and risk.
Planning a Breakout Trade
A breakout-based idea may follow this general structure:
- Identify a clearly defined support or resistance zone.
- Wait for price to close beyond the zone.
- Decide whether the strategy enters immediately or waits for a retest.
- Define where the breakout is considered invalid.
- Place a stop loss based on that invalidation point.
- Check whether there is enough room before the next major zone.
- Use appropriate position sizing.
Breakouts often look attractive because they can capture strong directional moves. They can also produce false signals, especially during low liquidity, news events, or choppy market conditions.
Stop Loss Placement Around Zones
Support and resistance can help define where a trade idea becomes invalid. This is more useful than choosing a stop-loss distance randomly.
For example:
- If buying from support, the trade idea may be invalid if price closes or moves decisively below the support zone.
- If selling from resistance, the trade idea may be invalid if price closes or moves decisively above the resistance zone.
- If buying a breakout, the trade idea may be invalid if price returns below the breakout zone.
- If selling a breakdown, the trade idea may be invalid if price returns above the broken support zone.
Do not place stops exactly on an obvious line without considering spread and normal price movement. A stop placed too close to the zone may be triggered by ordinary volatility even if the broader idea was reasonable.
At the same time, a wider stop loss does not make a trade safer unless position size is reduced accordingly.
Position Size Must Match Zone Width
Support and resistance zones can vary in width. A wider zone may require a wider stop loss. If the stop loss is wider, the trade volume should normally be smaller if you want to keep the same account risk.
For example, imagine two possible trades:
- Trade A has a 20-point stop loss.
- Trade B has a 60-point stop loss.
If both trades use the same lot size, Trade B exposes the account to roughly three times more price risk. A risk-based position-sizing method adjusts the volume so that both trades risk a similar amount of account equity.
Before entering any trade, know:
- Your entry price.
- Your stop-loss price.
- Your position size.
- Your maximum monetary risk.
- Your target or exit plan.
- The next opposing support or resistance zone.
Multiple Timeframes Without Confusion
Multiple timeframes can improve context, but too many timeframes can create conflicting signals and indecision.
A simple structure for beginners is:
| Purpose | Example Timeframe | What to Look For |
|---|---|---|
| Market context | Daily or H4 | Major swing highs, swing lows, broader trend, and important zones. |
| Trade setup | H1 or M15 | Price approaching the planned zone and potential confirmation. |
| Entry timing | M15 or M5 | A defined trigger, such as a close, rejection pattern, or structure change. |
The exact timeframes are not important. What matters is using the same process repeatedly.
For example, if you identify support on H4, do not let a small M1 candle convince you that the H4 zone no longer matters. Likewise, do not use a higher-timeframe zone as an excuse to ignore a clearly invalidated lower-timeframe trade.
Turn a Visual Idea Into a Testable Rule
Support and resistance become more useful when you can describe them objectively.
Consider these two statements:
“Buy when price looks strong at support.”
This is vague. Different traders may interpret “strong” and “support” in completely different ways.
“On H1, define support as a zone created by at least two swing lows within 15 points. Buy only if price enters the zone and an M15 candle closes above the high of the previous M15 candle. Place the stop 10 points below the zone. Risk 0.5% of equity. Do not trade during the specified news window.”
This rule may not be profitable, but it is testable. Another person can apply the same instructions to historical charts and determine whether the setup occurred.
To create a testable support-and-resistance strategy, define:
- The timeframe used to identify zones.
- How swing highs and swing lows are identified.
- How many touches or reactions are required.
- How wide the zone should be.
- What counts as a rejection.
- What counts as a valid breakout.
- Whether a retest is required.
- Where the stop loss belongs.
- How position size is calculated.
- Where the target is placed or how exits are managed.
- Which sessions, spreads, or news conditions block a trade.
If two people can apply your rules to the same chart and produce completely different trades, refine the rules before risking money or attempting automation.
Support and Resistance in an EA
Support and resistance can be included in an Expert Advisor, but the visual concept must first be translated into objective conditions.
An EA cannot simply “see a strong level” unless the developer defines what that means mathematically.
Possible EA definitions may use:
- Recent highest highs and lowest lows.
- Fractal swing points.
- Pivot points.
- Range highs and lows.
- Repeated price touches within a specified distance.
- ATR-based zone width.
- Higher-timeframe swing levels.
- Volume or volatility filters where data is available.
For example, an EA could define resistance as the highest high of the previous 50 H1 candles, then wait for an H1 close above that high before checking additional filters.
This does not mean the EA understands market context in the same way as a human trader. It means the EA applies one repeatable definition. That definition should be backtested, forward-tested, and reviewed under realistic spread and execution assumptions.
Common Beginner Mistakes
Drawing Too Many Levels
When every small high and low becomes a zone, the chart becomes too crowded to use. Start with major, obvious areas and add detail only when it improves your plan.
Treating a Zone as a Guaranteed Reversal
Support can break. Resistance can break. A historical reaction does not guarantee a future reaction.
Always define where your idea is invalid and use appropriate position size.
Entering Before Confirmation
Price reaching a zone is not always enough to justify a trade. Waiting for confirmation can reduce the number of trades, but it may improve consistency by ensuring that your entry rule is clear.
Ignoring the Next Opposing Zone
Before entering a trade, check where the next major support or resistance area is located. If there is very little room between entry and the next opposing zone, the potential reward may not justify the risk.
Ignoring the Trend and Market Condition
Support and resistance can be used in trends, ranges, and breakouts, but the market context matters. Buying support repeatedly in a strong downtrend or selling resistance repeatedly in a strong uptrend can carry greater risk.
Consider using a broader trend filter, volatility filter, or market-structure rule as part of your trading plan.
Changing Rules After Every Trade
A losing trade does not prove that a zone was drawn incorrectly. A winning trade does not prove that a method is reliable.
Record enough examples to evaluate the process. Keep screenshots of valid setups, invalid setups, winners, losers, breakouts, false breakouts, and missed trades. A visual trading journal can improve consistency more than constantly adding indicators.
A Simple Practice Exercise
Use this exercise on a demo chart before trying to trade support and resistance with real money.
- Open one currency pair on the H4 chart.
- Zoom out until you can see several months of price history.
- Mark only the two most obvious support zones and two most obvious resistance zones.
- Move to the H1 chart and observe how price behaves when it approaches those areas.
- Take screenshots of rejection, breakout, retest, and consolidation examples.
- Write down what you would need to see before entering a trade.
- Repeat the exercise on at least 20 historical examples.
- Review whether your definitions were consistent from one example to the next.
The purpose is not to prove that every zone works. The purpose is to develop a clear, repeatable process for observing price behavior.
Frequently Asked Questions
How many times must price touch a level before it becomes support or resistance?
There is no universal number. Two or more clear reactions can make an area worth watching, but the quality of the reaction, the timeframe, the strength of the departure, and the current market context also matter.
Are support and resistance lines better than zones?
Lines can be useful as reference points, but zones are often more realistic because market price does not react with perfect precision. A zone helps account for wicks, spread, volatility, and normal price variation.
Can support become resistance?
Yes. If price breaks below a support zone and later returns to it from below, the old support may act as resistance. The reverse can occur after price breaks above resistance.
Should I buy every time price touches support?
No. Support is an area of interest, not an automatic entry signal. Wait for your own defined confirmation, check the broader market context, and use risk control.
What is the best timeframe for support and resistance?
Higher timeframes usually provide broader context, while lower timeframes can provide more detailed entry timing. Many traders begin by identifying zones on H4 or Daily and then use H1 or M15 for a more precise setup.
Can support and resistance be automated in an Expert Advisor?
Yes, but the rules must be objective. The developer must define exactly how the EA identifies swing points, zone width, touches, confirmation, stop placement, and trade management.
Final Thoughts
Support and resistance are not magic lines. They are a practical way to identify historical areas where price behavior changed and where traders may pay attention again.
The best use of support and resistance is not predicting every reversal. It is creating a structured plan: identify the zone, wait for evidence, define invalidation, control risk, and review results over many examples.
Risk disclosure: This article is for educational purposes only and does not constitute investment advice, a recommendation, or a guarantee of results. Trading forex, CFDs, futures, stocks, cryptocurrencies, and other financial instruments involves substantial risk. Past market behavior does not guarantee future price movement.