

USD/JPY, EUR/SEK, 1H Chart: Channel Up
EUR/SEK 1H Chart: Channel Up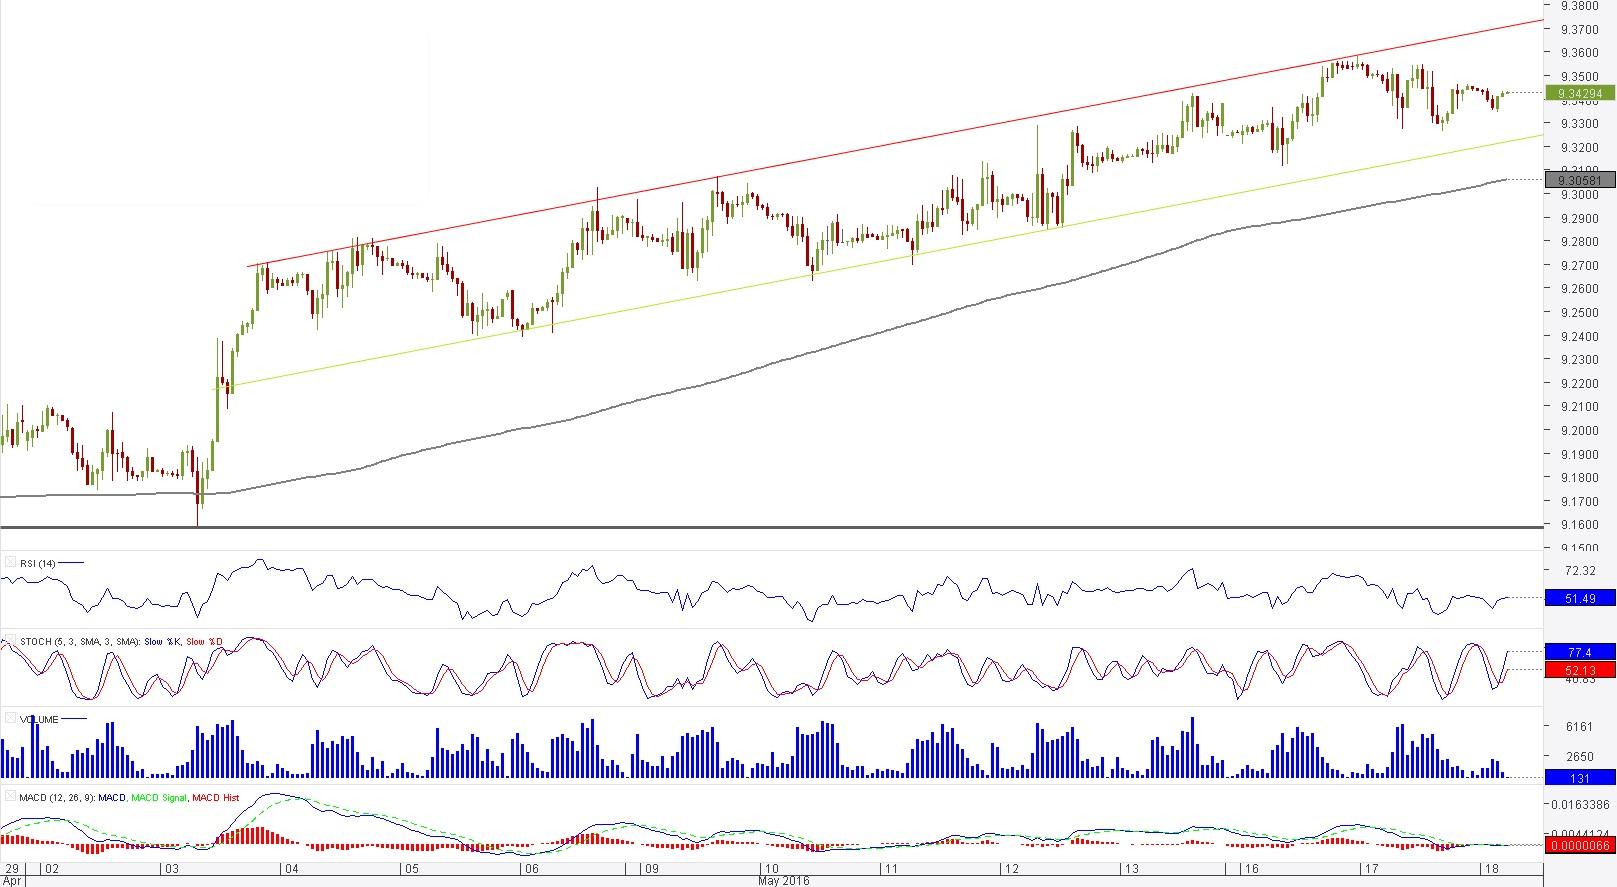
Comment: EUR/SEK formed the channel soon after a test of 9.16—a major demand area that was established a year ago and repeatedly confirmed thereafter. Right now, the currency pair is completing a bearish correction within the pattern, and thus it should soon rebound. The price is expected to bounce off of 9.3220 and rally through the May 16 high at 9.3580 towards the upper boundary of the channel at 9.3743. Alternatively, should the exchange rate slip under 9.3220, the focus will shift to 9.3144/20—another strong support area, where the weekly pivot point is joined by the May 16 low. More buying in case of a decline is likely to be observed at 9.3057, namely near the 200-hour SMA.

Comment: Considering the pattern emerging in the one-hour chart of USD/JPY and the fact that the price is trading above its long-term moving average, the outlook on the currency pair is moderately bullish. The US Dollar is expected to extend the recovery from the green trend-line up to the upper boundary of the channel at 109.80. Appreciation of the Greenback in the long run, however, seems less likely. First, the technical indicators are either mixed or neutral. Second, the Dollar is overbought—as many as 71% of open in the SWFX market positions are already long. If the price fails to hold above 108.50/40, it will be expected to take a long fall down to the May 6 low at 106.40.
![]()


