Analysis GBP/USD - FXStreet

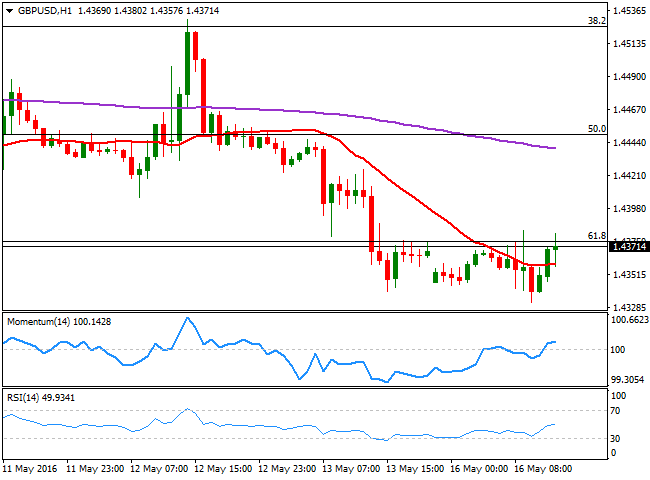
The GBP/USD pair consolidates its Friday's losses, having extended its monthly decline to 1.4332 after failing to regain 1.4375, the 61.8% retracement of the latest bullish run and the immediate resistance. With no data coming from the UK, attention will center now in US stocks, which will determinate market's sentiment. In the meantime, and according to the 1 hour chart, the downside is favored, given that in the 1 hour chart, the price is above a flat 20 SMA, whilst the technical indicators have turned flat above their mid-lines, helping, at least, to keep the downside limited. In the 4 hours chart, the price is below its 20 SMA and 200 EMA, both in the 1.4400/10 region, while the technical indicators have barely corrected oversold readings, but remain well below their mid-lines, also maintaining the upside limited.
Support levels: 1.4320 1.4285 1.4250
Resistance levels: 1.4375 1.4410 1.4440


