Technical Analysis of USD/JPY for May 05, 2013

USD/JPY is expected to trade in a higher range as the bias remains bullish. Overnight US stock indices continued to drift lower, weighed down by reignited concerns over global growth and weaker-than-expected ADP private payrolls data. The Dow Jones Industrial Average declined 0.6% to 17651, the S&P 500 dropped 0.6% to 2051, and the Nasdaq Composite was down 0.8% to 4725. Biotech was among the worst-performing sectors.
Nymex crude oil added 0.3% to $43.78 a barrel, gold fell another 0.5% to $1,279 an ounce, and the benchmark 10-year Treasury yield eased to 1.786% from 1.800% in the previous session.
The ADP jobs report showed that private firms in the US hired 156,000 workers in April (vs +195,000 expected, +194,000 in March), the lowest level in 3 years.
On the forex front, the US dollar extended its rally against other major currencies, with the Wall Street Journal Dollar Index rising 0.4% to 85.70. USD/JPY re-took the 107.00 level by climbing 0.4%, EUR/USD edged down 0.1% to 1.1485, and GBP/USD was down another 0.3% to 1.4491.
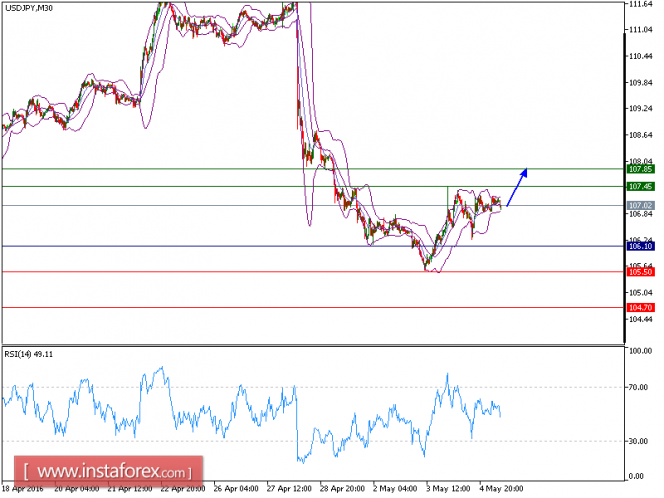
The Canadian dollar posted another steep dive against the greenback as Canada's merchandise trade deficit was reported to have widened to C$3.4B in March from C$2.5B in February. USD/CAD surged 1.2% to 1.2867.The pair has recovered from yesterday's consolidation, which brought it down to 106.22 (still above the key resistance at 106.10). Currently the pair is trading above the 20-period moving average, while being supported by the 50-period one. And the intraday relative strength index stays above the neutrality level of 50 lacking downward momentum. The intraday outlook continues to be bullish, and the pair should return to the first upside target at 107.45 (a key resistance seen on April 29).
Trading Recommendation:
The pair is trading above its pivot point. It is likely to trade in a wider range as long as it remains above its pivot point. Therefore, long positions are recommended with the first target at 107.45 and the second one at 107.85. In the alternative scenario, short positions are recommended with the first target at 105.50 if the price moves below its pivot points. A break of this target is likely to push the pair further downwards, and one may expect the second target at 104.70. The pivot point is at 106.10.
Resistance levels: 107.45, 107.85, 108.75
Support levels: 105.50, 104.70, 104
The material has been provided by 


