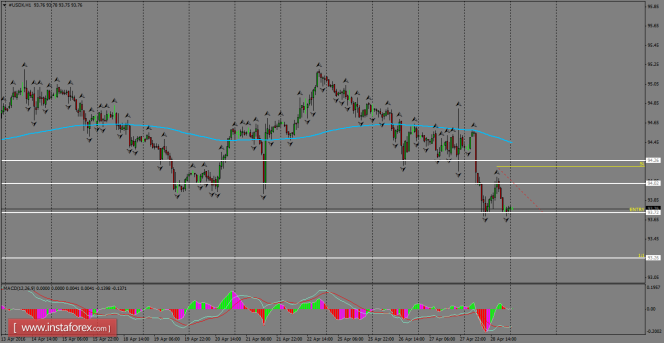
Daily Analysis of USDX for April 29, 2016
USDX is developing a very clear bearish structure below the 200 SMA after it found dynamic resistance around that level. Currently, the Index is forming a lower low pattern above the support level of 93.72, which should be broken to open the doors for a decline toward the 93.26 level. Fractals are also favoring more downside in coming days.

H1 chart's resistance levels: 94.02 / 94.26
H1 chart's support levels: 93.72 / 93.26
Trading recommendations for today:
Based on the H1 chart, place buy (long) orders only if the USD Index breaks with a bullish candlestick; the resistance level is at 93.72, take profit is at 93.26, and stop loss is at 94.20.
The material has been provided by InstaForex Company - www.instaforex.com


