Brent: Indicators Give Sell Signals
The price of crude oil Brent has dropped since the beginning of today’s trading session. The decline was caused by the API data on the rise in oil reserves in the USA and by the news that the strike of oil workers in Kuwait has finished.
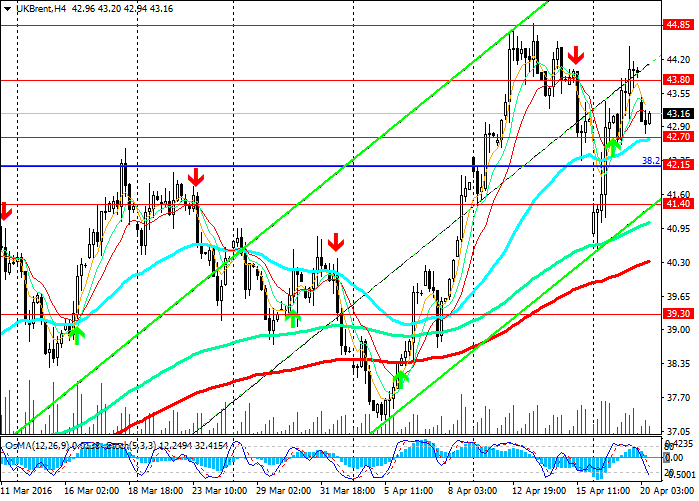
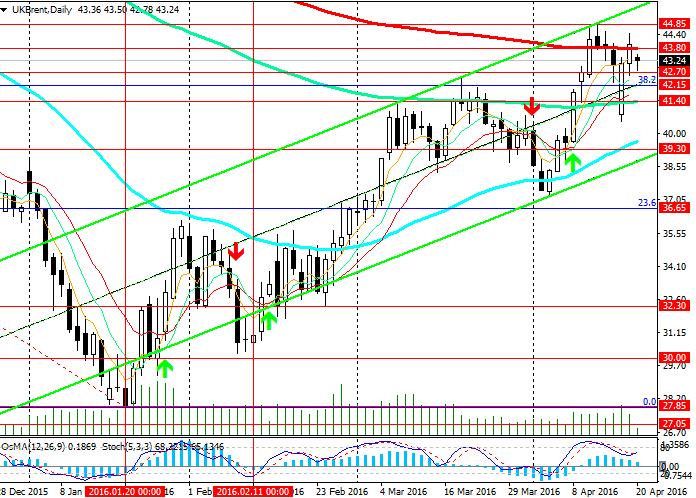
On the daily chart the price has broken down the key level of 43.80 (ЕМА200). On 4-hour chart the indicators OsMA and Stochastic give signals to sell. The price has dropped to support level of 42.70 (ЕМА50).
However, downtrend may resume only if the price consolidates below support levels of 42.70, 42.15 (Fibonacci 38.2% to the decline since June 2015) and 41.40 (ЕМА144 on the daily chart).
In case of breakout of the level of 41.40 (ЕМА144 on the daily chart), the price will go to 39.30 (ЕМА50 and lower line of the ascending channel on the daily chart) and 36.65 (Fibonacci 23.6%) and to the lows of the year at the levels of 27.00 – 30.00 USD a barrel.
As an alternative scenario the price can rise after breakout of the levels of 43.80 (ЕМА200 on the daily chart), 44.85 (highs of the year). The rise may continue up to 46.55 (Fibonacci 50% and ЕМА50 on the daily chart).
Support levels: 42.70, 42.15, 41.40, 41.00, 40.00, 39.30 and 36.65.
Resistance levels: 43.80, 44.00, 44.85, 45.00, 46.00 and 46.55.

Trading tips
Sell Stop: 42.50. Stop-Loss: 43.10. Take-Profit: 42.15, 41.40, 41.00, 39.30, 38.85 and 36.65.
Buy Stop: 43.30. Stop-Loss: 42.60. Take-Profit: 43.80, 44.85, 45.00, 46.00 and 46.55.


