
FTSE 100 Index Long-Term Technical Analysis: watch for key levels to be broken for direction
1 December 2015, 18:11

0
1 018
The price is located near 200 period SMA (200 SMA) on the border between the primary bearish and the primary bullish trend on the chart within the following support/resistance levels:
- 6463 resistance level located between 100 SMA and 200 SMA on the ranging area of the chart, and
- 5758 support level located below 100 SMA/200 SMA in the primary bearish area of the chart.
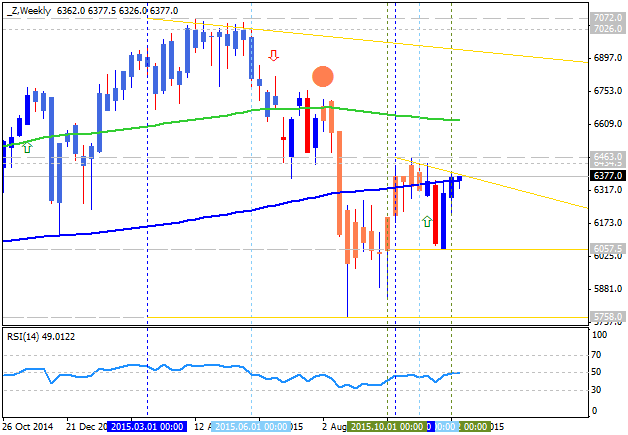
RSI indicator is estimating the secondary ranging market condition.

- If the price will break 6463
resistance level so the bullish reversal will be started.
- if price will break 5758 support so the primary bearish market condition will be continuing.
- if not so the price will be ranging within the levels.
| Resistance | Support |
|---|---|
| 6463 | 6057 |
| 7026 | 5758 |
| 7072 | N/A |


 & AMD Framework")
")