

This indicator allows a view of how the market will behave in the future if current market conditions continue, making future extrapolate the recent past of the analyzed asset.
This indicator would be considered a visual aid, since allowing us is to have an idea of how the market should continue and help to take appropriate operational decisions, knowing that if the market would continue in the same dynamic. Knowing whether our operational decision goes in favor of the market or against the market.
In the following video you can see information indicator:
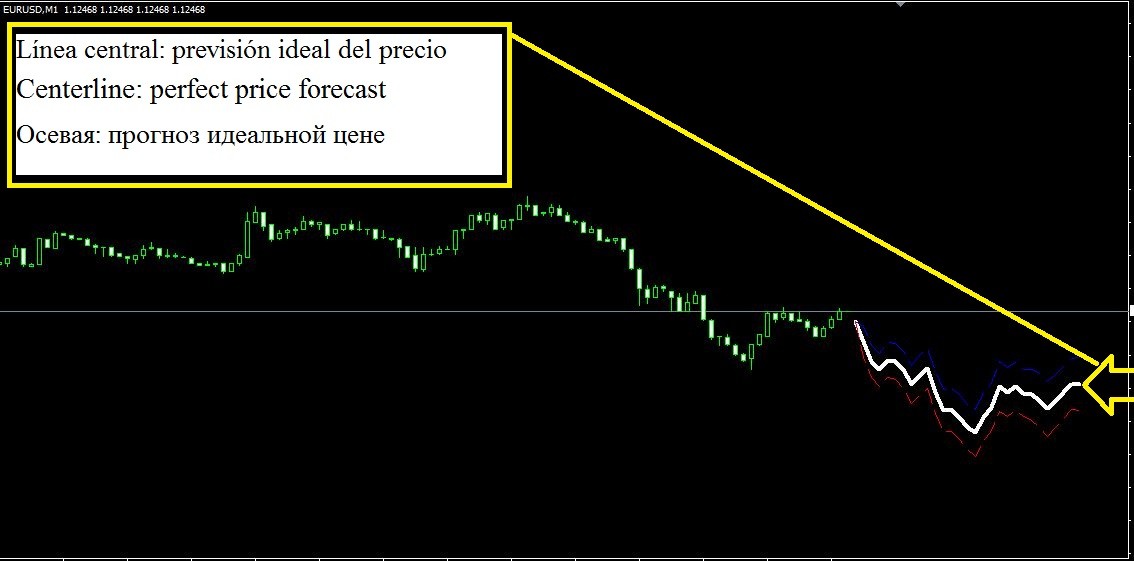
The following pictures of the indicator, the three lines that compose it are observed and they are drawn beyond the price simulating an imaginary line that would project the price within 30 periods a moment?
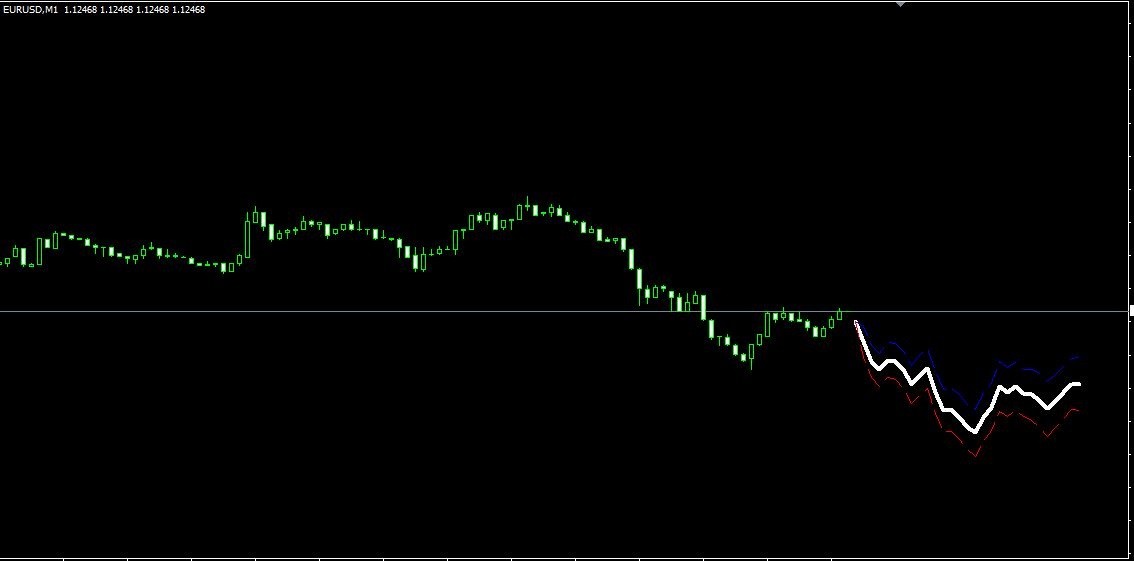
Below we will explain the meaning of the three lines drawn on the chart indicator.
The center line marks the price situation in the near future if market conditions precedent were maintained, ie the exact extrapolation to future price. This line would show the price situation in the next 30 candles if the price continue the current momentum. Since the price obviously going to have some variability, we need to give a range that defines us a probability zone within which the price would be found, the width of this area depend on the past, so the more wide for it this area less reliable the prediction, contrary to the closer it is this area will be more reliable prediction.
The top line
shows the calculated deviation of the line above the ideal price, we
mark a range of high probability of price maintenance in the upper
range, if the price continues to maintain market preconditions. The
distance between this line and the ideal line varies over time.
On, the closer is this contrast more reliable the prediction area.

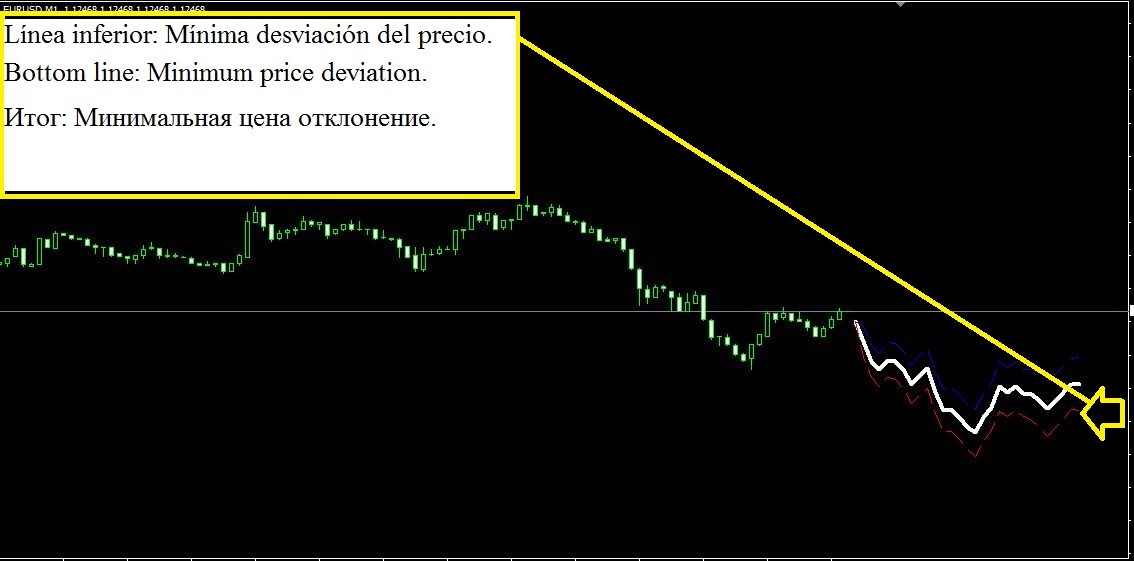
The bottom line shows the calculated deviation of the line below the ideal price, we mark a range of high probability of price support within the lower range, if the price continues to maintain market preconditions. The distance between this line and the center is not constant and depends on market conditions.
We will then review different market situations that we see with this indicator:
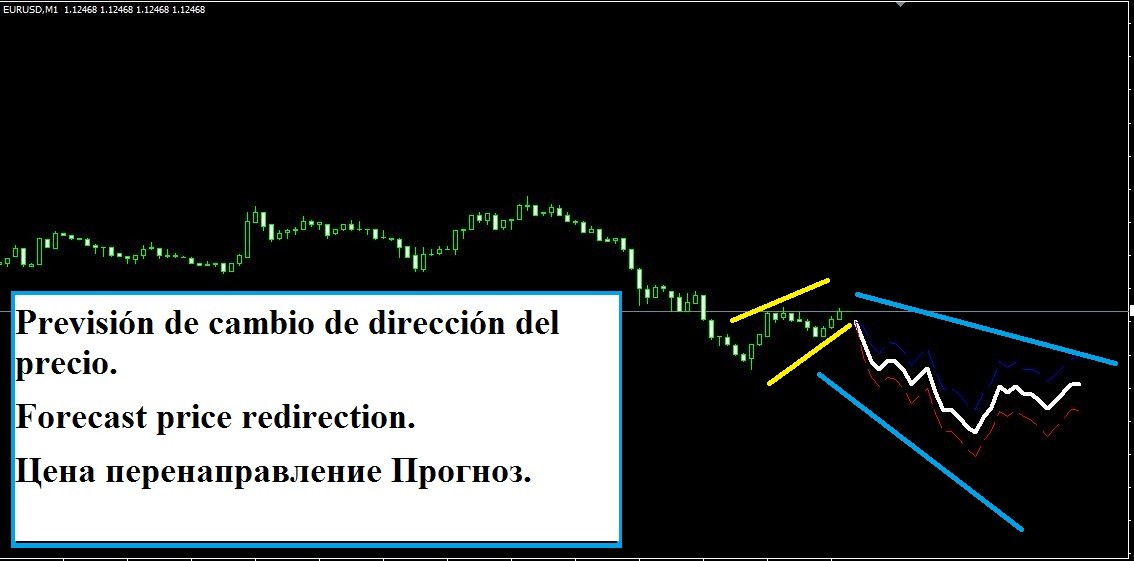
In
the following graph we see as we mark a turnaround in an upward
correction mark subtendencia us to return to the upper trend here is
bearish.
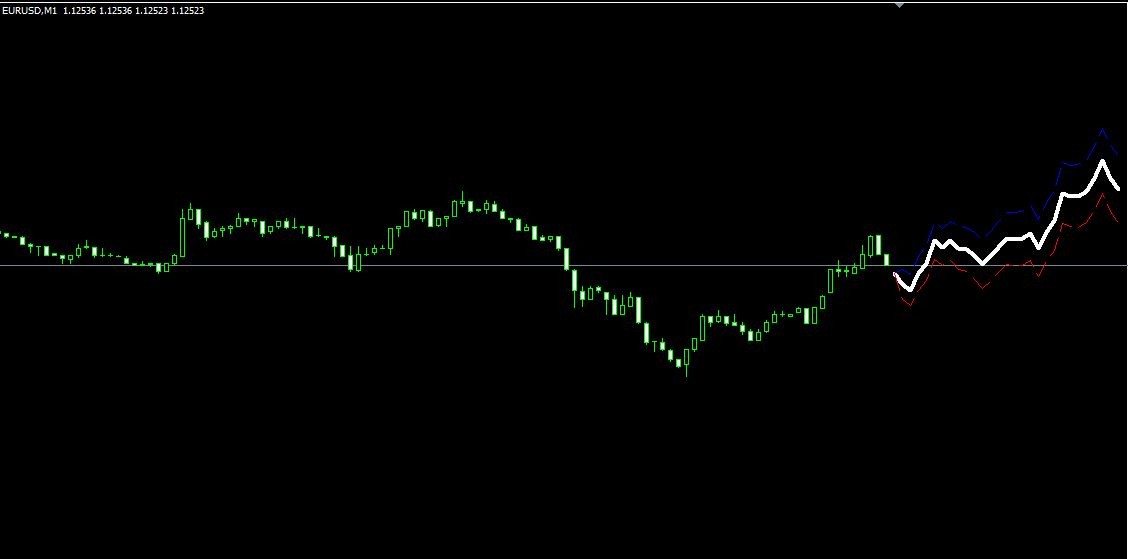
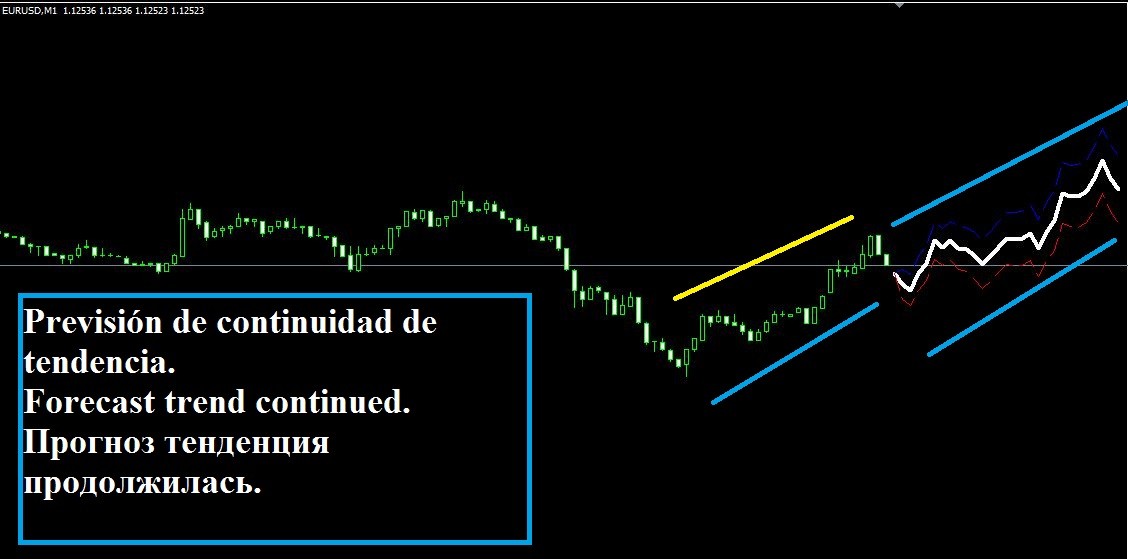
In the following example we see how the indicator marks a continuity in the underlying trend set by the market.
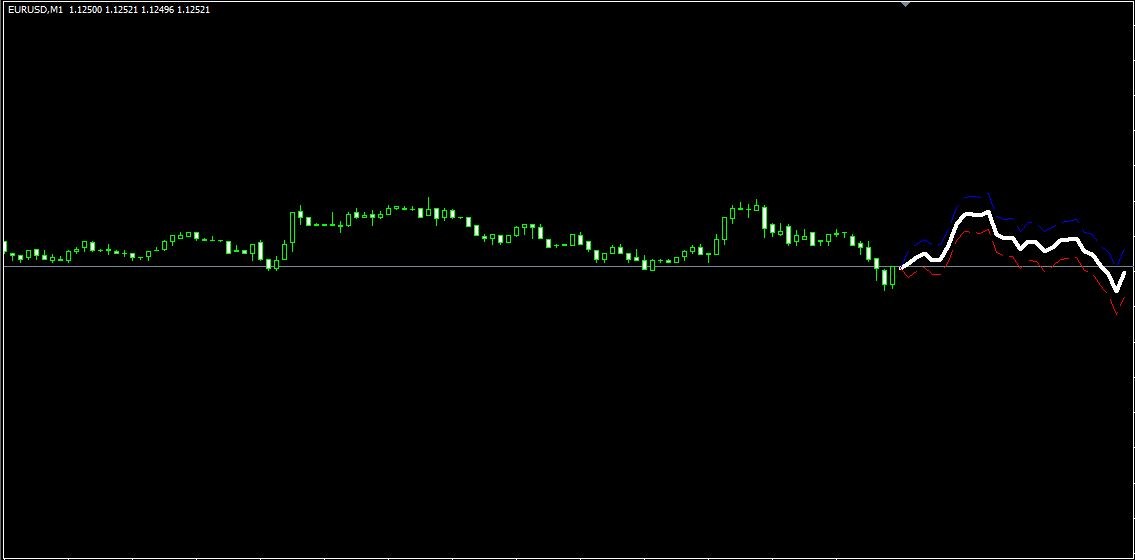
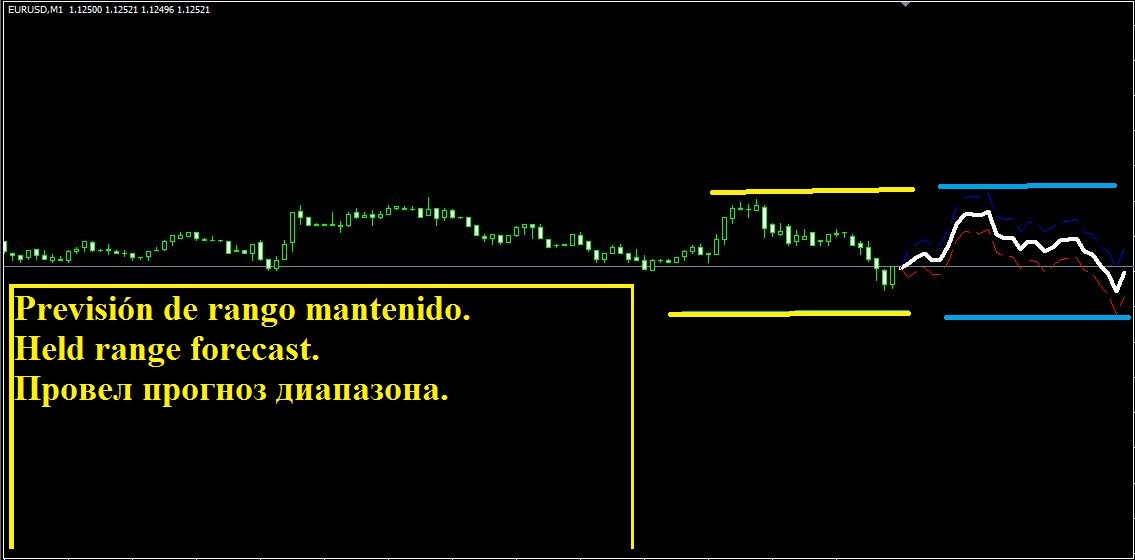
In the following example we mark as the market remains in a range.
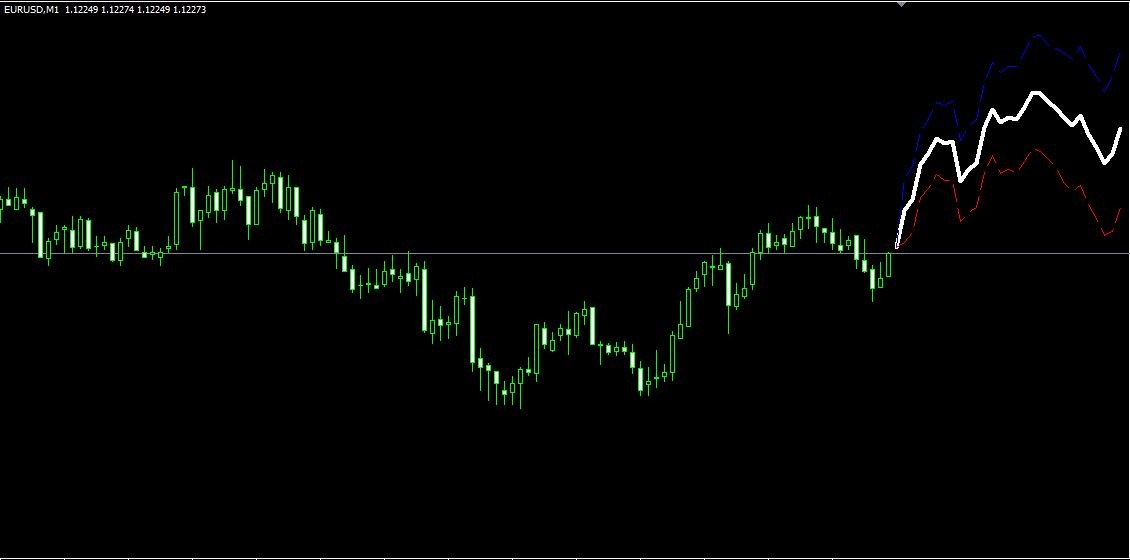
Finally we see how the indicator marks the end of the correction and the continuity of the previous bull market.

The indicator has not configurable external parameters, and analyzing the market and decided according to the parameters analyzed that apply to your configuration algorithm.
If the three lines are
configurable in terms grosos and color to suit the user and to be more
visible if the user decides to change the colors of the chart.
If you have any questions or comments about this indicator do not hesitate to contact me.
Un saludor


")
![[XAUUSD]: Weekly Liquidity Activation Points (timings), June 22-26, 2026](https://c.mql5.com/6/1013/splash-preview-771790.png "[XAUUSD]: Weekly Liquidity Activation Points (timings), June 22-26, 2026")
")