
GBPUSD Price Action Analysis - the price broke trendline together with 38.2% Fibo level at 1.5337 on close weekly bar for downtrend
8 June 2015, 12:11

1
840
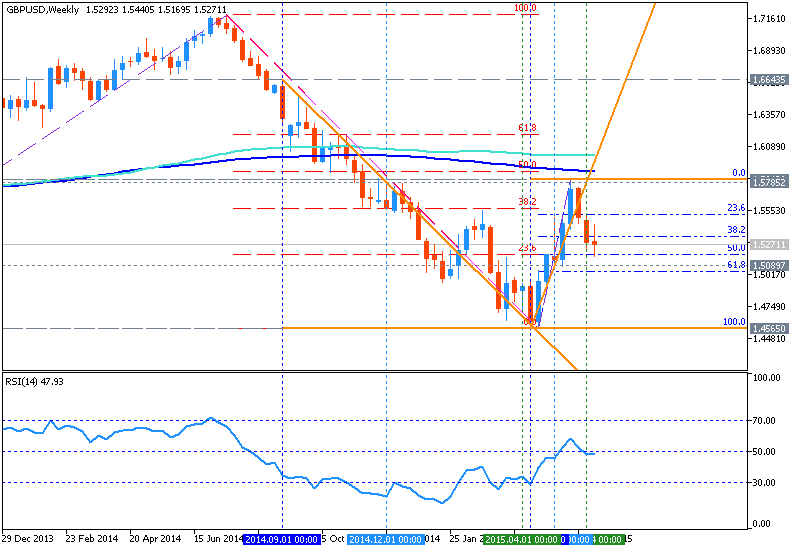
W1 price is on primary bearish with secondary ranging market condition: 200 period SMA and 100 period SMA are located above the price for bearish and moving in almost horizontal way for ranging between 1.4550 support level and 1.5819 resistance level:
- The price is ranging between between 1.4550 and 1.5819 at Fibo levels;
- The price broke trendline together with 38.2% Fibo level at 1.5337 on close weekly bar for downtrend and stopped near 50.0% Fibo level trying to cross it from above to below for the downtrend to be continuing;
- Weekly price is crossing 50.0% Fibo level at 1.5188, and if it happenes so the primary bearish trend will be continuing;
- “Keep the 50% decline from the 2014 high / Oct low at 1.5874/78 in mind for a top if reached. Weakness below 1.5390 would open up 1.5190 and 1.5090.”
- “GBPUSD ended up finding top at 1.5814 in May. The decline found support near the mentioned 1.5190. The failure at slope resistance raises the specter of continued long term weakness. If a larger decline is underway then expect to see resistance from 1.5490 to 1.5570.”
Trend:
- H4 - ranging
- D1 - ranging
- W1 - ranging bearish
- MN1 - ranging bearish


![[XAUUSD]: Weekly Liquidity Activation Points (timings), June 29 - July 3, 2026](https://c.mql5.com/6/1014/splash-preview-772062.png "[XAUUSD]: Weekly Liquidity Activation Points (timings), June 29 - July 3, 2026")
