
EURUSD Technical Analysis 2015, May: Bearish with Weekly Rally and Monthly Ranging with 1.0461 Key Support Level

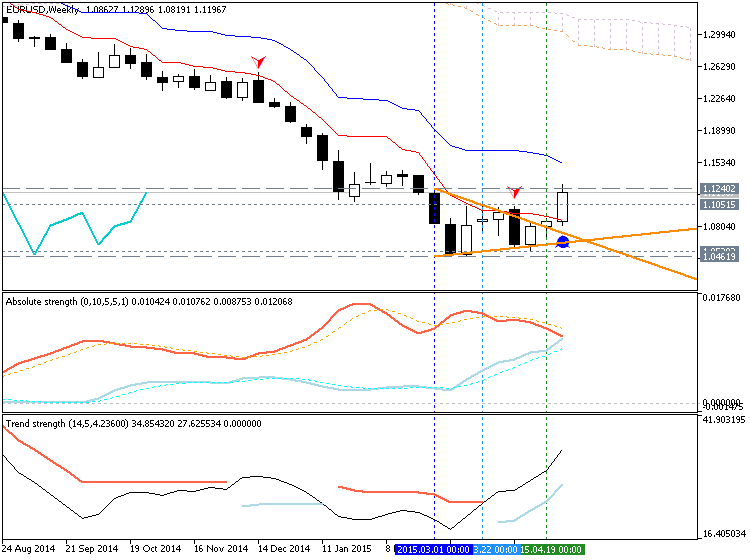
W1 price is is located on the primary bearish with the market rally and 1.1240 resistance level for trying to be broken on open W1 bar for now:
- Ichimoku cloud/kumo with Senkou Span A line (which is the virtual border between the primary bullish and the
primary
bearish on the chart) are above the price and too far from it for any
possible reversal of the price movement from the primary bearish to the
bullish market condition in May 2015.
- Tenkan-sen line is below Kijun-sen line of Ichimoku which is indicating the primary bearish.
- The price is ranging between 1.1240 resistance and 1.0461 support level
- The
local uptrend as the secondary market rally is going to be started: the
triangle pattern was broken by the price from below to above with 1.1240 resistance level for trying to be crossed on open W1 bar.
- Chinkou Span line is below the price and showing the local uptrend by the direction
- Nearest support levels are 1.0520 (W1) and 1.0461 (W1)
- Nearest resistance levels are 1.1051 (W1) and 1.1240 (W1)
If W1 price will break 1.1240 resistance level so we may see the local uptrend as the secondary market rally to be started
If not so the price will be ranging between 1.0461 and 1.1240 levels with primary bearish
- Recommendation for long: watch close W1 price to break 1.1240 for possible buy trade
- Recommendation
to go short: watch W1 price to break 1.0461 support level for possible sell trade
- Trading Summary: ranging
| Resistance | Support |
|---|---|
| 1.1051 (W1) | 1.0520 (W1) |
| 1.1240 (W1) | 1.0461 (W1) |
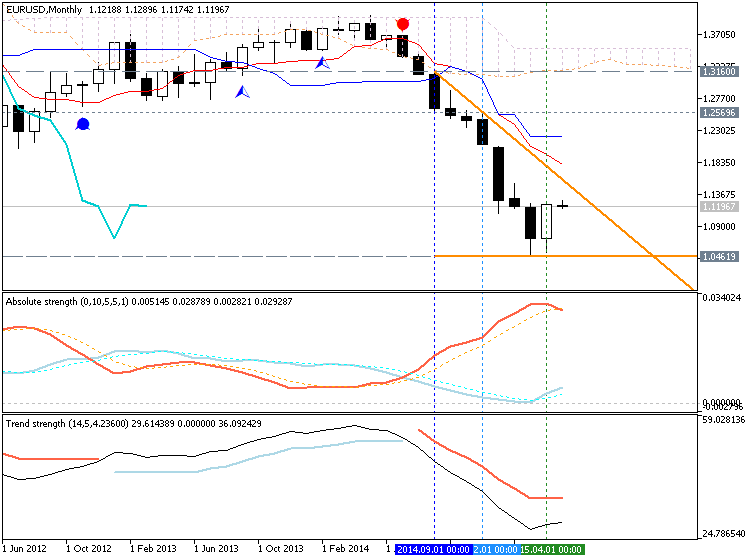
MN price is on primary bearish with the secondary ranging which was started in April this year by close MN bar:
- Ichimoku cloud/kumo with Senkou Span A line (which is the virtual border between the primary bullish and the
primary
bearish on the chart) are above the price and too far from it for any
possible reversal of the price movement from the primary bearish to the
bullish market condition in 2015.
- Tenkan-sen line is below Kijun-sen line of Ichimoku which is indicating the primary bearish for this timeframe.
- AbsoluteStrength and TrendStrength indicators are estimating the primary bearish with the secondary ranging to be started for now.
- Chinkou Span line is below the price and and too far from it for any breakout of the price movement in 2015
- Nearest support level is 1.0461 (MN)
- Nearest resistance levels are 1.2569 (MN) and 1.3160 (MN)
If MN price will break 1.2569 resistance level the local uptrend as a market rally will be going to be started within the primary bearish market condition
If MN price will break 1.3160 resistance level so we may see the reversal of the price movement from bearish to the primary bullish on MN timeframe
If not so the price will be ranging between 1.0461 and 1.2569 levels with primary bearish
- Recommendation for long: watch close MN price to break 1.3160 for possible buy trade
- Recommendation
to go short: watch MN price to break 1.0461 support level for possible sell trade
- Trading Summary: ranging
| Resistance | Support |
|---|---|
| 1.2569 (MN) | 1.0461 (MN) |
| 1.3160 (MN) | N/A |
SUMMARY : ranging
TREND : bearish


")
