

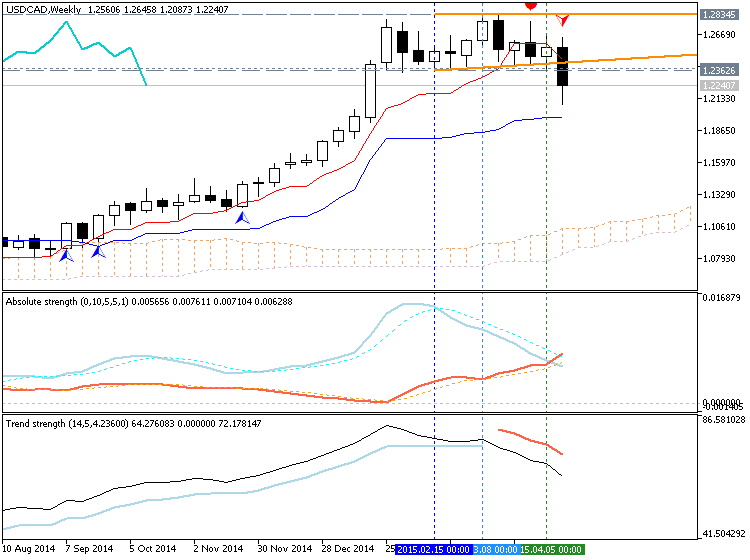
- Tenkan-sen line is above Kijun-sen line of Ichimoku
indicator on W1 timeframe with 1.2362 support level to be broken from
above to below on open W1 bar within the bullish market condition for
possible secondary correction.
- AbsoluteStrength indicator and TrendStrength indicators are indicating the secondary correction and good possible breakdowni for weekly timeframe.
- “The breakdown from a 2 and a half month topping pattern could ‘kick-off’ a much larger decline but near term focus is on early congestion from 1.1931 to 1.2046. There is slope support (former resistance) at the latter level next week.”
- Chinkou Span line is located to be far from the price for the primary trend to be changed but good enough to understand the recent correction as a good possible breakdown.
Trend:
- H4 - bearish
- D1 - bearish
- W1 - correction (bullish breakdown)
- MN1 - ranging bullish


")