
How To Trade - Breakout indicator and How Does It Work: always wait for the current candle to close beyond the trendline to confirm the break

Step 1. - Locating the Trendline
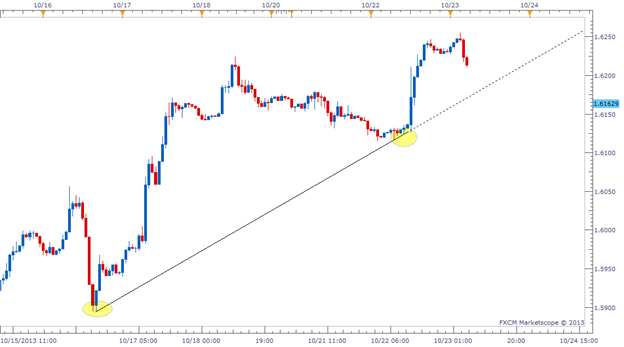
As a review, a trendline is a line connecting two or more lows or two or more highs, with the lines projected out into the future. Traders than look at these projected lines and look for future prices to react around those levels.
Step 2. – Wait For a Confirmed Breakout
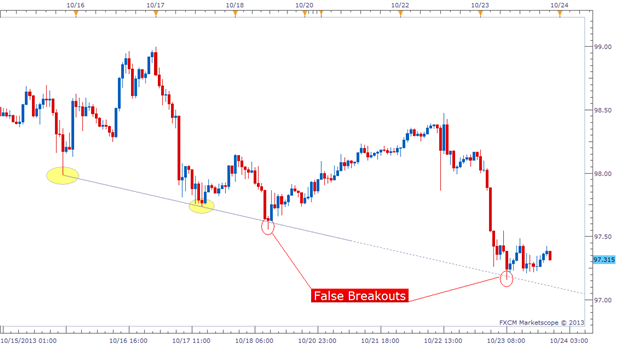
Next, we need to see how the price reacts to the projected trendline.
There are two potential outcomes when price comes into contact with a
trendline:
- The price will bounce off the trendline
- The price will break through the trendline
So we wait to see if the price does in fact break through the price. But we aren’t ready to place a trade just because the price breaks through the trendline. We need to wait and see if the current candle closes beyond the trendline. We require a candle to close beyond the trendline to confirm the breakout. This is a very important rule.
Step 3. Set Up The Trade
Remember the first image I showed you of the GBP/USD Hourly chart? Let’s
go back to that example because it actually ended up producing a near
perfect breakout setup. Soon after that snapshot was taken, the GBP/USD
fell and broke through our trendline with authority. A very short time
after that, the Hourly candle closed below the trendline and confirmed
the breakout as well. Once this happened, it was time to get to work to
setup this trade.
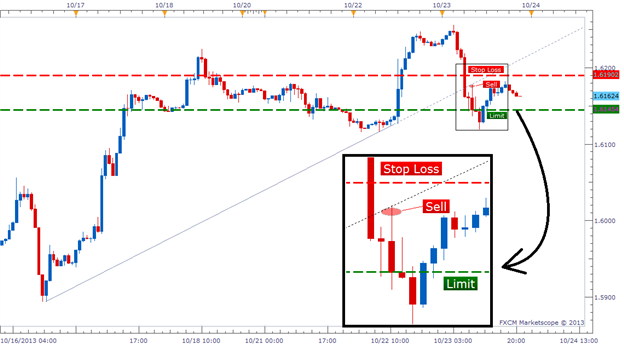
There are 3 things we needed to do to execute this breakout trade:
- Set an Entry order to Sell just below the original trendline.
- Attach a Stop order several pips above the trendline.
- Attach a Limit that is as least twice as large as our Stop (increase your trading profitability by learning the importance of the risk/reward ratio).
There is a saying that goes “What once was resistance, can later become support. And what once was support, can later become resistance.” This is the mantra we rely on when setting an Entry order near the original trendline. We are looking for price to retrace back to the point of support/resistance it just broke through, and then continue back into the direction of the original breakout. Take a look at how the trade was setup below.
Download Breakout indicator from mql5 CodeBase here.


")
![[XAUUSD]: Weekly Liquidity Activation Points (timings), June 22-26, 2026](https://c.mql5.com/6/1013/splash-preview-771790.png "[XAUUSD]: Weekly Liquidity Activation Points (timings), June 22-26, 2026")
")