

EURJPY does not look too optimistic. Don't have a lot of data to back it up, but here is the basic picture.
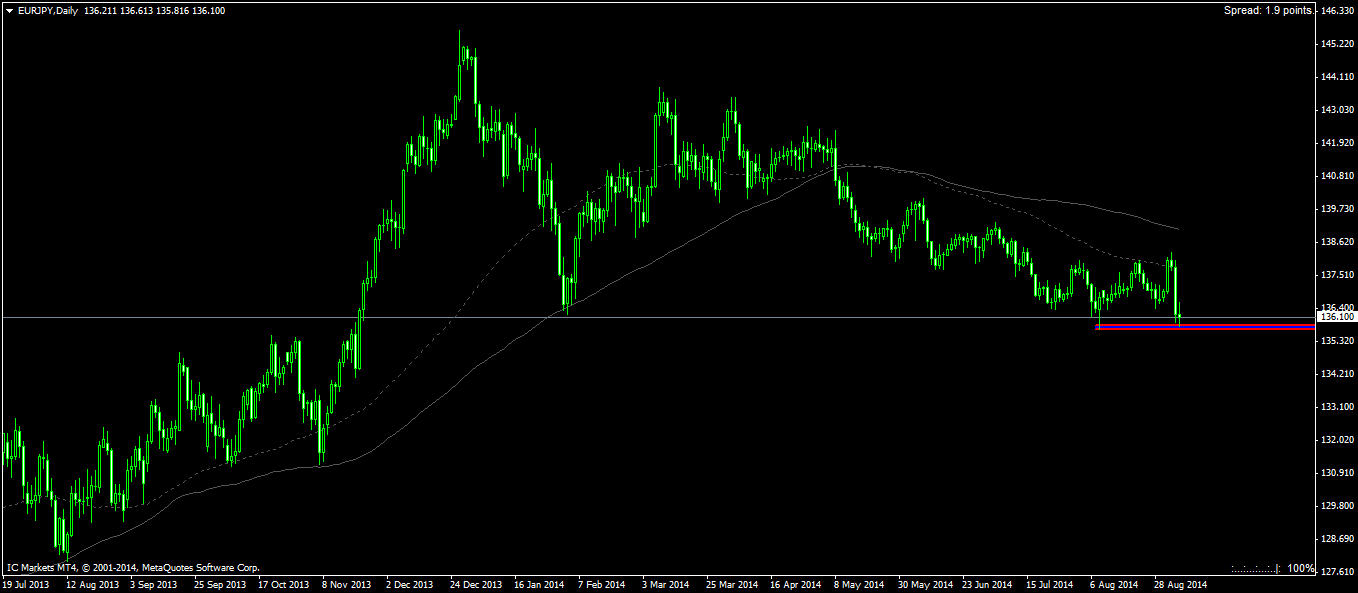
A sharp drop on the daily two trading days ago. Friday's trading action was minimal pretty much. The current price movement prediction is a stall, followed by a few smaller upticks, and then proceeding with further downwards continuation. The idea behind this is that sellers are covering their shorts. In order to cover their shorts, they need to buy back the position and so would cause an uptick. However, it is overall looking bearish.
The two moving averages are both above the price. Also, the dashed line 65-period moving average is lower than the solid line 120-period moving average. Using the moving average as a dynamic support and resistance level, the 65-period moving average is acting as a dynamic support. The price approached it, touched, and then reversed for a further falling action.
I don't have much drawn on this chart, but you will notice that I have highlighted a zone. This is better defined on the 4-hour chart.
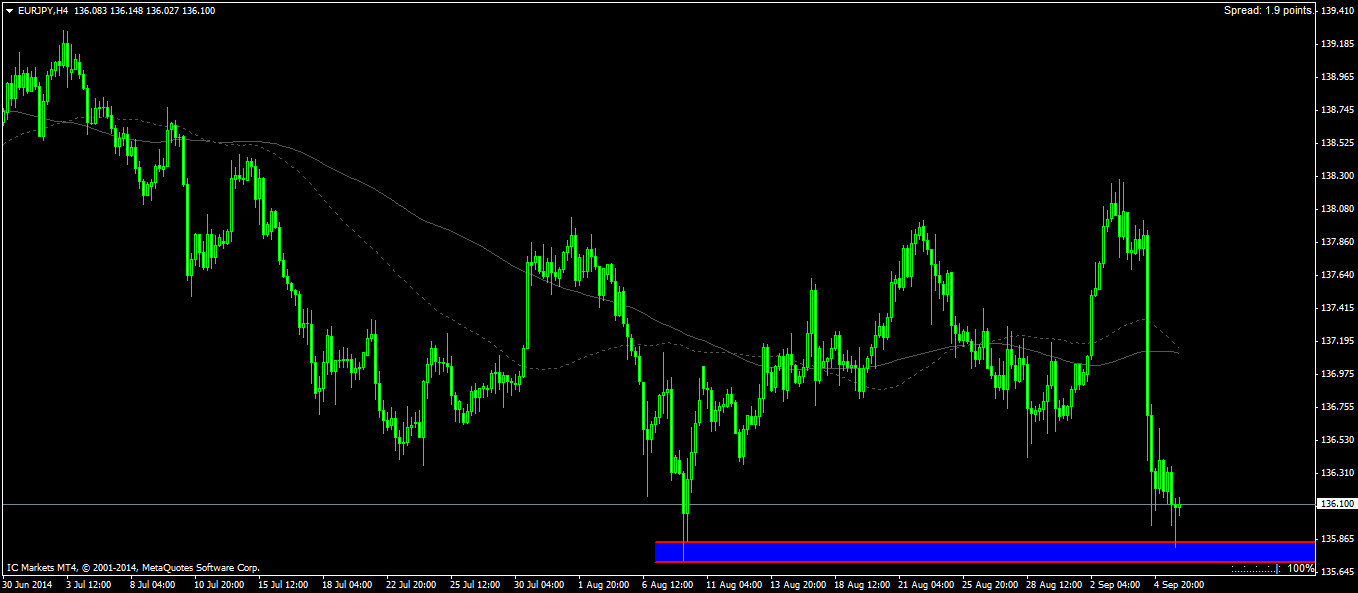
This is the predicted uptick actually. Selling has eased off followed by overlapping higher and lower closes. Not much to tell here except you have sellers closing out their positions by buying and then having these existing buyers with new sellers turn to selling. Only it looks like that sellers are not moving the markets much. Notice how even with the higher close bars, this pair still moved lower. I doubt all the sellers closed out their positions and more are going to close out their position in the upcoming market session. Don't be surprised to see a bounce here before seeing a further continuation.


")

")