

In this article I present fruit of my own research whose the subject is identify the price movements by laws analogues of laws of physics exactly it's a projection of some physical concepts on price movement and especially the concept of force. The fruit are tools-box for analysis and forecasting the behavior of price movement.
Introduction
The current researches in the technical analysis tends to apply laws of statistics (stochastic processes, Markov process…) and also laws of physics , it implicitly assumes that the movements of the price are random and the formation of the price is treated as a physical phenomenon.
The purpose of my work is to determine the movement of prices by similar laws to physicals laws that connect the movement of force (dynamic laws) it’s the projection of some physical concepts on the movement of the price and especially the concept of force. The result of this projection is a Tool-box to understand and predict the price movement further as possible to toss games
Basic Principle
Observing the price movement reveals some very significant rapprochement with the movement of a material point; the price movements have a speed and an acceleration whose are (variables in two sides).
According the second Newton's law or "fundamental principle of dynamics" that connects the force to the movement , we can write:
At each moment the price is subject two opposing forces.
To define and formulate the forces that give acceleration of price movement, we divide time into units (each unit of time is represented by a bar on the chart).
The trace of variation in price caused by buyers in this unit of time determines what we will call force of buyers (Symbolized : Fa ).
The trace of variation in price caused by sellers in this unit of time determines what we will call force of sellers (Symbolized : Fv)
The ratio fa/fs (resp fs /fa) measures the relative force of buyers compared to sellers (respectively the force of seller's compared to buyers)
Next step after writing expression of those two forces, it was “program an indicator" that measures simultaneously with a price's movement their values , this indicator is called
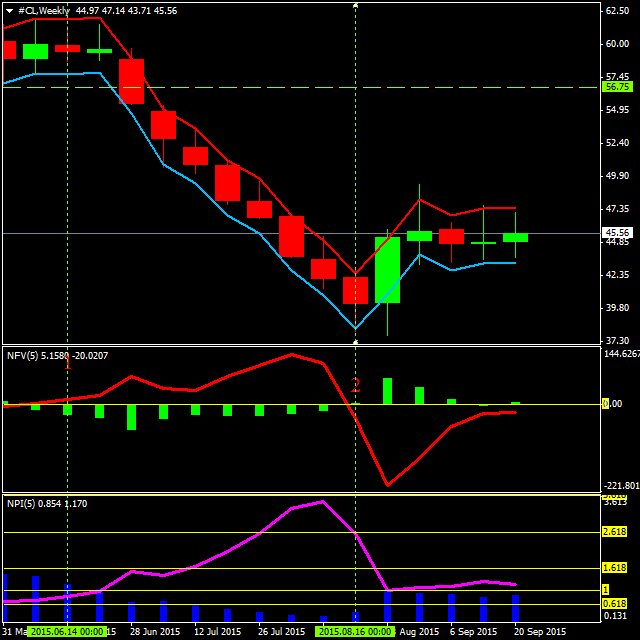
(FORCES-INDEX). The creation of this indicator allows the development of other indicators derivatives like (FORCES-VARIATION) made especially to follow the variation of the (FORCES-INDEX) , and another indicator that I called (dynamic-channel) to Besieged the price in (price window) (see Chart below):
IMA1

Presentation of indicators:
1/ FORCES-INDEX :

This indicator is a "Scales" between the two forces that acting on the price, it simultaneously measures the relative force of buyers represented by the blue histogram and the relative force of sellers represented by the pink curve , the most important think about this indicators is his behavior close golden levels (0.618 , 1.618 , 2.618 ….) .
Equilibrium: (between the two opposites forces ): It is when the indicator move very close to value 1.0, that’s mean that the price movement is taken in horizontal wave.
The imbalance between the two forces acting on the price is when their values are moving away from the equilibrium value (1) in both directions (positive and negative).
Levels of over-bought and oversold:
When the blue histogram goes below the level 0.618 (0.382 is very significant ) then the price is in oversold zone , the changing trend from the down side to then up is expected.
When the pink curve passes below the level 0.618 (0.382 is very significant ) then the price is in the over-bought level , the changing trend from up to downside is expected.
Most important than those levels, are the variation of the forces, so their variation is the key to the whole system, and form this point I decide to created the second indicator especially to follow this variation of forces , I called it “FORCES-VARIATION”.
2 / FORCES-VARIATION :

The green histogram measures the variation of buyers force, while the red curve measures the variation of the sales force, (changing values and signs).
The changing trend from down trend to the uptrend is confirmed when the green histogram changes sign from negative to positive.
The changing trend from the uptrend to the down trend is confirmed when the red histogram changes sign from negative to positive.
When the value of the green histogram increase that’s mean that “uptrend expected to stay for more time" , but if it decrease we expects that the sellers will take control on movement price . Respectively, when the red curve increase that’s mean that “uptrend expected to stay for more time", and if it decrease we expects that the buyers will take control on movement price .
A simple glance at this indicator and in parallel with the price movement gives a very clear impression that it is a very powerful tool to predict very early the change on forces creating the direction of prices thus this indicator will be the first signs of generators in our system of forces by an indicator called “FORCES-SIGNES” (arrow signs).


The signs are generated following the idea in the script below:
FAnow = iCustom( NULL, 0, "FORCES-VARIATION", 1,   i);
      FAprevious = iCustom( NULL, 0, "FORCES-VARIATION", 1,   i+1);
      FAafter = iCustom( NULL, 0, "FORCES-VARIATION", 1,   i+2);

      FVnow = iCustom( NULL, 0, "FORCES-VARIATION", 0,   i);
      FVprevious = iCustom( NULL, 0, "FORCES-VARIATION", 0,   i+1);
      FVafter = iCustom( NULL, 0, "FORCES-VARIATION", 0,   i+2);
      if (((FAprevious <0)&&(FAnow>0))||((FAprevious>0)&&(FAnow>FAprevious)))
    {
     CrossUp[i] = Low[i] - Range*0.5;
      }
       else if (((FVnow > 0)&&(FVprevious < 0))||((FVprevious>0)&&(FVnow>FVprevious)))
       {
        CrossDown[i] = High[i] + Range*0.5;
      }
3/dynamic-channel:
This indicator forms a dynamic channel in price window following the price movement by giving two values (frontiers) , the price should not stay above max value and below min value without correction (more or less) before the opening of a new bar except for a rally, if the horizontal distance between the max and the min value decrease that’s mean “price in rally”
The values of this indicator are calculated by the following formulas:
NPIDIVExtMapBuffer[i]=(pivot-(0.2224*MathExp(-1.9776*(NPIdExtMapBuffer[i]))/123.6)*pivot)+(SHIFT*Point)
NPIdDIVExtMapBuffer[i]=(pivot+((0.2224*MathExp(-1.9776*(NPIuExtMapBuffer[i])))/123.6)*pivot)-(SHIFT*Point );
NB: All these indicators Can Be adapted to different type and period of analysis (short, medium and long-term) .

Trading by using this force’s system


Conclusion
What I have presented here is the result of work that has taken time to achieve these results and present my arguments that I believe in the strength of their credibility on the approach that sees the possibility to study price movement as a physical phenomenon.


")
