
Bitcoin Charts Analysis: Bitcoin price is expected to consolidate sideways between a strong support and resistance level of 350 and 365

BTC/USD 4-H Chart
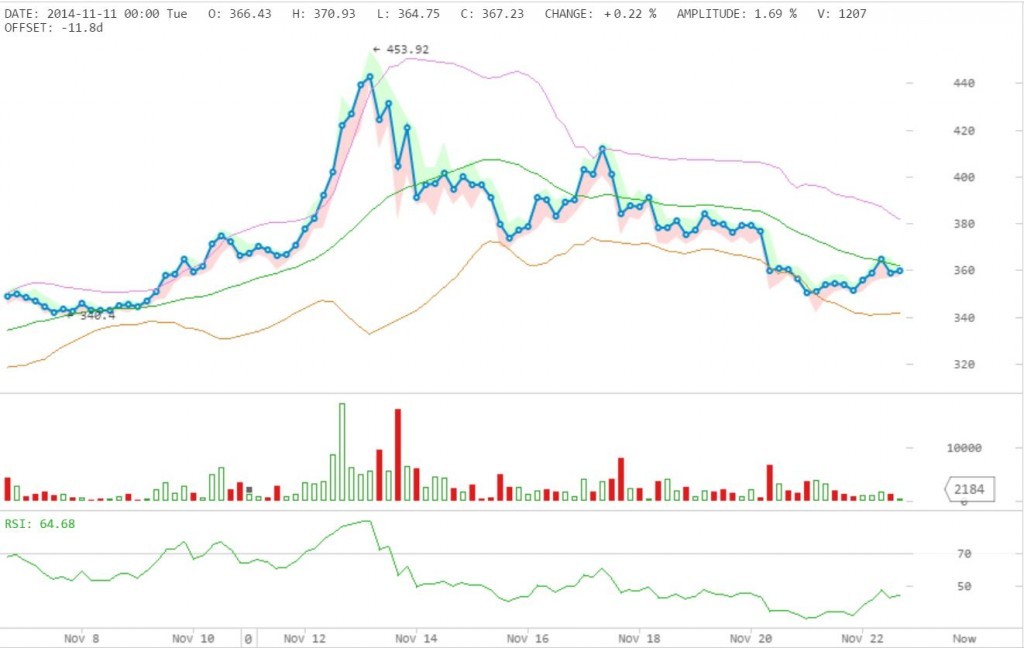
On 4-H charts, the BTC/USD is currently trending in a moderate selling
zone, below the 20- and 50-SMA lines with RSI nearing 40-43. It
indicates a near-term bearish movements in the next few hours, with
little bullish corrections expected in between. There the price would
want to test 350 as the key support level, thanks to a strong buying
zone around that level. At the same time, any major break below the
aforementioned support will open price to a strong bearish channel,
where the next bottom is expected to be in between 320 and 340.
---------
For the next 48 hours, the Bitcoin price is expected to consolidate
sideways between a strong support and resistance level of 350 and 365.
At this point, the pressure would be more on bears to break price below
the 350-wall. If this happens, the next-in-sight resistance would be
between 340 and 320.


")

![[XAUUSD]: Weekly Liquidity Activation Points (timings), June 22-26, 2026](https://c.mql5.com/6/1013/splash-preview-771790.png "[XAUUSD]: Weekly Liquidity Activation Points (timings), June 22-26, 2026")