

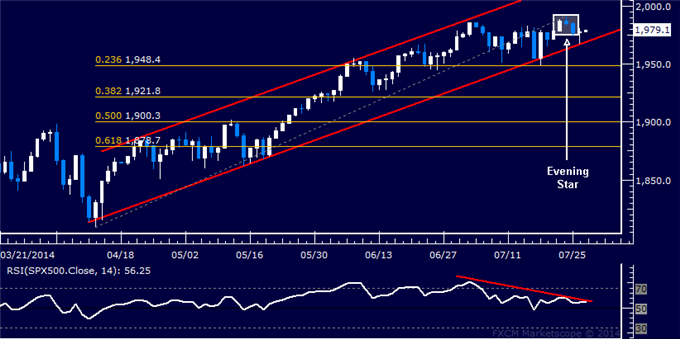
Prices put in a bearish Evening Star candlestick pattern, hinting a move lower may be ahead. Negative RSI divergence bolsters the case for a downside scenario. A daily close below rising channel floor support at 1968.60 exposes the 23.6% Fibonacci retracement at 1948.40. Near-term resistance is at 1991.40, the July 24 high.


")
![[XAUUSD]: Weekly Liquidity Activation Points (timings), June 22-26, 2026](https://c.mql5.com/6/1013/splash-preview-771790.png "[XAUUSD]: Weekly Liquidity Activation Points (timings), June 22-26, 2026")
