

Stochastics gives its strongest sell signal when the two moving
averages that comprise it have first been above 80 and then close below
the 80 level. The strongest buying signal is given when the two moving
averages have first been below 20 and then close above 20. For Stochastics to close below 80 in a downtrend or above 20 in an
uptrend is a much stronger signal than if Stochastics simply goes above
or below those levels during the course of the time that the candle is
open.
New traders typically want to know the difference between Fast
Stochastics and Slow Stochastics. They also want to know whether the
typical default settings of 5,5 (Fast Stochastics) or 5,5,5 (Slow
Stochastics) as seen in most charting packages developed for FX are
better or worse than the typical default settings of 14,3 (Fast
Stochastics) or 14,3,3 (Slow Stochastics) seen in stock and futures
charting packages.
First of all, the difference between Fast Stochastics and Slow Stochastics is just a moving average.
When calculating Fast Stochastics using the values of 5 and 5, the first
“5” is the raw value for Stochastics, while the second “5” is a
5-period moving average of the first “5”. When using Slow Stochastics,
the first two 5’s are the same as with the Fast Stochastics, with the
third “5” being a moving average of the second “5”. Yes, that’s right, a
moving average of the moving average. This slows the movement of the
indicator down even further, hence the name of Slow Stochastics.
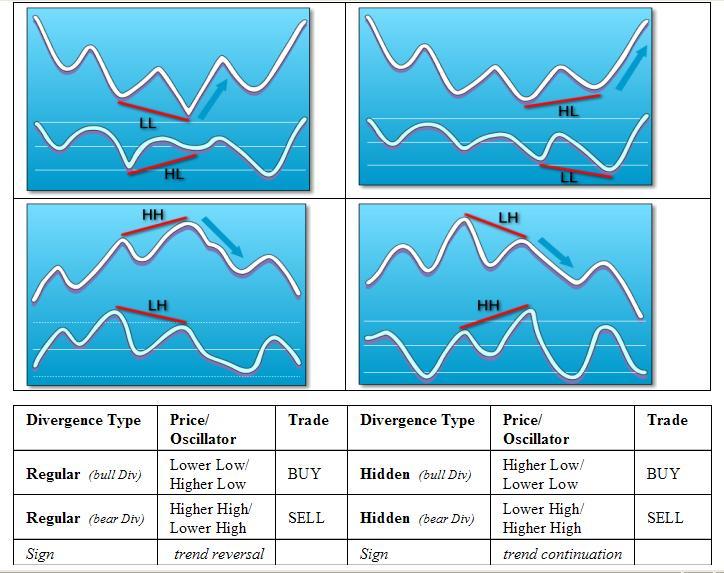
We can read about divergence from the following sources:


")
