

I made an earlier post on the NZDUSD pair stating the possibility of this pair rebounding from a support and established a very specific set of conditions for that possibility. It looks like NZDUSD is really going nowhere, but down! First off, the daily chart is what we will look at.
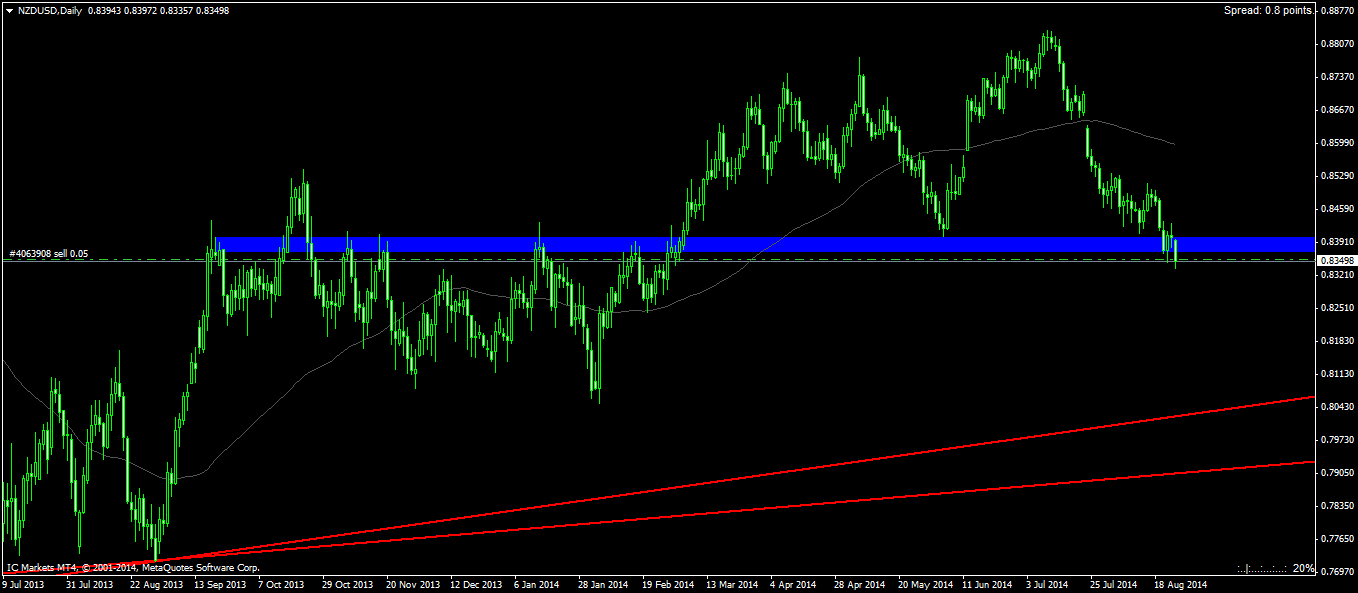
Two trading days ago, this pair closed higher. This made me believe that this pair found a pressurized buying point. This belief quickly faded after seeing the doji on the next day. I guess the definition of a doji is very vague. Some state that a doji must have a close that is equal to the open. However, price psychology tells us that a doji means indecisiveness. Because neither buyers nor sellers can push the price in their favorable direction, there is a lack of a real candle bar. The tails don't really matter as the upper tails signifies buyers attempting to push the pair higher while the lower tail shows sellers attempting to push the pair lower. At the end of the day, neither side is strong enough to overthrow the other. Treat it like a game - tug of war. Both sides pull with all their might and the rope moves back and forth and eventually ends up at its original position. However, is it left off exactly where it began? Not necessarily, but because it is relatively close to its original position we can conclude that neither side has a clear advantage and that's all that matters. There are ways of interpreting a doji, but the last trading day shows indecisiveness. Followed by that, we see very strong selling today and I actually made a very small entry in case buying pressure is found slightly below this zone. After all, this support level is all relative. It isn't exactly black and white as to where it's considered support and where it isn't. I would like to elaborate a bit more on the current trade.
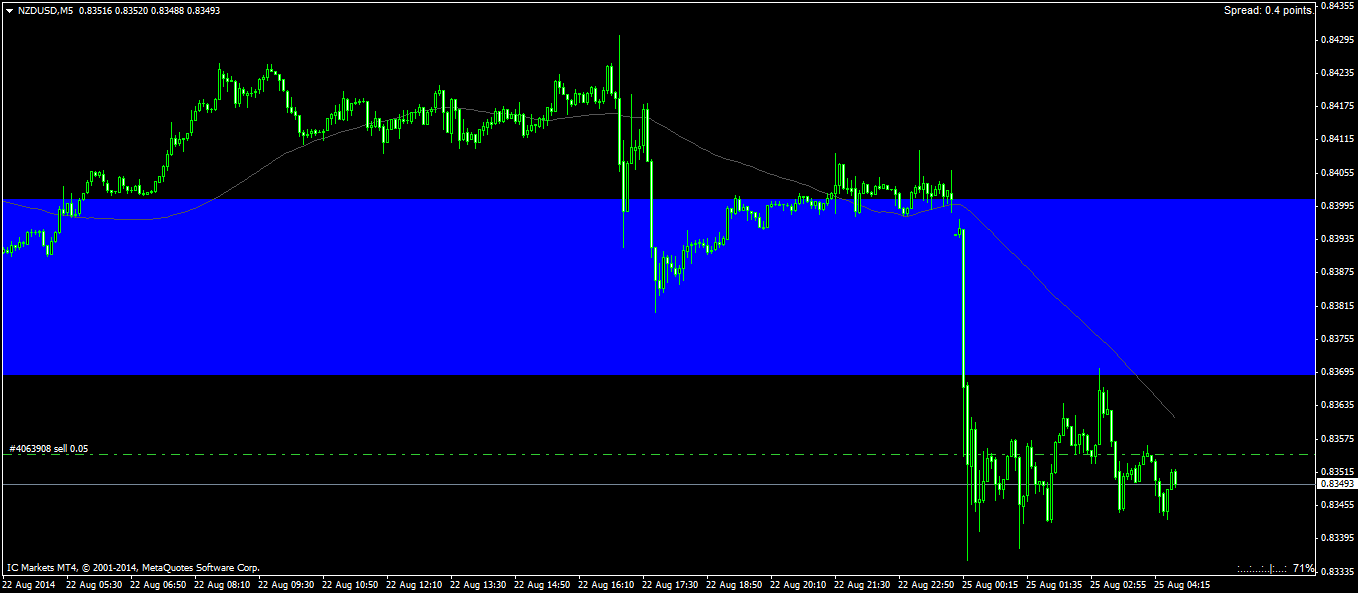
The current trade is actually made looking at the 5 minute time frame. This time frame is actually very interesting because it paints a slightly different signal. In fact, it strengthens the sell signal. The price cut very sharply through the support zone and made a pull back into the blue support zone before reversing. We can classify this as a support turn resistance zone. After the heavy selling, sellers covered their shorts. This caused that pull back up to the now defined resistance. We can now expect a further continuation as the mass traders are getting in on this signal. This why I went in for a very small trade. It's a good way to test the waters without committing too much especially at the current price level.


