

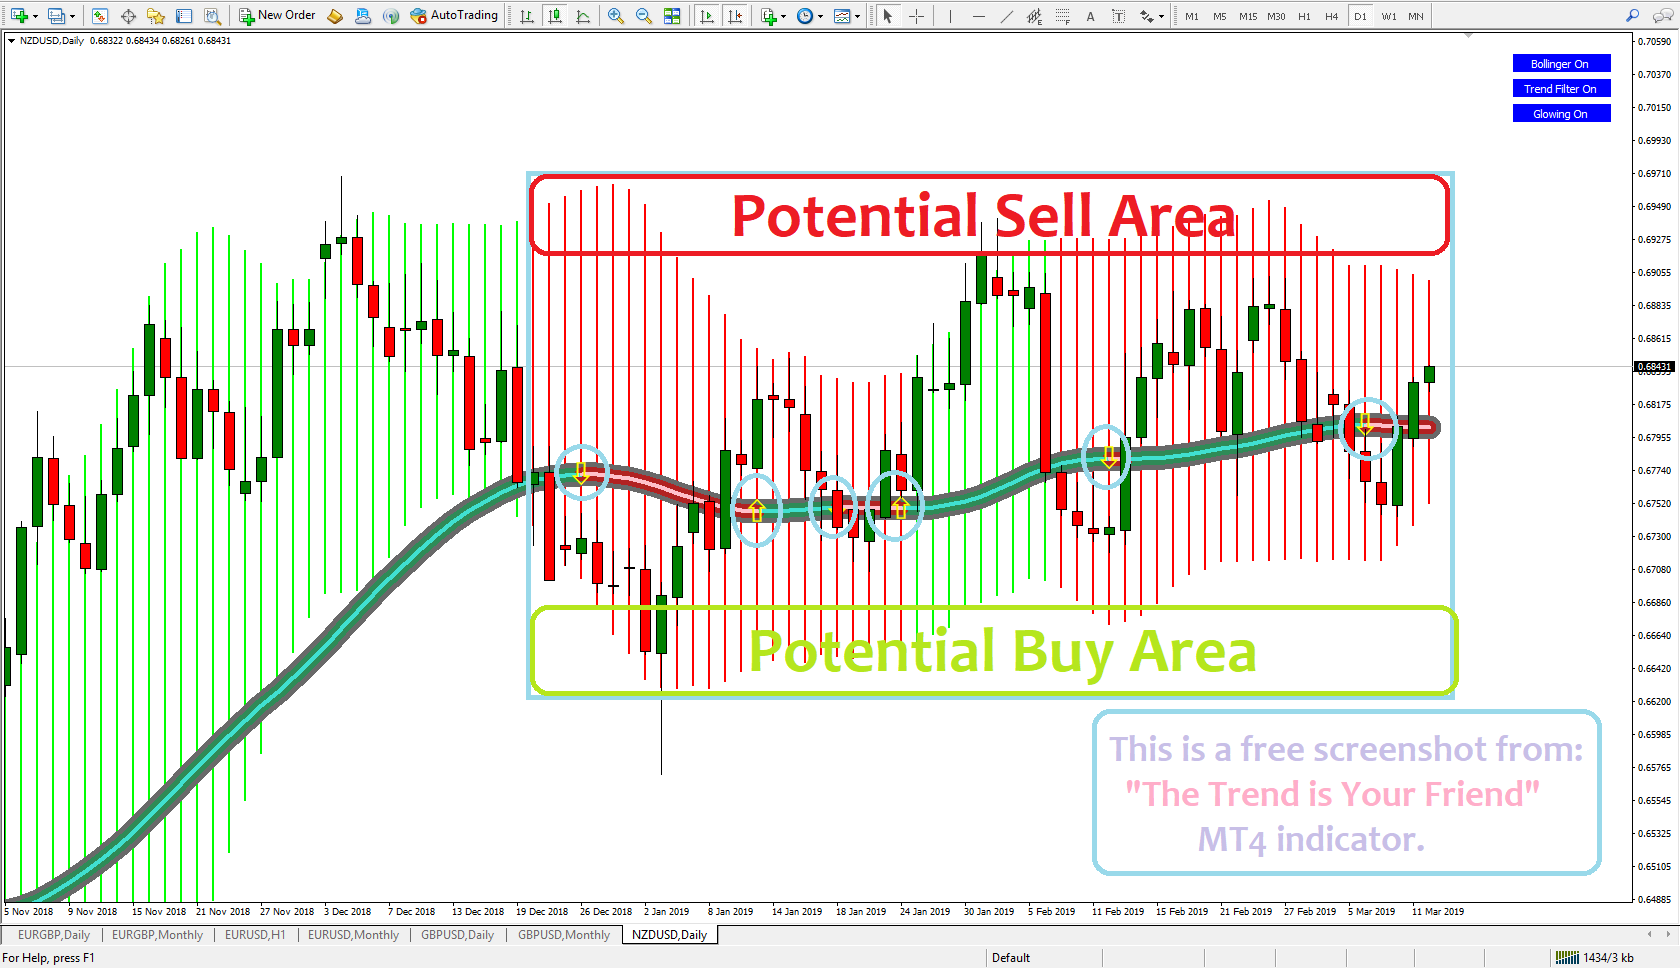
Here's a good case scenario to identify a sideways market.
There are 6 arrows on the glowing line. It is telling me that the price is trading inside a big box. I drew in the chart the potential buy area, and potential sell area.

Files:
NZDUSDx_daily.png
124 kb


")
![[XAUUSD]: Weekly Liquidity Activation Points (timings), June 22-26, 2026](https://c.mql5.com/6/1013/splash-preview-771790.png "[XAUUSD]: Weekly Liquidity Activation Points (timings), June 22-26, 2026")
")