Discussion of article "Studying candlestick analysis techniques (part I): Checking existing patterns"
Свечной анализ появился более 20 лет назад And even probably over 200 years ago.....
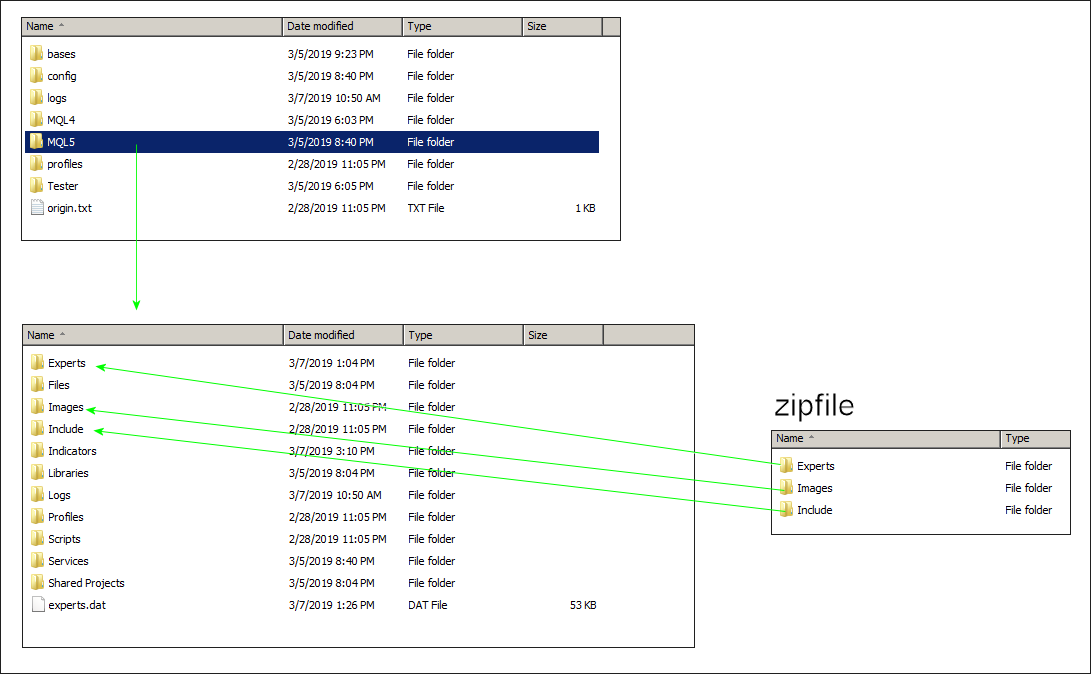
Install helper
Hi Alexander,
thx for posting this interesting article!
I think you draw your conclusions bit too quickly - you can do much more! :)
It's outright correct to first compute probabilities based on counting the occurrences of certain patterns. However, you could preprocess / filter out the detected bars before crunching the odds.
For example, if you look at the doji patterns you could run an additional analysis for each occurring doji if it has been found at prominent places like resistance or support bands, which effectively generates a "higher quality" subset of dojis.
Additionally, this gentleman has some decent analysis ideas at the end of his video which you could integrate as well: https://www.youtube.com/watch?v=djj1Qbp-xv0
If you like some support or exchange ideas, feel free to contact me per PM.
Cheers, AT
It looks great, but I don't know how to use it, and it's very complicated in itself, you need to combine multiple cycles, and running on a single time cycle, sometimes a big positive or negative line will fail.
I got the library working but just copying the files to the folder did not do the trick. What should I do?
- Free trading apps
- Over 8,000 signals for copying
- Economic news for exploring financial markets
You agree to website policy and terms of use
New article Studying candlestick analysis techniques (part I): Checking existing patterns has been published:
In this article, we will consider popular candlestick patterns and will try to find out if they are still relevant and effective in today's markets. Candlestick analysis appeared more than 20 years ago and has since become quite popular. Many traders consider Japanese candlesticks the most convenient and easily understandable asset price visualization form.
In order to evaluate the efficiency of a pattern, let us develop a universal algorithm for evaluating its performance. Figure 1 shows the general scheme of action. Let us take a closer look at it.
Author: Alexander Fedosov