

Making Custom Indicators for Beginners (Part 1): SuperTrend Indicator
 3 304
3 304
 0
0

Introduction
SuperTrend is a representative example of a classic weekend project: two developers can receive identical requirements yet produce very different implementations. The concept is well-established and based on a volatility-band approach (similar to Keltner Channels or Bollinger Bands); however, instead of plotting a static envelope around the price, it is rendered as a single line that switches sides depending on the trend direction. The concept combines the ATR (Average True Range) with a locking mechanism — the ratchet principle. This logic can be implemented in about twenty lines of code.
Repainting can come from a few different causes:
- the current forming bar changing, which is normal and expected;
- closed bars changing due to a state-management bug, which is what this article focuses on;
- genuine future-data leaks, which are a separate and more serious issue.
A subtler, SuperTrend-specific issue is that band values are recursive, so each bar depends on the previous bar's stored state. The current bar's upperband depends on the upper band and the closing price of the previous bar. This means bar i cannot be calculated in isolation; you must know the correct state of bar i−1 (or i+1 in series indexing). Therefore, loop direction and indexing (series arrays vs. standard arrays) must be aligned; otherwise the recursion can silently break in historical data.
Before modifying the code, the technical objectives should be defined precisely:
- Under normal live operation, closed bars should not change once plotted. History reloads, broker resyncs, or timeframe changes can legitimately cause a full recalculation of past bars — that's not a bug, just a different scenario.
- The ATR/band recursion should take into account only the previous bar of the respective data series.
- In real-time, typically only the bar currently forming and the one just closed need adjusting — though some setups (data gaps, ATR handle issues) may need a slightly longer recalculation tail, not just one bar.
- Buy/sell arrows should appear only upon actual trend reversals — and only when those reversals are no longer at risk of being invalidated by new price movements.
Point 4 matters more than it seems. A specific line in the code prevents an arrow from appearing and then disappearing on the next tick.
Theory: What SuperTrend Actually Computes
Strip away the MQL5 mechanics and the underlying math is three ideas stacked on top of each other.
Idea 1: A volatility-scaled envelope. Take the midpoint of the bar (high + low) / 2, and offset it by a multiple of ATR:
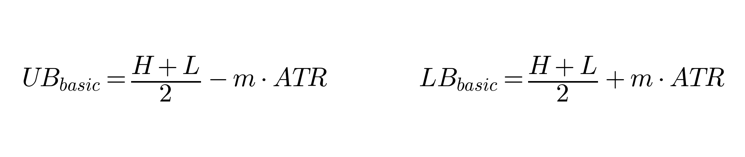
Note: other SuperTrend implementations may compare against the previous SuperTrend line instead of the previous band, or order the trend/band updates differently. This is one valid approach, not the only one.
Idea 2: A ratchet so the band only moves in the trend's favor. A raw ATR band recalculated fresh every bar would jump around and give you a choppy, whipsaw-prone line. SuperTrend fixes this by comparing the new band value against the previous one and only accepting a move that tightens the stop:
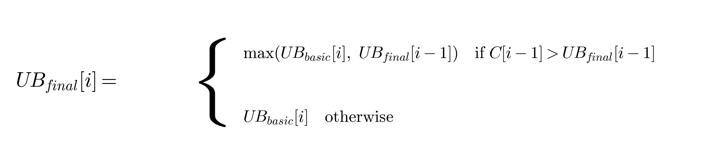
Note: in a normal array, the previous bar is i-1. But once ArraySetAsSeries(..., true) is used, the previous bar in time becomes i+1. The implementation section below uses series indexing, so i+1 is correct there — the formula above and the code are describing the same logic, just with different indexing conventions.
In plain terms: while price stays above the upper band, the upper band is only allowed to rise, never fall back down. The moment price closes below it, the ratchet resets and a fresh band value is accepted. Same logic mirrored for the lower band during downtrends.
Idea 3: A trend flag that flips on a close crossing the opposite band. This is the actual SuperTrend signal — a binary state, uptrend or downtrend, that only changes when price closes through the band on the wrong side. Everything visual (line color, arrows) is just a rendering of this trend flag plus whichever band matches the current direction.
That's the whole indicator. In MetaTrader 5, implementing it takes real engineering effort because all three parts are recursive across bars. MetaTrader 5 is call-based rather than a single full-array run, so the state must persist across separate function calls and must be stored deliberately.
Implementation: Code Walkthrough, Piece by Piece
Here I want to go through the indicator in fragments, in the order execution actually happens, and explain what each piece is doing and why it's written that way. The full compilable file is provided at the end of this article.
Piece 1 — Buffer declarations and plot properties
//--- Register seven indicator buffers (four visible plots, three internal
//--- calculation buffers for the recursive SuperTrend state)
#property indicator_buffers 7

//--- Create four visible plots on the chart
#property indicator_plots   4

//--- Plot 1: Uptrend line
#property indicator_label1  "Up Trend"
#property indicator_type1   DRAW_LINE
#property indicator_color1  clrLime

//--- Plot 2: Downtrend line
#property indicator_label2  "Down Trend"
#property indicator_type2   DRAW_LINE
#property indicator_color2  clrRed

//--- Plot 3: Buy signal arrows
#property indicator_label3  "Buy"
#property indicator_type3   DRAW_ARROW

//--- Plot 4: Sell signal arrows
#property indicator_label4  "Sell"
#property indicator_type4   DRAW_ARROW
Seven buffers in total: four visible plots for the trend lines and arrows, plus three internal calculation buffers — sUp, sDn, and sTrend — that hold the indicator's recursive state. Registering the recursive state as calculation buffers (Piece 2) rather than plain arrays is a deliberate choice: it hands their sizing and continuity over to the terminal itself, which avoids an entire class of bug where manually managed arrays lose their history across bars. The tradeoff is a slightly larger buffer count than a display-only implementation would need, in exchange for reliability.
Piece 2 — Buffer binding
//+------------------------------------------------------------------+
//| Custom indicator initialization function                         |
//+------------------------------------------------------------------+
int OnInit()
  {
//--- Connect indicator buffers with their corresponding plots
   SetIndexBuffer(0, BufUp,   INDICATOR_DATA);
   SetIndexBuffer(1, BufDn,   INDICATOR_DATA);
   SetIndexBuffer(2, BufBuy,  INDICATOR_DATA);
   SetIndexBuffer(3, BufSell, INDICATOR_DATA);

//--- Register the recursive state as calculation buffers — the terminal
//--- keeps these correctly sized and shifted as new bars appear, which
//--- is what a plain dynamic array with manual ArrayResize() does not
//--- reliably guarantee
   SetIndexBuffer(4, sUp,    INDICATOR_CALCULATIONS);
   SetIndexBuffer(5, sDn,    INDICATOR_CALCULATIONS);
   SetIndexBuffer(6, sTrend, INDICATOR_CALCULATIONS);

//--- Define empty values so unused buffer points are not drawn
   PlotIndexSetDouble(0, PLOT_EMPTY_VALUE, EMPTY_VALUE);
   PlotIndexSetDouble(1, PLOT_EMPTY_VALUE, EMPTY_VALUE);
   PlotIndexSetDouble(2, PLOT_EMPTY_VALUE, EMPTY_VALUE);
   PlotIndexSetDouble(3, PLOT_EMPTY_VALUE, EMPTY_VALUE);
The three calculation buffers registered here — sUp, sDn, and sTrend — replace what were previously plain dynamic arrays managed by hand. Registering them via SetIndexBuffer() with INDICATOR_CALCULATIONS hands their sizing and bar-to-bar continuity over to the terminal itself, the same way it already manages BufUp and BufDn. This matters because a manually resized array does not reliably preserve its recursive history across every new bar — an earlier version of this indicator resized these arrays by hand and reinitialized them to zero on every bar change, silently destroying the SuperTrend ratchet's memory each time. Letting the terminal own these buffers removes that entire class of bug.
Piece 3 — OnInit: arrow codes and internal-state separation
//--- Set Wingdings arrow symbols for signal plots
PlotIndexSetInteger(2, PLOT_ARROW, 233); // Buy arrow
PlotIndexSetInteger(3, PLOT_ARROW, 234); // Sell arrow
This sets the visual symbols used for the Buy and Sell arrow plots registered earlier in Piece 1. PLOT_ARROW tells the terminal to draw a Wingdings character at each point where the corresponding buffer holds a value (rather than EMPTY_VALUE). Codes 233 and 234 are specific Wingdings glyphs — an upward-pointing arrow and a downward-pointing arrow — chosen because they're the same codes most MQL5 signal indicators use, making the chart immediately readable to anyone familiar with the platform's conventions. The inline // Buy arrow and // Sell arrow comments here are single-line, not block comments, since each one only describes the one line it sits on.
//--- Internal recursive state, registered as calculation buffers (buffers
//--- 4-6) so the terminal manages their size and bar-to-bar continuity
//--- automatically, instead of manually resized/reset arrays. sTrend is
//--- stored as a double (1.0 / -1.0) because indicator buffers must be
//--- double, and cast to int only where needed for comparisons.
double sUp[];
double sDn[];
double sTrend[];
Note that sTrend is declared as a double here, not an int as in earlier versions. Indicator buffers registered via SetIndexBuffer() must be double arrays — this is a terminal requirement, not a design choice — so the trend flag is stored as 1.0 or -1.0 and cast to int with (int)sTrend[i] wherever it's used for comparisons in the calculation loop below.
Piece 4 — OnInit: the ATR handle
//--- Create the ATR indicator handle and verify that it was created successfully
hATR = iATR(_Symbol, PERIOD_CURRENT, InpAtrPeriod);
if(hATR == INVALID_HANDLE)
  {
   Print("iATR create failed");
   return INIT_FAILED;
  }
Handle creation happens exactly once, in OnInit, not inside the calculation function. This is a common mistake worth naming directly: creating an indicator handle inside OnCalculate — even guarded by a check — is almost always bad design and wastes resources by repeatedly recreating the handle. It doesn't always cause stale data or leaks, but it's unnecessary overhead with no upside, so OnInit is the correct place. OnDeinit releases it:
//+------------------------------------------------------------------+
//| Custom indicator deinitialization function                       |
//+------------------------------------------------------------------+
void OnDeinit(const int reason)
  {
//--- Release the ATR indicator handle when the indicator is removed
   if(hATR != INVALID_HANDLE)
      IndicatorRelease(hATR);
  }
The OnDeinit() function is the indicator's cleanup counterpart to OnInit() — it runs once when the indicator is removed from the chart, whether that's the user deleting it manually, changing timeframes, or the terminal shutting down. Its only job here is releasing the ATR handle created in OnInit() with IndicatorRelease(). This matters because indicator handles are a limited terminal resource: every time an indicator is attached without its previous handle being released, that resource stays allocated even after the indicator is gone. Since hATR is created exactly once in OnInit() and never recreated elsewhere, releasing it here — and only here — keeps the indicator's resource usage clean across repeated attach/detach cycles, which matters especially during backtesting, where an indicator might be loaded and unloaded many times in a single optimization run.
Piece 5 — OnCalculate: guard clause and the ATR retrieval
//--- Ensure there are enough bars and load the ATR data
if(rates_total < InpAtrPeriod + 2)
   return 0;

double atr[];
ArraySetAsSeries(atr, true);
int copied = CopyBuffer(hATR, 0, 0, rates_total, atr);
if(copied < rates_total)
   return 0;
The minimum-bar guard exists because the seeding step (Piece 7) needs at least one full ATR period plus a couple of spare bars to establish a starting point — without it, you'd index into uninitialized ATR data.
CopyBuffer retrieves the full ATR history, not only the newest bars. This is slower but more reliable on fresh loads and after history gaps. If CopyBuffer returns fewer bars than requested, the indicator returns 0 and retries on the next tick. That's a conscious tradeoff, chosen for reliability and simplicity: it's not the cheapest option CPU-wise, but it avoids a whole category of partial-copy bugs that show up specifically on fresh chart loads or after a history gap, where CopyBuffer can return fewer bars than requested. This is acceptable for normal timeframes. For high-frequency use cases or very large histories, copying only the required tail can be a worthwhile optimization. Bailing out with return 0 when the copy is short means the indicator simply waits and retries next tick rather than computing against incomplete data.
Piece 6 — Series indexing, with no manual buffer resizing
//--- Use series indexing where index 0 represents the latest bar. Since
//--- sUp/sDn/sTrend are now terminal-managed calculation buffers, no
//--- manual ArrayResize()/ArrayInitialize() is needed or performed here —
//--- the terminal keeps their existing values correctly aligned as new
//--- bars appear, so previously calculated state is never lost.
ArraySetAsSeries(high,  true);
ArraySetAsSeries(low,   true);
ArraySetAsSeries(close, true);
ArraySetAsSeries(BufUp,   true);
ArraySetAsSeries(BufDn,   true);
ArraySetAsSeries(BufBuy,  true);
ArraySetAsSeries(BufSell, true);
ArraySetAsSeries(sUp,    true);
ArraySetAsSeries(sDn,    true);
ArraySetAsSeries(sTrend, true);
An earlier version of this piece manually resized sUp, sDn, and sTrend with ArrayResize() whenever rates_total changed, and reinitialized them to zero immediately afterward. Since rates_total changes on every new bar, that reset ran constantly — wiping the recursive ratchet's memory each time a bar closed, not just on first load. The band would then rebuild from a zeroed reference point on every bar, which is what caused the erratic, non-ratcheting behavior described in the Edge Cases section. With sUp/sDn/sTrend now registered as calculation buffers in Piece 2, the terminal handles their sizing automatically — this piece only needs to mark them as series-indexed, exactly like the display buffers above them.
Piece 7 — Full recalculation branch and the seed bar
//--- Determine the starting point for the calculation
int start = rates_total - prev_calculated;

//--- Perform a full initialization on the first calculation
if(prev_calculated <= 1)
  {
   ArrayInitialize(BufUp,   EMPTY_VALUE);
   ArrayInitialize(BufDn,   EMPTY_VALUE);
   ArrayInitialize(BufBuy,  EMPTY_VALUE);
   ArrayInitialize(BufSell, EMPTY_VALUE);
   ArrayInitialize(sUp,    0);
   ArrayInitialize(sDn,    0);
   ArrayInitialize(sTrend, 0);

   //--- Seed the recursive SuperTrend state
   int seed = rates_total - 2;
   double hl2seed = (high[seed] + low[seed]) / 2.0;
   sUp[seed]    = hl2seed - InpMultiplier * atr[seed];
   sDn[seed]    = hl2seed + InpMultiplier * atr[seed];
   sTrend[seed] = 1;

   start = seed - 1;
  }
prev_calculated <= 1 is the terminal's way of telling the indicator "you have nothing valid cached" — first attach, or certain history-reload events. This is the only place the whole history gets wiped and reseeded. seed = rates_total - 2 picks the second-oldest bar in the series-indexed array; it is set here rather than at rates_total - 1 to make sure a full ATR value is available at the seed point (the oldest bar has no prior context to compute against cleanly).
The seed trend is arbitrarily set to 1 (uptrend) — this is a real limitation worth being upfront about. The initial trend value is arbitrary and may affect more of the early history than it first appears, depending on ATR period and multiplier, not just the first few bars — the recursion needs a number of bars to "settle" into whatever the true trend actually is. This is normal and matches how most SuperTrend references behave, not a bug specific to this file.
Piece 8 — The live-tick branch, and the recursive band update
else
  {
   //--- Recalculate at least the most recent bars on every new tick
   if(start < 1)
      start = 1;
  }

//--- Update the SuperTrend bands using the previous bar's state
for(int i = start; i >= 0; i--)
  {
   if(i >= rates_total - 1)
      continue;

   double hl2     = (high[i] + low[i]) / 2.0;
   double atrVal  = atr[i];
   if(atrVal <= 0)
      continue;

   double basicUp = hl2 - InpMultiplier * atrVal;
   double basicDn = hl2 + InpMultiplier * atrVal;

   double prevUp = sUp[i + 1];
   double prevDn = sDn[i + 1];
   double prevClose = close[i + 1];

   sUp[i] = (prevClose > prevUp) ? MathMax(basicUp, prevUp) : basicUp;
   sDn[i] = (prevClose < prevDn) ? MathMin(basicDn, prevDn) : basicDn;
  }
On a normal tick, prev_calculated equals the previous rates_total, so start = rates_total - prev_calculated comes out to 0 — meaning only the current forming bar would be touched. The if(start < 1) start = 1 bump means the indicator actually reprocesses the current bar and the one just behind it. That's intentional: the most recently closed bar can sometimes need a final correction pass on the very next tick, due to how MetaTrader 5 finalizes bar data, so recomputing it once more on the following tick catches that without touching anything older.
The band update itself is the ratchet from the theory section, translated directly: prevClose > prevUp checks whether price was still respecting the upper band as of the prior bar, and if so, the band is only allowed to move up (MathMax), never down. Same mirrored logic for the lower band during a downtrend.
Piece 9 — Trend flip detection
//--- Determine whether the trend direction has changed
int prevTrend = (int)sTrend[i + 1];
int trend     = prevTrend;

if(prevTrend == -1 && close[i] > prevDn)
   trend = 1;
else
   if(prevTrend == 1 && close[i] < prevUp)
      trend = -1;
   else
      if(prevTrend == 0)
         trend = 1;

//--- Store the updated trend state
sTrend[i] = (double)trend;
The added prevTrend == 0 branch is a safety net for a state that should no longer occur now that the buffer-reset bug in Piece 6 is fixed, but is worth guarding against explicitly: if the previous bar's trend was ever read as an unset 0 rather than a real 1 or -1, the trend would otherwise stay locked at 0 indefinitely, since neither of the two flip conditions above can ever match it. Defaulting an unset state to uptrend (1) means the recursion always recovers to a valid trend on the very next bar instead of staying stuck.
Piece 10 — Plotting and the arrow-suppression guard
//--- Display only the active SuperTrend line
if(trend == 1)
  {
   BufUp[i] = sUp[i];
   BufDn[i] = EMPTY_VALUE;
  }
else
  {
   BufDn[i] = sDn[i];
   BufUp[i] = EMPTY_VALUE;
  }

//--- Clear signal buffers before assigning new arrows
BufBuy[i]  = EMPTY_VALUE;
BufSell[i] = EMPTY_VALUE;

//--- Draw buy/sell arrows only after a confirmed trend reversal
if(InpShowSignals && i > 1)
  {
   if(trend == 1 && prevTrend == -1)
      BufBuy[i]  = sUp[i];
   else
      if(trend == -1 && prevTrend == 1)
         BufSell[i] = sDn[i];
  }
The line-color split works because only one of the two line buffers is non-empty on any given bar — this is how MetaTrader 5 fakes a single line changing color; it's actually two separate line plots, each showing gaps where the other one is active.
The condition i > 1 is the piece flagged back in the introduction. It excludes the newest one or two bars from ever getting a buy/sell arrow. This is a design choice, not the only correct option: without it, an arrow could appear on the forming bar, then vanish or move to a different bar on the next tick once more price data comes in and the trend recursion gets reprocessed — which is technically not repainting the line, but looks exactly as broken to someone watching it happen live. Holding signals back until they're a bar or two old trades a small, intentional delay for arrows that, once shown, never move again.
Edge Cases
- History reloads / broker resyncs / timeframe changes can legitimately trigger a full recalculation of past bars via prev_calculated <= 1. This is expected behavior, not repainting in the harmful sense.
- Mixing series and normal indexing across arrays is one of the most common sources of silent off-by-one errors in SuperTrend ports — every array touched by the recursion must be set to series mode consistently.
- The seed bar's arbitrary starting trend can visibly affect more of the early chart history than expected, depending on the ATR period and multiplier used.
- Arrow delay is intentional, not a workaround for a deeper bug — it trades a one-to-two-bar delay for arrows that never move once plotted.
Testing Notes
Compiled without errors and tested on XAU/USD, EUR/USD, USD/JPY, GBP/USD mostly on hourly charts. No repainting of already-closed bars was observed during normal tick-by-tick operation, using default ATR period and multiplier settings, over a multi-day live testing period without terminal restarts or timeframe switches during the test window. This does not guarantee behavior under all conditions — history reloads, broker resyncs, or terminal restarts were not part of this specific test pass and may produce a different (but expected, per the Edge Cases section) recalculation of historical bars.
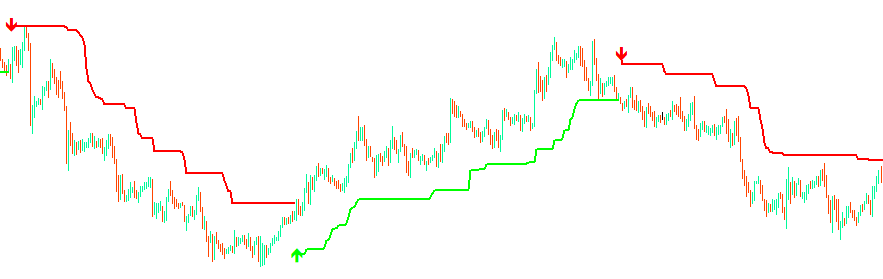
Figure 1. SuperTrend Indicator on chart
Practical Application: Testing with an Expert Advisor
To demonstrate the indicator's practical use in a live trading context, a simple Expert Advisor (EA) was built around the SuperTrend logic described above. The EA opens a position in the direction of the trend whenever SuperTrend flips — buy on an up-flip, sell on a down-flip — and closes any existing opposite-side position before doing so, so it never holds both directions at once.
The EA reads the indicator's confirmed signal directly via iCustom() rather than recalculating SuperTrend internally, and attaches the indicator to the chart so its lines and arrows remain visible during live or demo trading. This EA is not intended as a complete or optimized trading system — it exists purely to show that the indicator's signals can drive real trade decisions. There is deliberately no fixed stop-loss or take-profit: a position stays open until the next confirmed opposite signal, which both closes it and opens the new one at the same time.
EA Function Overview
The following section provides a brief overview of the main functions used in the Expert Advisor. Each function is described by its purpose, inputs, and return value to help readers understand the overall structure before moving on to the implementation details. Function 1 — OnInit()
Purpose: Initializes the Expert Advisor and loads the SuperTrend indicator via iCustom(). In live and demo trading, it also attaches the indicator visually to the chart.
Input: None.
Returns: Returns INIT_SUCCEEDED if initialization is successful; otherwise returns an initialization error code.
Function 2 — OnTick()
Purpose: Executes the main trading logic on every incoming market tick. It reads the confirmed trend and opens or reverses positions accordingly.
Input: Current market tick.
Returns: None.
Function 3 — GetSupertrendFromIndicator()
Purpose: Reads the confirmed trend directly from the indicator via iCustom() and CopyBuffer().
Input: Reference for the trend direction.
Returns: true if a trend value is available; otherwise false.
Function 4 — OpenBuy() / OpenSell()
Purpose: Opens a buy or sell position at the current market price. No stop-loss or take-profit is set; the position is managed entirely by the next confirmed signal.
Input: None.
Returns: None.
Function 5 — CloseAll()
Purpose: Closes any open position belonging to this EA on this symbol, called immediately before opening a position in the opposite direction.
Input: None.
Returns: None.
With the main functions introduced, we can now examine the implementation step by step. The following code sections highlight the key parts of the Expert Advisor and explain how they work together during execution.
EA Implementation: Code Walkthrough, Piece by Piece
Same approach as the indicator: instead of dumping the whole file, here are the pieces of the EA that carry the actual decision logic.
Piece 1 — Reading the confirmed signal from the indicator
//+------------------------------------------------------------------+
//| Reads the confirmed trend directly from the SuperTrend indicator |
//| via iCustom — buffer 0 is the Up line, buffer 1 is the Down line |
//+------------------------------------------------------------------+
bool GetSupertrendFromIndicator(int &trendOut)
  {
   if(BarsCalculated(hSuperTrend) < 2)
      return false;

   double bufUp[], bufDn[];
   ArraySetAsSeries(bufUp, true);
   ArraySetAsSeries(bufDn, true);

   if(CopyBuffer(hSuperTrend, 0, 0, 2, bufUp) < 2)
      return false;
   if(CopyBuffer(hSuperTrend, 1, 0, 2, bufDn) < 2)
      return false;

//--- Use the last closed bar (index 1), the confirmed value
   if(bufUp[1] != EMPTY_VALUE)
     {
      trendOut = 1;
      return true;
     }
   if(bufDn[1] != EMPTY_VALUE)
     {
      trendOut = -1;
      return true;
     }
   return false;
  }
This function is the EA's only connection to the outside world's price action, and it deliberately contains zero trading logic of its own. It asks the indicator built earlier in this article one question — "what is the last confirmed trend?" — and nothing more. Buffer 0 is the Up line, buffer 1 is the Down line, in the exact order the indicator itself registers them in its own OnInit(). Reading index 1 rather than index 0 matters: index 0 is the still-forming, currently-open bar, which can still change as price moves within it, while index 1 is the last bar that has actually closed. This is the same distinction the indicator itself uses when deciding the last closed bar's confirmed trend state. It's worth being precise here: the EA reads the trend line buffers directly at index 1, while the indicator's arrow display additionally requires i > 1 before drawing a Buy/Sell arrow (Piece 10). This means the EA can register a confirmed trend change one bar before the corresponding arrow becomes visible on the chart — the EA is reading the confirmed trend state, not consuming the indicator's arrow buffers.
The BarsCalculated() check is a short-lived guard for the moment right after the EA attaches: a brand-new indicator handle needs a tick or two to finish its first calculation, and this simply waits for that rather than trusting buffers that might not be populated yet. If either buffer read fails or comes back empty, the function returns false, and OnTick treats that tick as a no-op — the EA does nothing rather than guess.
Piece 2 — Opening positions
//+------------------------------------------------------------------+
//| Opens a buy at market, no SL/TP — exit happens only on the next  |
//| opposite signal                                                  |
//+------------------------------------------------------------------+
void OpenBuy()
  {
   double ask = SymbolInfoDouble(_Symbol, SYMBOL_ASK);
   Trade.Buy(InpLotSize, _Symbol, ask, 0, 0, InpComment);
  }

//+------------------------------------------------------------------+
//| Opens a sell at market, no SL/TP — exit happens only on the next |
//| opposite signal                                                  |
//+------------------------------------------------------------------+
void OpenSell()
  {
   double bid = SymbolInfoDouble(_Symbol, SYMBOL_BID);
   Trade.Sell(InpLotSize, _Symbol, bid, 0, 0, InpComment);
  }
Both functions are as plain as a market order gets: a fixed lot size, the current price, and no stop-loss or take-profit distance calculated anywhere. That last part is intentional rather than an omission. This EA's exit condition isn't a price level — it's a different signal from the same indicator, handled entirely in Piece 5. Keeping OpenBuy() and OpenSell() this minimal means there's exactly one place in the entire EA where a position's fate is decided, rather than that responsibility being split between an order's SL/TP and separate logic elsewhere that might disagree with it.
Piece 3 — Closing positions
//+------------------------------------------------------------------+
//| Closes any open position from this EA on this symbol             |
//+------------------------------------------------------------------+
void CloseAll()
  {
   for(int i = PositionsTotal()-1; i >= 0; i--)
     {
      ulong t = PositionGetTicket(i);
      if(!t)
         continue;
      if(PositionGetString(POSITION_SYMBOL) != _Symbol || PositionGetInteger(POSITION_MAGIC) != (long)InpMagic)
         continue;
      Trade.PositionClose(t);
     }
  }
CloseAll() loops through every open position on the account, but only actually touches the ones that match both this EA's symbol and its magic number — the two checks together make sure it never closes a position that belongs to a different EA, a different symbol, or a manual trade the account holder placed themselves. This function is called from exactly one place, in Piece 5, in the instant before a reversal trade is opened, so a position is never left open on the old side of a signal even for a single tick.
Piece 4 — OnInit: connecting to the indicator
//+------------------------------------------------------------------+
//| Expert initialization function                                   |
//+------------------------------------------------------------------+
int OnInit()
  {
   Trade.SetExpertMagicNumber(InpMagic);
   Trade.SetDeviationInPoints(50);

   hSuperTrend = iCustom(_Symbol, _Period, "Super Trend Indicator", InpAtrPeriod, InpMultiplier, InpShowSignals);
   if(hSuperTrend == INVALID_HANDLE)
     {
      Print("Failed to load SuperTrend indicator via iCustom");
      return INIT_FAILED;
     }

   if(InpShowSignals)
      ChartIndicatorAdd(0, 0, hSuperTrend);

   LastTrend = 0;
   return INIT_SUCCEEDED;
  }
The iCustom() call is the single line that ties this EA to the indicator built earlier in the article — it loads that indicator by name, passing through the EA's own InpAtrPeriod, InpMultiplier, and InpShowSignals, so both pieces always run with matching settings instead of silently drifting apart if one were edited without the other. If the indicator can't be found or fails to load, OnInit() returns INIT_FAILED immediately rather than letting the EA run with no signal source at all.
ChartIndicatorAdd() attaches the indicator visually to the same chart the EA is running on, so its lines and arrows remain visible exactly as built in the indicator section — useful for watching the EA's decisions align with the chart in real time.
LastTrend is set to 0 here as a sentinel value with a specific job: it tells Piece 5 that no confirmed trend has been observed yet, which is what prevents the EA from opening a trade on its very first tick based on whatever trend already happened to be underway.
Piece 5 — OnTick: the decision flow
//+------------------------------------------------------------------+
//| Expert tick function                                             |
//+------------------------------------------------------------------+
void OnTick()
  {
   int trend = 0;
   if(!GetSupertrendFromIndicator(trend))
      return;

//--- On the very first confirmed trend the EA sees, just record it as a
//--- baseline — do not open a trade yet, since there was no actual
//--- SuperTrend reversal at this point, only whatever trend already
//--- happened to be in progress when the EA was attached
   if(LastTrend == 0)
     {
      LastTrend = trend;
      return;
     }

//--- Every subsequent confirmed signal change — close and reverse
   if(trend != LastTrend)
     {
      CloseAll();
      if(trend == 1)
         OpenBuy();
      else
         OpenSell();
      LastTrend = trend;
     }
  }
Every tick starts the same way: ask Piece 1 for the current confirmed trend, and if it isn't available yet, do nothing and wait for the next tick. Everything after that hinges on one distinction that's easy to get wrong and worth stating precisely: the difference between "a trend exists" and "a trend just changed."
The first branch only ever runs once, the very first time the EA sees a valid trend after attaching. At that moment, the market is already in the middle of whatever trend the indicator shows — there was no reversal happening right then, just a trend already in progress before the EA arrived. Trading on that would mean entering on a signal that never actually occurred, so this branch deliberately does nothing but record LastTrend as a starting reference point.
From then on, the EA is only ever triggered by trend != LastTrend — an actual, confirmed change in direction. When that happens, CloseAll() clears whatever position is open and the opposite one is opened immediately after, so the EA is always positioned in the direction of the indicator's last confirmed signal, and only ever flat for the brief instant between closing one position and opening the next.
EA Testing Notes
The EA was backtested across four instruments — XAU/USD, EUR/USD, GBP/USD, and USD/JPY — using the SuperTrend indicator connected purely via iCustom(), with a $3,000 initial deposit and no fixed stop-loss or take-profit: every position is closed and reversed purely on the next confirmed signal.
XAU/USD:
The strategy was tested on XAU/USD over an extended history and produced 1,685 trades. Net profit came in at $1,374.91, with a profit factor of 1.10 and a recovery factor of 1.46. The equity curve stayed in a broad range through most of 2024 and early 2025 before a sharp, sustained climb from late 2025 onward drove most of the overall gain. Maximum equity drawdown reached 27.57%. Long trades outperformed shorts on this pair, winning 39.98% of the time versus 31.71% for shorts. 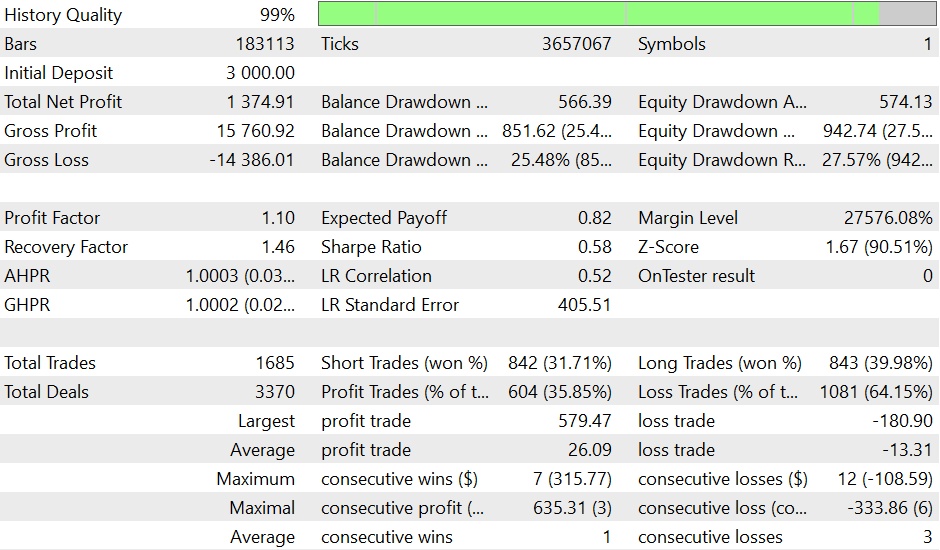
Figure 2. XAU/USD backtest
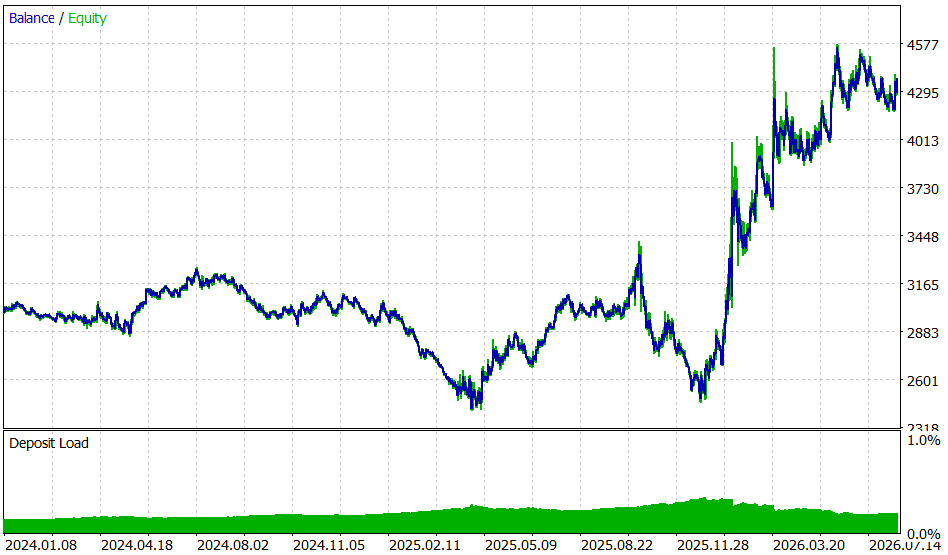
Figure 3. Equity Curve of XAU/USD
EUR/USD:
On EUR/USD, the strategy produced 1,027 trades with a net loss of $332.30, a profit factor of 0.78, and a recovery factor of -0.91. The equity curve shows a steady decline through most of the test window, with no strong recovery phase. Maximum equity drawdown reached 12.19%, the lowest of the four pairs, despite the negative overall result. Long and short win rates were close (34.82% vs 34.31%), suggesting no meaningful directional edge on this pair. 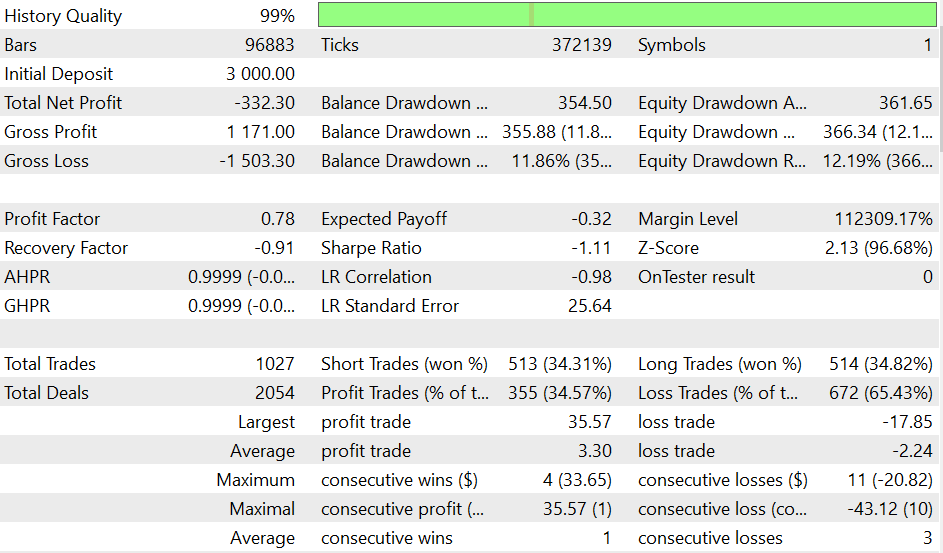
Figure 4. EUR/USD backtest
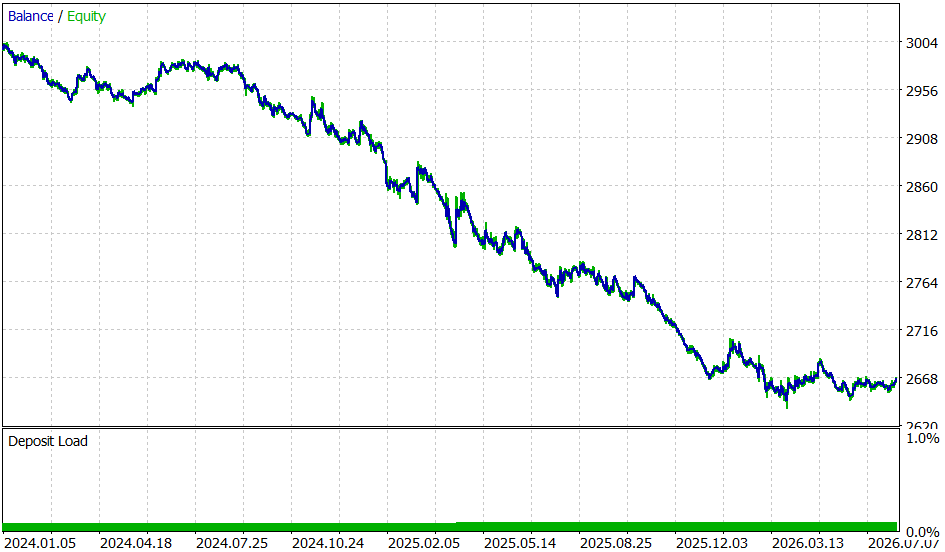
Figure 5. Equity Curve of EUR/USD
GBP/USD:
GBP/USD was the weakest performer among the four pairs. The strategy generated 367 trades, producing a net loss of $920.64, with a profit factor of 0.83 and a recovery factor of -0.80. The equity curve shows a consistent downward trend for nearly the entire test period, with only a minor stabilization toward the end. Maximum equity drawdown reached 37.79%, the highest of the four pairs. The win rate was 34.31% overall, with shorts at 32.79% and longs at 34.78%.
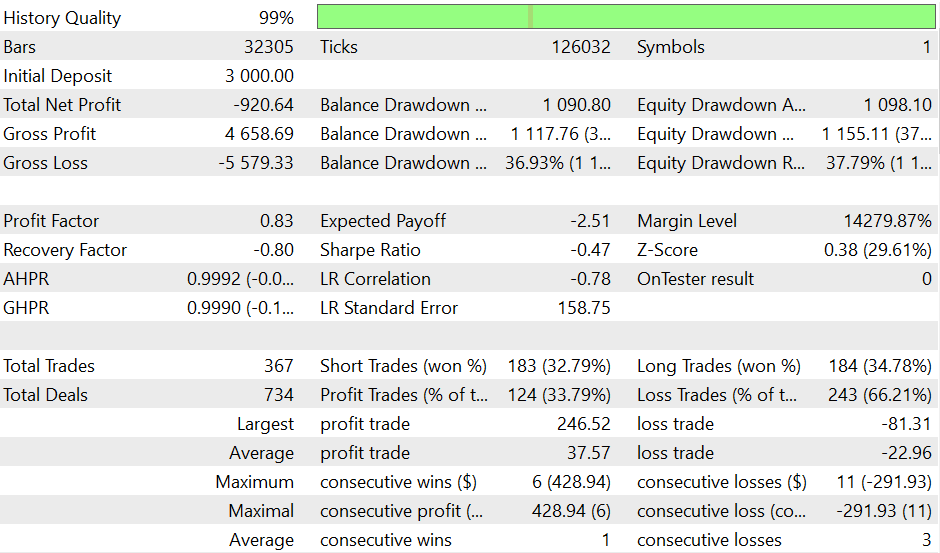
Figure 6. GBP/USD backtest
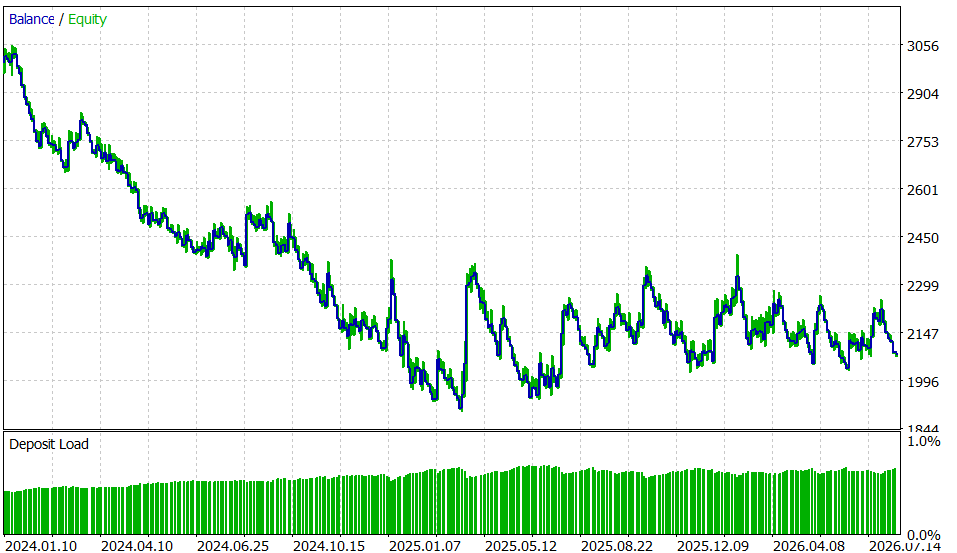
Figure 7. Equity Curve of GBP/USD
USD/JPY:
USD/JPY produced 318 trades with a net profit of $687.40, a profit factor of 1.16, and a recovery factor of 1.01 — the second-strongest result after Gold. The equity curve shows a choppier, more range-bound pattern for the first half of the test window before a clearer upward drift takes hold in the second half. Maximum equity drawdown reached 20.04%. Long trades performed notably better than shorts here, winning 44.03% of the time versus 30.82% for shorts. 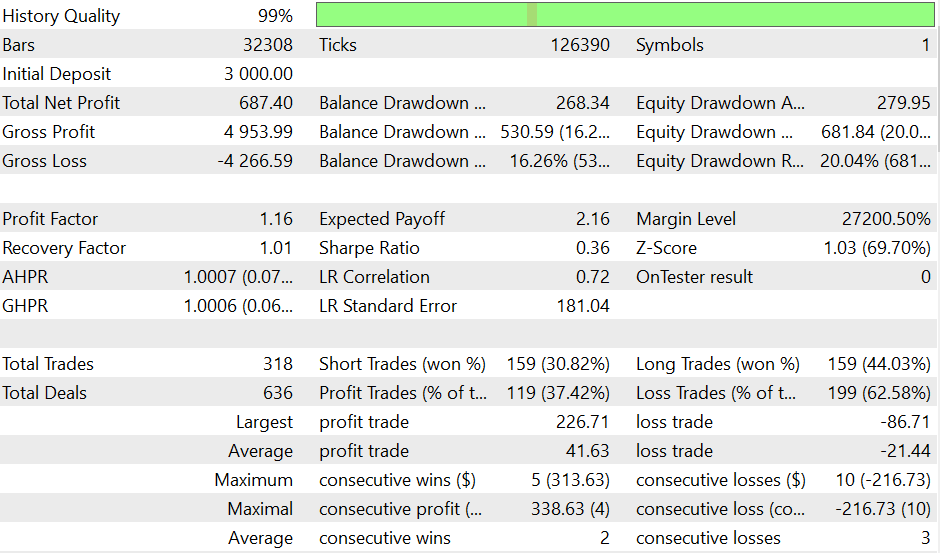
Figure 8. USD/JPY backtest
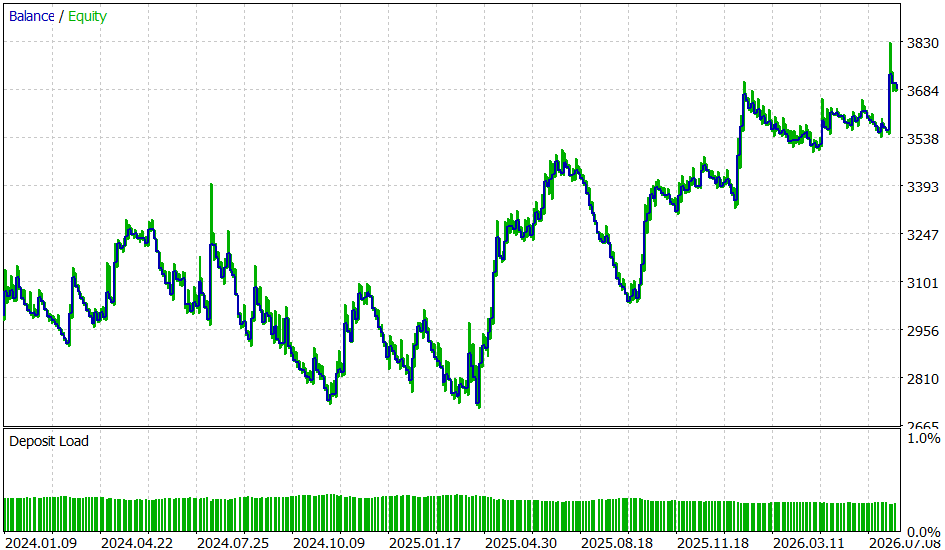
Figure 9. Equity Curve of USD/JPY
Summary table by symbol:
| Symbol | Total Trades | Net Profit | Profit Factor | Max Drawdown |
|---|---|---|---|---|
| XAU/USD | 1,685 | $1,374.91 | 1.10 | 27.57% |
| EUR/USD | 1,027 | -$332.30 | 0.78 | 12.19% |
| GBP/USD | 367 | -$920.64 | 0.83 | 37.79% |
| USD/JPY | 318 | $687.40 | 1.16 | 20.04% |
Conclusion
That's the whole system, start to finish — an ATR-based band with a ratchet and a trend flag on the indicator side, and a pure signal-following EA built directly on top of it. Nothing exotic in the underlying math, but getting the indicator to behave correctly inside MetaTrader 5's calculation model, and then reading that same signal reliably from an EA, is where the real engineering effort goes.
If you're adapting the indicator for your own use, the two things worth testing carefully before you trust it are the seed logic on first load (Piece 7) and the arrow-suppression guard on the newest bars (Piece 10) — those are the two spots most likely to need tweaking depending on your own signal timing preferences.
On the EA side, the most important thing to understand before trusting this on a live account is that it deliberately carries no stop-loss or take-profit — every position is held until the next confirmed opposite signal, whether that's minutes or many hours away. This is by design, to demonstrate the indicator's signal as directly as possible, but it also means a single adverse move against an open position is never capped until the trend itself reverses. Readers adapting this for their own use should treat this as a starting point for adding their own risk controls, not a complete trading system.
Testing across four instruments — XAU/USD, EUR/USD, GBP/USD, and USD/JPY — showed uneven performance by symbol: XAU/USD was the strongest performer by a clear margin, driven largely by a sustained move in the later part of the test window, and USD/JPY was the second-strongest. EUR/USD and GBP/USD both ended with a net loss over the test period, GBP/USD being the weaker of the two with the deepest drawdown. A single ATR period and multiplier will not necessarily fit every market equally; per-symbol tuning, and potentially adding stop-loss protection, may be worth exploring before developing this approach further.
Full Source Code of Indicator:
//+------------------------------------------------------------------+
//|                              Supertrend.mq5 BY ALI KAZIM & JAWAD |
//+------------------------------------------------------------------+
#property copyright   "2026"
#property version     "2.00"
#property strict
#property indicator_chart_window
#property indicator_buffers 7
#property indicator_plots   4

#property indicator_label1  "Up Trend"
#property indicator_type1   DRAW_LINE
#property indicator_color1  clrLime
#property indicator_style1  STYLE_SOLID
#property indicator_width1  2

#property indicator_label2  "Down Trend"
#property indicator_type2   DRAW_LINE
#property indicator_color2  clrRed
#property indicator_style2  STYLE_SOLID
#property indicator_width2  2

#property indicator_label3  "Buy"
#property indicator_type3   DRAW_ARROW
#property indicator_color3  clrLime
#property indicator_width3  3

#property indicator_label4  "Sell"
#property indicator_type4   DRAW_ARROW
#property indicator_color4  clrRed
#property indicator_width4  3

input int    InpAtrPeriod     = 10;
input double InpMultiplier    = 3.0;
input bool   InpShowSignals   = true;

//--- Indicator output buffers used for drawing trend lines and signals
double BufUp[];
double BufDn[];
double BufBuy[];
double BufSell[];

//--- Internal recursive state, registered as calculation buffers (buffers
//--- 4-6) so the terminal manages their size and bar-to-bar continuity
//--- automatically, instead of manually resized/reset arrays. sTrend is
//--- stored as a double (1.0 / -1.0) because indicator buffers must be
//--- double, and cast to int only where needed for comparisons.
double sUp[];
double sDn[];
double sTrend[];

//--- ATR indicator handle used to retrieve volatility values
int hATR = INVALID_HANDLE;

//+------------------------------------------------------------------+
//| Custom indicator initialization function                         |
//+------------------------------------------------------------------+
int OnInit()
  {
//--- Connect indicator buffers with their corresponding plots
   SetIndexBuffer(0, BufUp,   INDICATOR_DATA);
   SetIndexBuffer(1, BufDn,   INDICATOR_DATA);
   SetIndexBuffer(2, BufBuy,  INDICATOR_DATA);
   SetIndexBuffer(3, BufSell, INDICATOR_DATA);

//--- Register the recursive state as calculation buffers — the terminal
//--- keeps these correctly sized and shifted as new bars appear, which
//--- is what a plain dynamic array with manual ArrayResize() does not
//--- reliably guarantee
   SetIndexBuffer(4, sUp,    INDICATOR_CALCULATIONS);
   SetIndexBuffer(5, sDn,    INDICATOR_CALCULATIONS);
   SetIndexBuffer(6, sTrend, INDICATOR_CALCULATIONS);

//--- Define empty values so unused buffer points are not drawn
   PlotIndexSetDouble(0, PLOT_EMPTY_VALUE, EMPTY_VALUE);
   PlotIndexSetDouble(1, PLOT_EMPTY_VALUE, EMPTY_VALUE);
   PlotIndexSetDouble(2, PLOT_EMPTY_VALUE, EMPTY_VALUE);
   PlotIndexSetDouble(3, PLOT_EMPTY_VALUE, EMPTY_VALUE);

//--- Set arrow symbols for buy and sell signal plots
   PlotIndexSetInteger(2, PLOT_ARROW, 233);
   PlotIndexSetInteger(3, PLOT_ARROW, 234);

   IndicatorSetString(INDICATOR_SHORTNAME,
                      "SuperTrend(" + IntegerToString(InpAtrPeriod) + "," +
                      DoubleToString(InpMultiplier, 1) + ")");

//--- Create ATR handle required for volatility calculations
   hATR = iATR(_Symbol, PERIOD_CURRENT, InpAtrPeriod);

//--- Stop initialization if ATR handle creation fails
   if(hATR == INVALID_HANDLE)
     {
      Print("iATR create failed");
      return INIT_FAILED;
     }

   return INIT_SUCCEEDED;
  }

//+------------------------------------------------------------------+
//| Custom indicator deinitialization function                       |
//+------------------------------------------------------------------+
void OnDeinit(const int reason)
  {
//--- Release ATR resources when the indicator is removed
   if(hATR != INVALID_HANDLE)
      IndicatorRelease(hATR);
  }

//+------------------------------------------------------------------+
//| Custom indicator iteration function                              |
//+------------------------------------------------------------------+
int OnCalculate(const int rates_total,
                const int prev_calculated,
                const datetime &time[],
                const double   &open[],
                const double   &high[],
                const double   &low[],
                const double   &close[],
                const long     &tick_volume[],
                const long     &volume[],
                const int      &spread[])
  {
//--- Check that enough bars exist for ATR and recursive calculations
   if(rates_total < InpAtrPeriod + 2)
      return 0;

//--- Copy ATR values required for SuperTrend calculation
   double atr[];
   ArraySetAsSeries(atr, true);
   int copied = CopyBuffer(hATR, 0, 0, rates_total, atr);

//--- Safety Check: wait if ATR data is incomplete
   if(copied < rates_total)
      return 0;

//--- Use series indexing where index 0 represents the latest bar. Since
//--- sUp/sDn/sTrend are now terminal-managed calculation buffers, no
//--- manual ArrayResize()/ArrayInitialize() is needed or performed here —
//--- the terminal keeps their existing values correctly aligned as new
//--- bars appear, so previously calculated state is never lost.
   ArraySetAsSeries(high,  true);
   ArraySetAsSeries(low,   true);
   ArraySetAsSeries(close, true);
   ArraySetAsSeries(BufUp,   true);
   ArraySetAsSeries(BufDn,   true);
   ArraySetAsSeries(BufBuy,  true);
   ArraySetAsSeries(BufSell, true);
   ArraySetAsSeries(sUp,    true);
   ArraySetAsSeries(sDn,    true);
   ArraySetAsSeries(sTrend, true);

//--- Calculate starting position based on previous calculations
   int start = rates_total - prev_calculated;

//--- Full recalculation: clear old values and create initial state
   if(prev_calculated <= 1)
     {
      ArrayInitialize(BufUp,   EMPTY_VALUE);
      ArrayInitialize(BufDn,   EMPTY_VALUE);
      ArrayInitialize(BufBuy,  EMPTY_VALUE);
      ArrayInitialize(BufSell, EMPTY_VALUE);
      ArrayInitialize(sUp,    0);
      ArrayInitialize(sDn,    0);
      ArrayInitialize(sTrend, 0);

      //--- Create initial SuperTrend values from the oldest valid bar
      int seed = rates_total - 2;
      double hl2seed = (high[seed] + low[seed]) / 2.0;
      sUp[seed]    = hl2seed - InpMultiplier * atr[seed];
      sDn[seed]    = hl2seed + InpMultiplier * atr[seed];
      sTrend[seed] = 1.0;

      start = seed - 1;
     }
   else
     {
      //--- Recalculate current and recently closed bars during live ticks
      if(start < 1)
         start = 1;
     }

//--- Main loop: update SuperTrend bands and trend state
   for(int i = start; i >= 0; i--)
     {
      //--- Skip invalid oldest index
      if(i >= rates_total - 1)
         continue;

      //--- Calculate midpoint price and current ATR value
      double hl2   = (high[i] + low[i]) / 2.0;
      double atrVal  = atr[i];

      //--- Ignore invalid ATR values
      if(atrVal <= 0)
         continue;

      //--- Calculate basic upper and lower ATR bands
      double basicUp = hl2 - InpMultiplier * atrVal;
      double basicDn = hl2 + InpMultiplier * atrVal;

      //--- Get previous recursive SuperTrend values
      double prevUp = sUp[i + 1];
      double prevDn = sDn[i + 1];
      double prevClose = close[i + 1];

      //--- Apply SuperTrend ratchet logic
      sUp[i] = (prevClose > prevUp) ? MathMax(basicUp, prevUp) : basicUp;
      sDn[i] = (prevClose < prevDn) ? MathMin(basicDn, prevDn) : basicDn;

      //--- Determine whether trend direction changed
      int prevTrend = (int)sTrend[i + 1];
      int trend     = prevTrend;

      if(prevTrend == -1 && close[i] > prevDn)
         trend = 1;
      else
         if(prevTrend == 1 && close[i] < prevUp)
            trend = -1;
         else
            if(prevTrend == 0)
               trend = 1;

      sTrend[i] = (double)trend;

      //--- Draw the active trend line only
      if(trend == 1)
        {
         BufUp[i] = sUp[i];
         BufDn[i] = EMPTY_VALUE;
        }
      else
        {
         BufDn[i] = sDn[i];
         BufUp[i] = EMPTY_VALUE;
        }

      //--- Reset signal buffers before checking new signals
      BufBuy[i]  = EMPTY_VALUE;
      BufSell[i] = EMPTY_VALUE;

      //--- Show arrows only after trend confirmation
      if(InpShowSignals && i > 1)
        {
         if(trend == 1 && prevTrend == -1)
            BufBuy[i]  = sUp[i];
         else
            if(trend == -1 && prevTrend == 1)
               BufSell[i] = sDn[i];
        }
     }

   return rates_total;
  }
//+------------------------------------------------------------------+
Warning: All rights to these materials are reserved by MetaQuotes Ltd. Copying or reprinting of these materials in whole or in part is prohibited.
This article was written by a user of the site and reflects their personal views. MetaQuotes Ltd is not responsible for the accuracy of the information presented, nor for any consequences resulting from the use of the solutions, strategies or recommendations described.

 Foundation Models for Trading (Part II): Decoding, Autoregression, and an Exact KV-Cache
 Developing a Terminal Manager (Part 3): Getting Account Information and Adding Configuration
 Building a Basket Order Manager in MQL5 for Correlated Position Groups
 Feature Engineering for ML (Part 13): Trend-Scanning Features in Python

- Free trading apps
- Over 8,000 signals for copying
- Economic news for exploring financial markets
You agree to website policy and terms of use