

Low-Frequency Quantitative Strategies in MetaTrader 5 (Part 6): A Constant-Dollar Exposure FX Trading System Based on Fixed-Income Interest Rate Yield Differentials
 243
 0

Introduction
In 2014, Nicolas Georges, a hedge fund manager, proposed an intraday Forex trading system that does not depend on volume and is intended to work in both trending and ranging markets. Instead of relying on the usual carry-trading logic that uses government sovereign bond yields, he proposed using Interest Rate Swap (IRS) differential momentum to track currency pairs' relative variation. The system was called ANANTA.
The idea was pretty simple: instead of taking the central banks’ monetary policies as the main reference for currency portfolio management, let’s take the market expectations about the economies represented by those central banks. Instead of asking the governments how much interest rate they are willing to pay to finance their debt, let’s ask the people who buy that debt how much interest rate they think the government should offer. What are the commerce, the industry, the hedge fund managers, and other economic agents foreseeing for the economy?
A significant part of these economic agents’ answer is quoted live, all day long, on the interest rate swaps market. The system uses daily updated IRS data feeds to rebalance a portfolio of all G10 currencies plus the Danish krone (DKK).
“The G10 currencies are ten of the most heavily traded currencies in the world, which are also ten of the world's most liquid currencies. [...] There is no longer a one-to-one match between the G10 currencies and the G10 countries. [...] In some banking circles, reference is made to the G11 currencies, which are the G10 currencies plus the Danish krone (DKK).” (Wikipedia)
- USD - United States Dollar
- EUR - Euro
- JPY - Japanese Yen
- GBP - British Pound Sterling
- CHF - Swiss Franc
- AUD - Australian Dollar *
- CAD - Canadian Dollar
- NZD - New Zealand Dollar *
- SEK - Swedish Krona
- NOK - Norwegian Krone *
- DKK - Danish Krone
* Australia, New Zealand, and Norway are not part of the G10 countries. But their currencies are part of the world’s most liquid currencies.
In this article, we evaluate the system using only free IRS data feeds for the five most liquid G10 currencies: USD, Euro, GBP, JPY, and CHF.
Interest Rate Swap (IRS)
In the ANANTA system, we do not enter and exit the market according to trade signals. Instead, we stay continuously in the market, simply moving dollars from one currency to another. There is no stop-loss or volatility-based position resizing. Unlike the traditional carry trade setup of buying high-yielding currencies and selling the low-yielding ones, we use Interest Rate Swap (IRS) to gauge the short-term evolution of central banks' monetary policies. The author calls this the interest rate differential momentum.
“It is clear that the main influence on the foreign exchange market is the change in interest rates, guided by the central banks. With a slow rebalancing, this effect is captured by the carry trade. However, this paper will focus on the short-term impact of interest rate evolution, also called interest rate differential momentum.”
These IRS data feeds are NOT the same as government sovereign bond yields we can find for free on almost all central banks' websites and APIs. While the sovereign bond yields are tied to the issued government debt, the IRS is tied to OTC derivative contracts. They are different asset classes, and, what is more relevant for our trading system, they represent different market participants. While the sovereign bond yields reflect the central bank's monetary policy and are influenced by the central bank's own actions, the IRS is influenced by corporations and institutional investors, and reflects their reaction to those central bank policies, among other factors. Generally speaking, there is a regular spread between the sovereign bond yields and the IRS yields.
The system was developed in an institutional environment. It uses Bloomberg’s Composite London (CMPL) and Composite New York (CMPN) for spot currency rates. For interest rate yields, it sources data from Bloomberg’s composite swaps: ADSW2 (AUD), CDSW2 (CAD), SFSW2 (CHF), DKSW2 (DKK), EUSA2 (EUR), BPSW2 (GBP), JYSW2 (JPY), NKSW2 (NOK), NDSW2 (NZD), SKSW2 (SEK), and USSW2 (USD). These are real-time data feeds built from multiple contributors around the world and used to set the benchmark interest rate swaps. They are relatively expensive proprietary data feeds.
It makes no sense to propose an FX trading system evaluation that would be accessible only to those who can pay for data. We have found only one trustworthy source of free historical IRS data at Investing.com. However, it does not include all G11 currencies; only the most liquid ones: USD, euro, GBP, JPY, and CHF. These are the currencies we are using in the backtests that follow.
What if you have access to IRS data for AUD, CAD, NZD, NOK, and DKK? If you have access to this data and want to run an evaluation with all G10 currencies, you can just include them via the InpCustomUniverse input parameter. The Expert Advisor is ready to accept the inclusion of any other IRS data feed, provided their CSV files follow the same data shape and formatting used in the samples attached at the bottom of the article.
EURAB6E2Y= Overview.csv
"Date","Price","Open","High","Low","Change %"
"10/02/2026","3.421","3.414","3.459","3.355","-0.38%"
"10/01/2026","3.434","3.533","3.598","3.386","-2.88%"
"09/30/2026","3.536","3.581","3.598","3.516","-1.42%"
AnantaEA.mq5
sinput group "=== IRS Dataset Configuration ==="
input ENUM_IRS_STORAGE_LOCATION InpIRSLocation       = IRS_STORAGE_COMMON_FILES;     // IRS Data Location (Common or Local Files)
input string                    InpIRSFolder         = ANANTA_DEFAULT_FOLDER;        // Relative IRS Folder Path
input string                    InpUSD_IRS_File      = "USDSB3L2Y= Overview.csv";    // USD 2Y IRS CSV Filename
input bool                      InpUseCustomUniverse = false;                        // Use Custom Currency Universe String
input string                    InpCustomUniverse    = "EUR:EURUSD:0:EURAB6E2Y= Overview.csv;GBP:GBPUSD:0:GBPSB6L2Y= Overview.csv;JPY:USDJPY:1:JPYSB6L2Y= Overview.csv;CHF:USDCHF:1:CHFAB6L2Y= Overview.csv"; // Custom Universe (CCY:SYMBOL:INVERTED:CSV;…)
Implementation
The current implementation is composed of seven headers, besides the main Expert Advisor. Five of these headers contain the following components:
- Regular MQL5 definitions (Defines.mqh),
- support functions, such as reading CSV files (CsvYieldReader.mqh), or managing the synchronization between the broker server time and the London Stock Exchange closing time (RebalanceTimer.mqh),
- and order triggering (TradeExecution.mqh) or position sizing (PortfolioExposure.mqh).
The core strategy implementation is distributed between
- YieldMatrix.mqh
- and SignalEngine.mqh.
By examining these two files, we can clearly see how the system works.
The system’s trading hypothesis is that, instead of trading central banks' interest rates, as the traditional carry trade does, we can trade the interest rate expectations for a given time horizon, a 2-year time horizon, in this case. The 2-year interest rate swap reflects the collective market expectations of where the interest rate will be over the next two years. So, our first step is to compare each country's 2-year IRS with each other country’s IRS and calculate the spread between each of them.

Fig 1 - Interest Rate Swap (IRS) differential formula (simple subtraction)
Where i and j are countries and j > i. It is a simple subtraction operation that gives us the raw spread (IRS differential). For example, if the US 2-year yield is 4.95% and the Eurozone 2-year yield is 3.42%,
diff(EUR,USD)=4.95 − 3.42 = +1.53%
Throughout this article, for a pair (ccy1, ccy2), we define
diff(ccy1, ccy2) = yield(ccy2) - yield(ccy1)
Therefore, a positive momentum signal favors ccy2 over ccy1 in the page-4 momentum logic used here.
We use our CYieldMatrix class to store and retrieve the differential series.
YieldMatrix.mqh
// Fetch the historical yield differential over the last X trading days double diff_series[]; double current_diff = 0.0; if(!m_matrix.GetHistoricalDiffSeries(country1_idx, country2_idx, target_date, m_sma_period, diff_series, current_diff)) { Print("Failed to fetch differential series"); return false; } (…) // Fetch historical yield difference series between two currencies over the last X trading days // diff[t] = yield(ccy2, t) - yield(ccy1, t) bool GetHistoricalDiffSeries(const int ccy1_idx, const int ccy2_idx, const datetime target_date, const int window_days, double &diff_series[], double ¤t_diff) const { if(ccy1_idx < 0 || ccy1_idx >= m_currency_count || ccy2_idx < 0 || ccy2_idx >= m_currency_count) return false; int cal_idx = FindCalendarIndex(target_date); if(cal_idx < 0) return false; // Ensure we have at least window_days available in calendar int actual_window = window_days; if(cal_idx + 1 < actual_window) actual_window = cal_idx + 1; if(actual_window <= 0) return false; ArrayResize(diff_series, actual_window); int start_idx = cal_idx - actual_window + 1; for(int w = 0; w < actual_window; w++) { datetime d = m_calendar[start_idx + w]; double y1 = 0, y2 = 0; if(!m_readers[ccy1_idx].GetYield(d, y1) || !m_readers[ccy2_idx].GetYield(d, y2)) return false; diff_series[w] = y2 - y1; } current_diff = diff_series[actual_window - 1]; return true; }
Continuing with the example above, is an IRS differential of +1.53% bullish or bearish for the Euro? Unlike sovereign bond yields, for this strategy, the raw differential is interpreted relative to its recent history rather than in absolute terms. For the current spread to have significance, we need context: how does it compare to recent days? To make sense of this IRS differential's relative significance, we calculate a Simple Moving Average (SMA) of its values for the last X days.
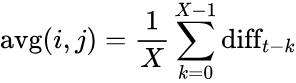
Fig. 2 – IRS differential SMA formula
Where X=2 for the short-term model, and X=15 for the long-term model. If X=2, the moving average is just the average of today’s spread and yesterday’s spread.

Fig. 3 – Average spread formula
And just to be crystal clear, observe that the difference between today's spread and this 2-day average is:

Fig. 4 – Difference between current spread and a 2-day SMA
This is half of the one-day speed of change. We are measuring the IRS momentum.
SignalEngine.mqh
            int series_len = ArraySize(diff_series);
            double sum = 0.0;
            for(int k = 0; k < series_len; k++)
               sum += diff_series[k];

            double avg = (series_len > 0) ? (sum / (double)series_len) : current_diff;
The system’s author called this momentum calculated for each currency a sub-signal. To normalize it for the different currency pairs, the sub-signal (the momentum) is expressed as a percentage of the average.

Fig. 5 – Sub-signal formula
SignalEngine.mqh
            // Sub-signal formula: (diff - avg) / |avg|
            double denom = MathAbs(avg);
            double sub_sig = 0.0;
            if(denom >= m_epsilon)
               sub_sig = (current_diff - avg) / denom;
            else
               sub_sig = (current_diff - avg); // Fallback if avg is zero/near-zero

            sub_signals[pair_idx].country1_idx   = i;
            sub_signals[pair_idx].country2_idx   = j;
            sub_signals[pair_idx].country1       = c1.currency;
            sub_signals[pair_idx].country2       = c2.currency;
            sub_signals[pair_idx].diff           = current_diff;
            sub_signals[pair_idx].avg            = avg;
            sub_signals[pair_idx].sub_signal     = sub_sig;
            sub_signals[pair_idx].abs_sub_signal = MathAbs(sub_sig);
            sub_signals[pair_idx].sign           = (sub_sig >= 0.0) ? 1 : -1;
            sub_signals[pair_idx].passed_filter  = false;

            abs_values[pair_idx] = MathAbs(sub_sig);
            pair_idx++;
This calculation gives us the first rough information about which positions should be increased/decreased in our portfolio. The table below illustrates the process with made-up rounded numbers. For clarity, we are using a single pair, the EUR/USD.
| day | EUR yield | USD yield | diff | 2-day avg | normalization | sub-signal | EUR/USD direction |
|---|---|---|---|---|---|---|---|
| Mon | 4 | 4 | 0 | - | - | - | - |
| Tue | 3 | 13 | 10 | 5 | (10-5)/5 | +100% | +1 buy |
| Wed | 2 | 22 | 20 | 15 | (20-15)/15 | +33% | +1 buy |
| Thu | 17 | 7 | 10 | 15 | (10-15)/15 | -33% | -1 sell |
Table 1 - illustrative ANANTA calculations with made-up round numbers
The sub-signal absolute value tells us how unusual the movement is. The sign tells us its direction.
+100% means the difference is much higher than its recent average.
+33% means it is somewhat higher than its average.
-33% means it is lower than its average.
The negative sign says that the Day 2 difference moved downward relative to its recent average.
It is easy to see that each pair will produce sub-signals every single business day. However, we do not want to trade every single sub-signal. That would be inefficient. The transaction costs, spreads, and commissions would eat most of our profit, and most of the sub-signals are nothing more than market noise. To avoid making our strategy unprofitable due to excessive transaction costs, we need to filter these sub-signals to trade only those that reflect an IRS spread change large enough to cover the costs of moving our capital from one currency pair to another. The system uses the 50th percentile as a threshold. We will discard the bottom 50% of the weakest signals and keep only the strongest ones, the top 50%.
For our purposes here, we can use the median as the 50th percentile and use the Alglib::SampleMedian function from the MQL5 Alglib native implementation.
SignalEngine.mqh
#include <Math\Alglib\alglib.mqh>

// Vector holding the absolute strength of each pairwise signal
double abs_values[];
ArrayResize(abs_values, total_pairs);

for(int p = 0; p < total_pairs; p++)
{
   abs_values[p] = MathAbs(sub_signals[p].sub_signal);
}

// Compute the exact 50th percentile (median) using Alglib
double p50 = 0.0;

CAlglib::SampleMedian(abs_values, total_pairs, p50);

// Filter: retain only pairs that equal or exceed the median
for(int p = 0; p < total_pairs; p++)
{
   if(sub_signals[p].abs_sub_signal >= p50)
   {
      sub_signals[p].passed_filter = true; // Qualified!
   }
   else
   {
      sub_signals[p].passed_filter = false; // Discarded as noise
   }
}
The practical effect of this 50th-percentile filter is easy to understand. Let’s suppose these absolute sub-signal sizes: 10%, 20%, 33%, 50%, and 100%. The middle value (50th percentile) is 33%. The 10% and 20% sub-signals are discarded. We only keep the 33%, 50%, and 100% sub-signals. These sub-signals are aggregated into the final individual currency positions (+1/-1) against the USD, because it is our reference currency. The netting rule is that: for a positive pair signal, the first currency receives +1 and the second receives -1. For a negative pair signal, the first receives -1 and the second receives +1.
Positive sub-signal: EUR gets +1, USD gets -1
Negative sub-signal: EUR gets -1, USD gets +1
The +1 and -1 are directions, not percentages.
SignalEngine.mqh
      // 4. Directional Netting of Retained Sub-Signals
      for(int p = 0; p < total_pairs; p++)
      {
         if(sub_signals[p].abs_sub_signal >= p50)
         {
            sub_signals[p].passed_filter = true;
            int s = sub_signals[p].sign;

            int c1_inst = FindInstrumentIndex(instrument_signals, sub_signals[p].country1);
            int c2_inst = FindInstrumentIndex(instrument_signals, sub_signals[p].country2);

            if(m_logic == SIGNAL_LOGIC_PAGE4_MOMENTUM)
            {
               // diff = yield(c2) - yield(c1). If diff > avg (s = +1), country 2 yield rose relative to country 1.
               // Page 4 Hypothesis: buy currency with rising yield (c2), sell currency with falling yield (c1).
               if(c1_inst >= 0)
                  instrument_signals[c1_inst].raw_signal -= s;
               if(c2_inst >= 0)
                  instrument_signals[c2_inst].raw_signal += s;
            }
A summary of the process:
- We start with pairwise IRS differences.
- Then, we calculate a 2-day (or 15-day) moving average for each difference and normalize the results into a sub-signal.
- Next, we get the 50th percentile of the absolute sub-signals and discard those below it to trade only the strongest movements.
- Finally, we net (add and subtract) the directions for each non-USD currency.
This will give us a rebalancing table like this, which will be printed on the MetaTrader 5 log:
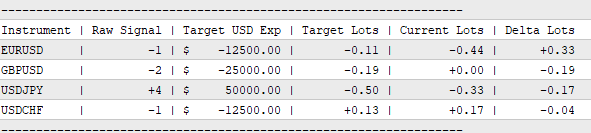
Fig. 6 - Final rebalancing signal example printed on the MetaTrader 5 log
In this example, JPY appears as a base or quote currency in four pairs that passed the 50th percentile filter, and all contributions were positive. Again, the totals are NOT percentages and NOT direct trade sizes. They are direction counts. The greater the absolute number, the greater the number of pair signals that contributed in that direction, like points in a game. A greater positive number indicates more points to buy against the dollar; conversely, a greater negative number indicates more points to sell against the dollar.
At the end, we will have 4 non-USD currency signals for portfolio rebalancing.
FX spot data and IRS data alignment
Because we are dealing with data from several territories, no matter where we source our data from, or which timeframe we are operating on, the data is subject to misalignment when one of the sources has no data for a given timestamp. It can be due to an expected reason, like a local bank holiday, or it can be due to unexpected data gaps.
The class CYieldMatrix produces an aligned chronological calendar and forward-fills the latest available closing yields for any data gap.
YieldMatrix.mqh
//+------------------------------------------------------------------+
//| Class to manage multi-currency yield data and calendar sync      |
//+------------------------------------------------------------------+
class CYieldMatrix
{
private:
   SCurrencyConfig    m_configs[];
   CCsvYieldReader    m_readers[];
   int                m_currency_count;

   // Unified sorted trading calendar (distinct dates)
   datetime           m_calendar[];
   int                m_calendar_count;

(…)

   // Build unified trading calendar from all currency dates
   void BuildUnifiedCalendar()
   {
      ArrayResize(m_calendar, 0);
      m_calendar_count = 0;
      int capacity = 5000;
      ArrayResize(m_calendar, capacity);

      for(int c = 0; c < m_currency_count; c++)
      {
         int count = m_readers[c].Total();
         for(int i = 0; i < count; i++)
         {
            datetime d;
            double p;
            if(m_readers[c].GetRecord(i, d, p))
            {
               if(m_calendar_count >= capacity)
               {
                  capacity += 2000;
                  ArrayResize(m_calendar, capacity);
               }
               m_calendar[m_calendar_count++] = d;
            }
         }
      }

      if(m_calendar_count == 0)
         return;

      ArrayResize(m_calendar, m_calendar_count);

      // Sort calendar dates ascending
      ArraySort(m_calendar);

      // De-duplicate dates
      int unique_count = 1;
      for(int i = 1; i < m_calendar_count; i++)
      {
         if(m_calendar[i] != m_calendar[unique_count - 1])
         {
            m_calendar[unique_count++] = m_calendar[i];
         }
      }

      m_calendar_count = unique_count;
      ArrayResize(m_calendar, m_calendar_count);

      PrintFormat("[CYieldMatrix] Built unified calendar with %d unique trading days (%s to %s)",
                  m_calendar_count,
                  TimeToString(m_calendar[0], TIME_DATE),
                  TimeToString(m_calendar[m_calendar_count - 1], TIME_DATE));
   }
It is in this same class that we set up our portfolio.
  // Setup standard 5 liquid currencies (USD, EUR, GBP, JPY, CHF)
   void SetupDefaultUniverse()
   {
      Clear();
      // Reference Currency: USD
      AddCurrency("USD", "",       true,  false, "USDSB3L2Y= Overview.csv");
      // Liquid G10 vs USD:
      AddCurrency("EUR", "EURUSD", false, false, "EURAB6E2Y= Overview.csv");
      AddCurrency("GBP", "GBPUSD", false, false, "GBPSB6L2Y= Overview.csv");
      AddCurrency("JPY", "USDJPY", false, true,  "JPYSB6L2Y= Overview.csv");
      AddCurrency("CHF", "USDCHF", false, true,  "CHFAB6L2Y= Overview.csv");
   }
If you have access to IRS data for all G10 currencies, it is in the above snippet that you can add them.
The portfolio rebalancing frequency
The original system rechecks the G10 currencies portfolio twice a day for rebalancing at London and New York close. The London close is the main checkpoint when the bulk of changes are made. The New York close allows for small adjustments or to capture eventual late-day interest rate shocks.
“[...] the rebalancing is done in 2 steps: a first snapshot of the interest data at the London close and rebalancing the portfolio at that time (this also coincides with the maximum of liquidity in the FX market and more aggressive spreads), then a second snapshot at the New York close and readjusting again. Variations in interest rate differentials tend to be limited between London close and New York close times, making the adjustments at New York time marginal. In the event of a major move in interest rates just before New York closes, a more substantial adjustment of the portfolio will take place.”
Since the free data we are using is updated only once a day, our backtests are checking for rebalances once a day too, on the London close.
RebalanceTimer.mqh
//+------------------------------------------------------------------+
//|                                               RebalanceTimer.mqh |
//|                             Copyright 2000-2026, MetaQuotes Ltd. |
//|                                                     www.mql5.com |
//+------------------------------------------------------------------+

#property copyright "Copyright 2000-2026, MetaQuotes Ltd."
#property link      "https://www.mql5.com"

#ifndef __ANANTA_REBALANCE_TIMER_MQH__
#define __ANANTA_REBALANCE_TIMER_MQH__

#include "Defines.mqh"

//+------------------------------------------------------------------+
//| Session and Daily Rebalancing Timing Module                      |
//+------------------------------------------------------------------+
class CRebalanceTimer
{
private:
   ENUM_TIMEFRAMES m_timeframe;
   int             m_rebalance_hour_utc;  // London close is 16:00 UTC
   int             m_broker_gmt_offset;   // Broker server GMT offset (e.g. +2 in winter, +3 in summer)
   datetime        m_last_rebalance_day;  // Normalized date of the last triggered rebalance
   datetime        m_last_bar_time;       // Bar open time tracking for new bar detection

public:
   CRebalanceTimer() : m_timeframe(PERIOD_H1),
                       m_rebalance_hour_utc(16),
                       m_broker_gmt_offset(2),
                       m_last_rebalance_day(0),
                       m_last_bar_time(0)
   {
   }
   void SetTimeframe(const ENUM_TIMEFRAMES tf) { m_timeframe = tf; }
   void SetRebalanceHourUTC(const int utc_hour) { m_rebalance_hour_utc = (utc_hour >= 0 && utc_hour < 24) ? utc_hour : 16; }
   void SetBrokerGMTOffset(const int offset) { m_broker_gmt_offset = offset; }
   int GetRebalanceHourUTC() const { return m_rebalance_hour_utc; }
   int GetBrokerGMTOffset() const { return m_broker_gmt_offset; }

   // Calculate expected broker server hour for 16:00 UTC
   int GetBrokerTargetHour() const
   {
      int target_hour = (m_rebalance_hour_utc + m_broker_gmt_offset) % 24;
      if(target_hour < 0)
         target_hour += 24;
      return target_hour;
   }

   // Check if a new rebalance should trigger on the current tick / bar
   bool IsRebalanceTime(const string symbol)
   {
      // 1. Check for New Bar on the configured timeframe
      datetime bar_time = iTime(symbol, m_timeframe, 0);

      if(bar_time == 0)
         return false;

      if(bar_time == m_last_bar_time)
         return false; // Still within the same bar, already evaluated

      m_last_bar_time = bar_time;
      datetime now = TimeCurrent();
      datetime today_date = now - (now % SECONDS_PER_DAY);
      // If running on Daily timeframe (D1), trigger once on each new daily bar
      if(m_timeframe >= PERIOD_D1)
      {
         if(today_date != m_last_rebalance_day)
         {
            m_last_rebalance_day = today_date;
            return true;
         }
         return false;
      }

      // If running Intraday (e.g. H1, M30, M15):
      // Check if current server hour matches the London close reference hour
      MqlDateTime dt;
      TimeToStruct(now, dt);
      int target_hour = GetBrokerTargetHour();

      if(dt.hour == target_hour)
      {
         if(today_date != m_last_rebalance_day)
         {
            m_last_rebalance_day = today_date;
            PrintFormat("[CRebalanceTimer] Daily London Session Rebalance triggered at Broker Time %s (UTC ~%02d:00)",
                        TimeToString(now, TIME_DATE | TIME_MINUTES), m_rebalance_hour_utc);
            return true;
         }
      }
      return false;
   }

   // Force trigger (for manual testing or initial sync)
   void Reset()
   {
      m_last_rebalance_day = 0;
      m_last_bar_time = 0;
   }
};

#endif // __ANANTA_REBALANCE_TIMER_MQH__
The broker GMT offset is a configurable input parameter that must be set according to the broker server time.
The backtest
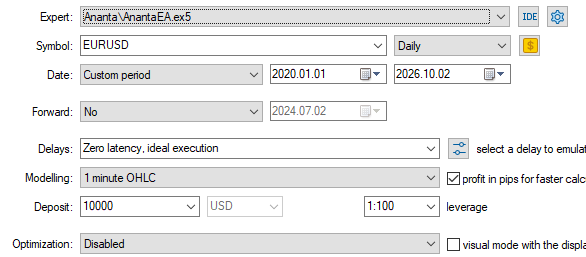
Fig. 7 - Backtest settings.
We let the EA use its input parameter defaults, the same settings you will find in the backtest settings INI file attached in the article. Since we are backtesting in the daily timeframe, we used “1 minute OHLC” modelling to speed up the first check. But we repeated the backtest with “every tick” modelling, just in case (see below).
The backtest results with OHLC modelling.
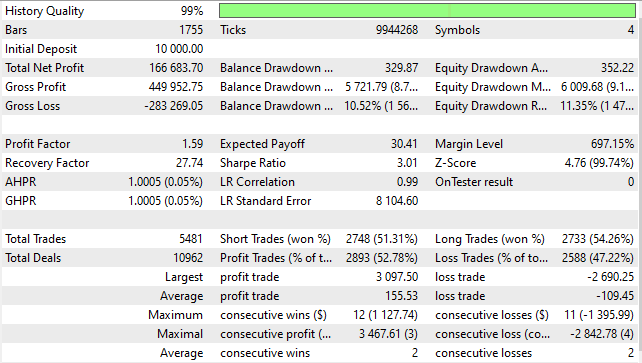
Fig. 8 - Backtest results (OHLC modelling).
The comparison between the OHLC modelling and the every-tick modelling shows that you can safely experiment and iterate with the faster OHLC modelling for the daily timeframe and use the slowest and most accurate every-tick modelling in the final steps of your implementation.
The Balance/Equity graph with OHLC modelling.
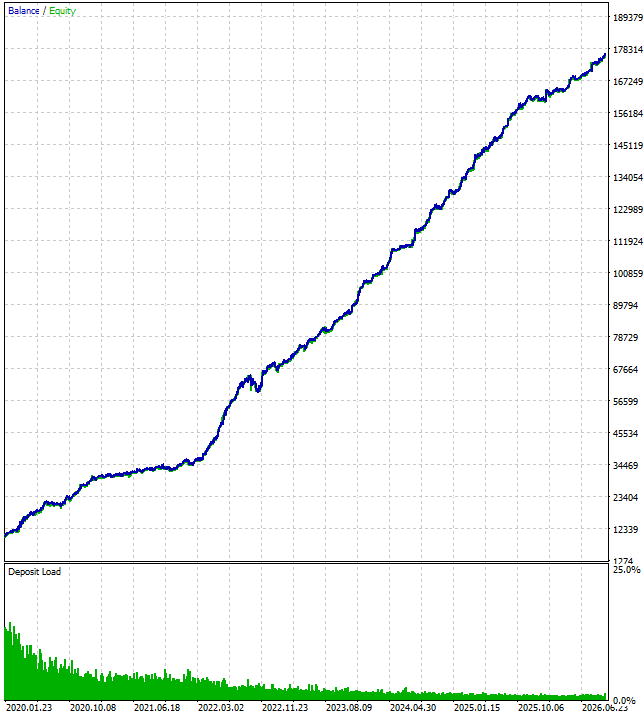
Fig. 9 - The Balance/Equity graph (OHLC modelling).
Backtest results with every-tick modelling.
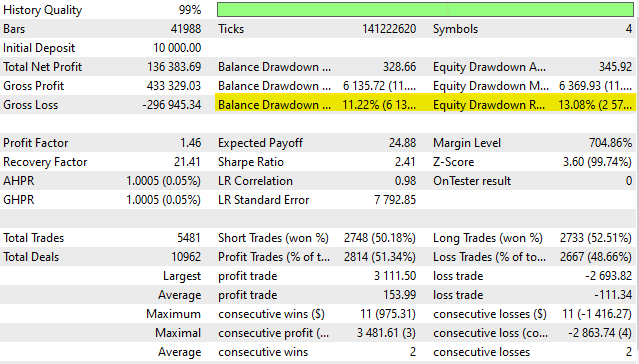
Fig. 10 - The backtest results.
The equity graph with every-tick modelling.
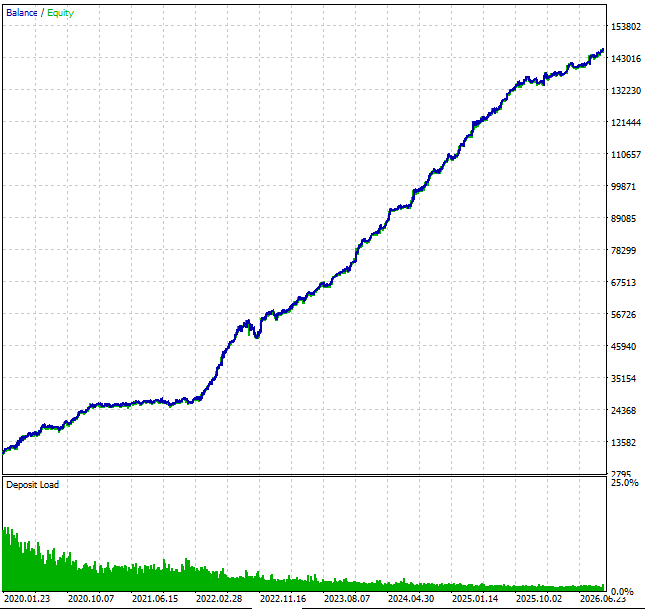
Fig. 11 - The Balance/Equity Graph.
Although the system was developed more than ten years ago, it showed stable growth for the whole six-year period. The only exception was the months around mid-2022. As a system developed in an institutional environment, it has a relatively low max balance drawdown of ~11%.
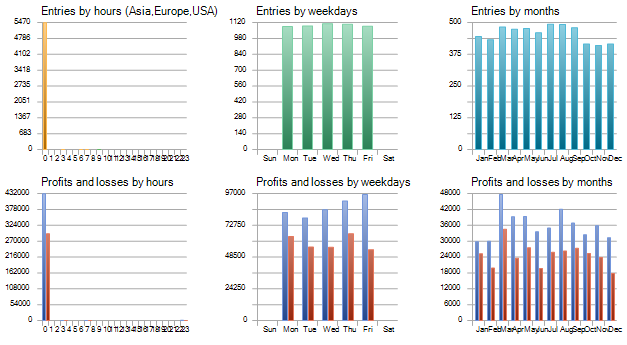
Fig. 12 - The position entry times.
As expected, the entries are evenly distributed across all the weekdays and months.
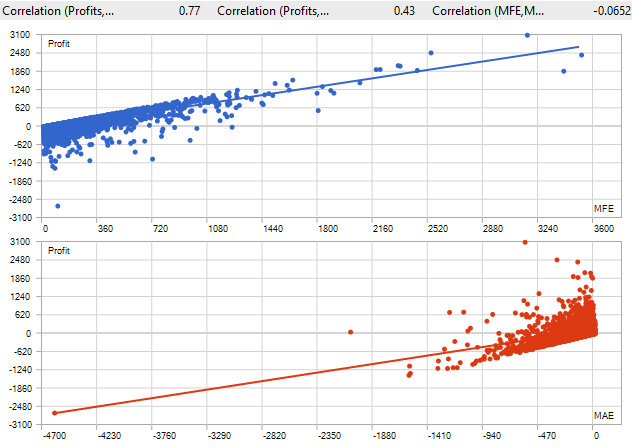
Fig. 13 - The MFE/MAE plots.
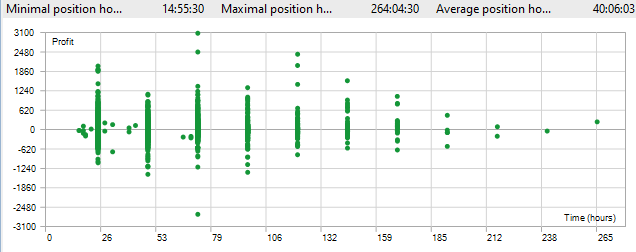
Fig. 14 - The position holding times.
Note that the EA was developed with the single purpose of accurately evaluating the proposed system. It is NOT a production-ready product. It does NOT implement the required checks for properly interacting with different brokers, nor does it implement the required checks to be approved in the MQL5 Market.
Conclusion
In this article, we evaluated ANANTA, a quantitative Forex trading system that tracks fixed-income interest rate swap variation to estimate currencies’ buying or selling pressure. Instead of trading each pair individually, the original system operates by rebalancing a constant-dollar exposure portfolio of G10 currencies.
In this implementation, due to our self-imposed requirement of only using free IRS data sources, we restricted the currency pairs to the five most liquid ones: USD, EUR, GBP, JPY, and CHF. We also changed the original system’s twice-a-day rebalancing to once-a-day rebalancing, since our free IRS data source is only updated once a day.
The system showed stable equity growth, with a Sharpe Ratio of 2.41, a Z-Score of 3.60, and a max balance drawdown of ~11%.
The current implementation is flexible enough to accommodate the full currency universe by adding one configuration line per currency.
The IRS data used in the backtests are compiled in CSV files attached to the article for easy reproduction of the experiment.
References
Georges, Nicolas. ANANTA: A Systematic Quantitative FX Trading Strategy. Working Paper, Apr. 2014.
USD 2-years Interest Rate Swap historical data
EUR 2-years Interest Rate Swap historical data
GBP 2-years Interest Rate Swap historical data
JPY 2-years Interest Rate Swap historical data
CHF 2-years Interest Rate Swap historical data
| Filename | Description |
|---|---|
| MQL5/Experts/Ananta/AnantaEA.mq5 | Strategy Expert Advisor |
| MQL5/Files/Ananta/irs/CHFAB6L2Y= Overview.csv | CSV file with IRS feed for Swiss Franc |
| MQL5/Files/Ananta/irs/EURAB6E2Y= Overview.csv | CSV file with IRS feed for Euro |
| MQL5/Files/Ananta/irs/GBPSB6L2Y= Overview.csv | CSV file with IRS feed for British Pound |
| MQL5/Files/Ananta/irs/JPYSB6L2Y= Overview.csv | CSV file with IRS feed for Yen |
| MQL5/Files/Ananta/irs/USDSB3L2Y= Overview.csv | CSV file with IRS feed for US Dollar |
| MQL5/Include/Ananta/CsvYieldReader.mqh | CSV Reader class header |
| MQL5/Include/Ananta/Defines.mqh | Global definitions header |
| MQL5/Include/Ananta/PortfolioExposure.mqh | Portfolio exposure control class header |
| MQL5/Include/Ananta/RebalanceTimer.mqh | Rebalance timer class header |
| MQL5/Include/Ananta/SignalEngine.mqh | Signal engine class header |
| MQL5/Include/Ananta/TradeExecution.mqh | Trade execution class header |
| MQL5/Include/Ananta/YieldMatrix.mqh | Yield matrix class header |
| MQL5\AnantaEA.EURUSD.Daily.20200101_20261002.100.ini | Backtest settings INI file |
Warning: All rights to these materials are reserved by MetaQuotes Ltd. Copying or reprinting of these materials in whole or in part is prohibited.
This article was written by a user of the site and reflects their personal views. MetaQuotes Ltd is not responsible for the accuracy of the information presented, nor for any consequences resulting from the use of the solutions, strategies or recommendations described.

 MetaTrader 5 Machine Learning Blueprint (Part 24): Sequence Risk
 Neural Networks in Trading: Recurrent Modeling of Market Micromovements (EV-MGRFlowNet)
 Entropy Pooling and Scenario Budgets for Expected-Shortfall Sizing
 Building a Two-Pole Momentum Oscillator in MQL5

- Free trading apps
- Over 8,000 signals for copying
- Economic news for exploring financial markets
You agree to website policy and terms of use