

Building a Volume Profile Aggregator from Tick Data in MQL5
 422
 0

Introduction
Volume profile shows a trader where the market actually did business, not merely where price passed through. A candlestick tells you open, high, low, and close for an interval. A volume profile tells you how much volume traded at every price level inside that interval. The price bin with the most volume, the point of control, often draws renewed interest in later price action, though this article does not test that tendency directly. The value area around it marks where the bulk of trading activity actually happened.
Building that profile from raw ticks is expensive if done carelessly. A liquid instrument can generate well over a hundred thousand ticks in a session. Matching each tick against a list of candidate price levels costs O(n × m) work, where n is the tick count and m is the number of price levels. With a few hundred bins, that nested comparison runs into tens of millions of checks. Section 1 measures that cost on a full day of live ticks. The nested loop took 27 to 59 milliseconds per pass, against 1.4 to 3 milliseconds for direct indexing, and the nested loop's cost grows with the bin count while direct indexing's does not.
Not every broker supplies trade volume. On symbols where it is missing, the aggregator counts each tick as one unit, so the profile shows how often price updated at each level instead of how much traded there. Section 11 returns to this limit.
This article builds an aggregator that skips the nested loop entirely. It computes each tick's bin index directly from price and keeps the bin width a whole multiple of the instrument's tick size, whether it is derived automatically or set by the user. That turns matching into simple arithmetic on the instrument's tick-size grid. Every timing figure and tick count quoted below comes from live runs on real broker feeds, with every pipeline stage timed separately rather than only the aggregation step. Section 1 benchmarks the binning step against a nested loop on a full day of live ticks. Section 9 reports a 35-minute run of the complete pipeline. Both ran on one MetaQuotes-Demo server and one machine, so they show how the code behaves under real tick delivery and terminal conditions, not that the implementation handles every condition correctly.
This article builds on an earlier piece of mine, "Automatic Session Volume Profile Builder in MQL5: Rendering POC and Value Area Without Third-Party Tools." That article relies on a session-preset indicator and the standard Point of Control, Value Area High, and Value Area Low expansion algorithm. This article reuses that same expansion algorithm. What differs here is how the profile gets built. Session-day aggregation runs from an Expert Advisor timer rather than from an indicator. Bin width is sized adaptively for each instrument rather than fixed. Section 3 also covers the tick-loading resilience work needed to keep that aggregation stable across different brokers and instruments, and Section 9 summarizes what testing revealed.
Volume Profile Aggregator Pipeline
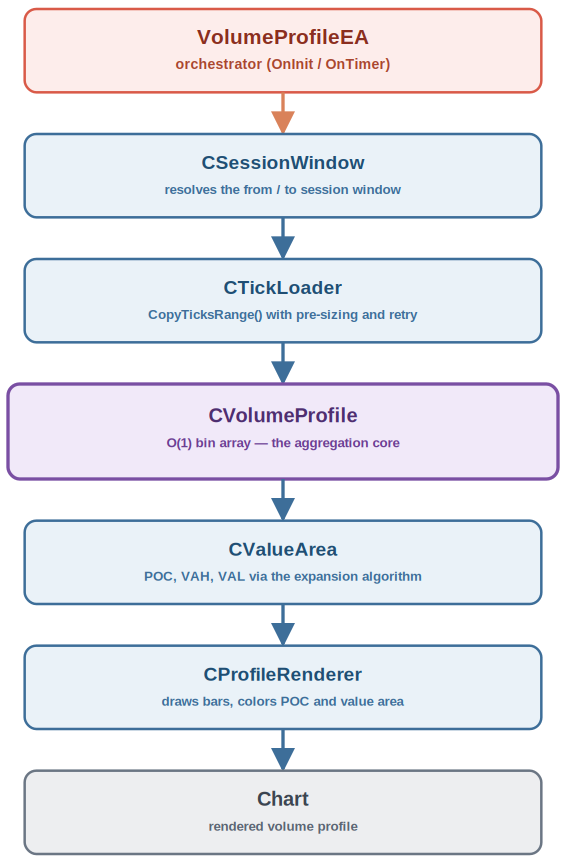
Volume Profile Aggregator Pipeline — A top-down view of the five-class pipeline, orchestrated by VolumeProfileEA: CSessionWindow resolves the current server calendar day, CTickLoader pulls raw ticks, CVolumeProfile aggregates them into price bins in O(1) per tick, CValueArea computes the POC and value area, and CProfileRenderer draws the result to the chart.
Section 1: Why O(1) Binning Beats Nested Loops
Picture the naive approach first. For each of the n ticks, you loop over the m price levels, compare the tick price against each boundary, and increment the matching bin. With a fine bin size and a wide price range, m can reach several hundred. A session with roughly two hundred thousand ticks and a few hundred bins produces tens of millions of individual checks. The benchmark at the end of this section measures what that costs.
The fix rests on a simple observation. Price bins on a tick-size grid are evenly spaced. That means the bin containing any given price can be computed directly instead of searched for. If price_min is the bottom of the grid and bin_size is the width of one bin, the index is (price - price_min) / bin_size, rounded to the nearest integer. One subtraction, one division, one round. Constant time, regardless of how many bins exist. A single aggregation pass over the n ticks, each doing O(1) work, replaces the O(n × m) nested loop with O(n). This replaces the matching step alone. The full pipeline run by the Expert Advisor layers several more O(n) and O(m) stages around this core sweep, covered stage by stage in Section 7.
To measure the difference, I ran both methods on the same ticks. BenchNaiveVsDirect.mq5 loads the server-day ticks for the chart symbol, sizes the bins exactly as the Expert Advisor does, and times two aggregations. The nested loop takes each tick and tests it against each bin's boundaries until one matches. The direct method is CVolumeProfile::Aggregate(). Each method runs five times, and the script counts the bins on which the two results differ. Only the aggregation step is timed, not loading or scanning. The script waits and asks again if the terminal has not yet synchronized the day's ticks, because a script, unlike the Expert Advisor's timer, only asks once.
//+------------------------------------------------------------------+
//|                                           BenchNaiveVsDirect.mq5 |
//+------------------------------------------------------------------+
#property script_show_inputs

#include <VolumeProfileAggregator/SessionWindow.mqh>
#include <VolumeProfileAggregator/TickLoader.mqh>
#include <VolumeProfileAggregator/VolumeProfile.mqh>

input int InpTargetBins = 200;   // approximate bin count
input int InpRuns       = 5;     // timed repetitions per method
input int InpMaxWaitRounds = 15; // tick sync attempts, 2 s apart

//+------------------------------------------------------------------+
//| TickVolume: same volume rule as CVolumeProfile::AddTick          |
//+------------------------------------------------------------------+
double TickVolume(const MqlTick &tick)
  {
   double vol = (tick.volume_real > 0.0) ? tick.volume_real : 1.0;
   if(tick.volume > 0 && tick.volume_real <= 0.0)
      vol = (double)tick.volume;
   return(vol);
  }

//+------------------------------------------------------------------+
//| NaiveAggregate: for every tick, test every bin boundary          |
//+------------------------------------------------------------------+
void NaiveAggregate(const MqlTick &ticks[], const int count, const double price_min,
                    const double bin_size, const int bins, double &out[])
  {
   ::ArrayResize(out, bins);
   ::ArrayInitialize(out, 0.0);
   for(int i = 0; i < count; i++)
     {
      double p = ResolveTickPrice(ticks[i]);
      if(p <= 0.0)
         continue;
      for(int j = 0; j < bins; j++)
        {
         double lo = price_min + (j - 0.5) * bin_size;
         double hi = price_min + (j + 0.5) * bin_size;
         bool   in_bin = (j == 0 || p >= lo) && (j == bins - 1 || p < hi);
         if(in_bin)
           {
            out[j] += TickVolume(ticks[i]);
            break;
           }
        }
     }
  }

//+------------------------------------------------------------------+
//| OnStart                                                          |
//+------------------------------------------------------------------+
void OnStart(void)
  {
   CSessionWindow g_session;
   CTickLoader    loader;
   datetime from = 0, to = 0;
   if(!g_session.Resolve(from, to))
      return;

//--- a script runs once, so it has no timer to poll the terminal's tick
//--- sync the way the EA does. Ask repeatedly (each Load() already retries
//--- internally) until ticks arrive or the wait budget runs out.
   MqlTick ticks[];
   int count = 0;
   for(int wait = 0; wait < InpMaxWaitRounds; wait++)
     {
      count = loader.Load(::_Symbol, from, to, ticks);
      if(count > 0)
         break;
      ::PrintFormat("Bench: no ticks yet (round %d of %d), last error %d",
                    wait + 1, InpMaxWaitRounds, loader.LastError());
      ::Sleep(2000);
     }
   if(count <= 0)
     {
      ::Print("Bench: no ticks loaded, last error ", loader.LastError());
      return;
     }
   if(loader.IsPartial())
      ::Print("Bench: warning, tick load flagged partial");

   double price_min = 0.0, price_max = 0.0;
   bool   have = false;
   for(int i = 0; i < count; i++)
     {
      double p = ResolveTickPrice(ticks[i]);
      if(p <= 0.0)
         continue;
      if(!have)
        {
         price_min = p;
         price_max = p;
         have = true;
        }
      if(p < price_min)
         price_min = p;
      if(p > price_max)
         price_max = p;
     }
   if(!have)
      return;

   double step = ::SymbolInfoDouble(::_Symbol, SYMBOL_TRADE_TICK_SIZE);
   if(step <= 0.0)
      step = ::SymbolInfoDouble(::_Symbol, SYMBOL_POINT);
   double bin_size = ::MathMax(1.0, ::MathCeil((price_max - price_min) / InpTargetBins / step)) * step;

   CVolumeProfile profile;
   profile.Initialize(price_min, price_max, bin_size);
   int bins = profile.BinCount();

   ::PrintFormat("Bench env: build=%d cores=%d ram_mb=%d x64=%s os=%s",
                 (int)::TerminalInfoInteger(TERMINAL_BUILD),
                 (int)::TerminalInfoInteger(TERMINAL_CPU_CORES),
                 (int)::TerminalInfoInteger(TERMINAL_MEMORY_PHYSICAL),
                 ::TerminalInfoInteger(TERMINAL_X64) ? "true" : "false",
                 ::TerminalInfoString(TERMINAL_OS_VERSION));
   ::PrintFormat("Bench data: symbol=%s from=%s to=%s ticks=%d bins=%d bin_size=%.5f",
                 ::_Symbol, ::TimeToString(from, TIME_DATE | TIME_SECONDS),
                 ::TimeToString(to, TIME_DATE | TIME_SECONDS), count, bins, bin_size);

   double naive[];
   for(int run = 0; run < InpRuns; run++)
     {
      ulong t0 = ::GetMicrosecondCount();
      NaiveAggregate(ticks, count, price_min, bin_size, bins, naive);
      double naive_ms = (::GetMicrosecondCount() - t0) / 1000.0;

      profile.Initialize(price_min, price_max, bin_size);
      ulong t1 = ::GetMicrosecondCount();
      profile.Aggregate(ticks, count);
      double direct_ms = (::GetMicrosecondCount() - t1) / 1000.0;

      int mismatch = 0;
      for(int j = 0; j < bins; j++)
         if(::MathAbs(naive[j] - profile.BinVolume(j)) > 1e-6)
            mismatch++;

      ::PrintFormat("Bench run %d: naive_ms=%.3f direct_ms=%.3f mismatched_bins=%d",
                    run + 1, naive_ms, direct_ms, mismatch);
     }
  }
The run took place on 2026.11.06, between 14:36 and 14:37 terminal time, on the MetaQuotes-Demo server, from H1 charts, with MetaTrader 5 build 6291 on Windows 11 (build 26200) on a Dell G15 5530 laptop with an Intel Core i7-13650HX processor (14 cores, 20 logical processors) and 64 GB of RAM. The ticks ran from server midnight to the moment of each run. Every run of both methods produced identical bins (0 mismatched bins in all 15 runs).
| Symbol | Ticks | Bins | Nested loop, ms (min to max, median) | Direct indexing, ms (min to max, median) | Median ratio |
|---|---|---|---|---|---|
| EURUSD | 246,419 | 183 | 27.2 to 28.4, 27.6 | 1.40 to 1.69, 1.60 | about 17x |
| USDJPY | 397,923 | 191 | 53.3 to 54.1, 53.7 | 2.34 to 2.97, 2.38 | about 23x |
| XAUUSD | 279,125 | 199 | 58.3 to 59.1, 58.5 | 1.58 to 2.13, 1.96 | about 30x |
The nested loop is 17 to 30 times slower, and its cost grows with the bin count, while direct indexing's does not. In absolute terms, though, it is not the multi-second stall that a rough estimate of tens of millions of comparisons suggests: at about two hundred bins it took 27 to 59 milliseconds on this machine. Two caveats apply. The benchmark's nested loop stops at the first matching bin, so on average it tests about half the bins for each tick, and a version without that early exit would be slower. And the figures are for one machine, one server and one day. The case for direct indexing rests on the ratio and on how the two costs scale, not on a dramatic absolute time.
Allocating the bin array up front matters just as much as the arithmetic itself. Growing an array on every tick would undermine the constant-time promise exactly where it can least be afforded. Testing across several brokers and instruments (described later) showed that targeting roughly 200 bins keeps the bin array's memory footprint in the kilobyte range, from forex majors to metals. The tick buffer that feeds that array is a separate and much larger cost. It can hold up to four million MqlTick records at its widest pre-size. At roughly sixty bytes per record, that is about two hundred and forty megabytes. The normal pre-size is much smaller, about fifty percent above the previous tick count, which is a few tens of megabytes for the sessions tested.
Section 2: CSessionWindow — Resolving the Session
Before any ticks can be loaded, the aggregator needs to know which time range to aggregate. CSessionWindow handles that concern on its own. It knows nothing about ticks or bins. It only turns the current server calendar day into a concrete from and to pair. This window matches the trade server's midnight, not the instrument's actual trading session, so it carries no knowledge of exchange hours, intraday breaks, or weekend closures. Isolating this logic still means the Expert Advisor never has to duplicate session boundary math on its own.
//+------------------------------------------------------------------+
//|                                                SessionWindow.mqh |
//+------------------------------------------------------------------+
#ifndef SESSIONWINDOW_MQH
#define SESSIONWINDOW_MQH

//+------------------------------------------------------------------+
//| CSessionWindow                                                   |
//| Resolves a window (from/to) running from the trade server's      |
//| midnight to the current server time. This is a server calendar-  |
//| day boundary, not the instrument's actual trading session: it    |
//| has no knowledge of exchange hours, intraday breaks, weekend     |
//| closures, or the trading calendar. On an instrument whose real   |
//| session does not align to server midnight (overnight futures,    |
//| for example), this window will not match that session.           |
//+------------------------------------------------------------------+
class CSessionWindow
  {
private:
   string            m_symbol;

public:
                     CSessionWindow(void);
                    ~CSessionWindow(void);
   void              SetSymbol(const string symbol);
   datetime          TodayStart(void);
   bool              Resolve(datetime &from, datetime &to);
  };

//+------------------------------------------------------------------+
//| Constructor                                                      |
//| The constructor defaults to the chart symbol; SetSymbol lets the |
//| caller target a different instrument if needed.                  |
//+------------------------------------------------------------------+
CSessionWindow::CSessionWindow(void)
  {
//--- default to the symbol the EA is attached to
   m_symbol = ::_Symbol;
  }

//+------------------------------------------------------------------+
//| Destructor                                                       |
//+------------------------------------------------------------------+
CSessionWindow::~CSessionWindow(void)
  {
  }
SetSymbol() overrides the instrument the class resolves a window for. It is not used by the driver Expert Advisor yet, since one chart runs against one symbol. It exists so a future extension, such as resolving several instruments from a single controller, has a place to plug in without touching the rest of the class.
//+------------------------------------------------------------------+
//| SetSymbol                                                        |
//+------------------------------------------------------------------+
void CSessionWindow::SetSymbol(const string symbol)
  {
//--- store the symbol for subsequent Resolve calls
   m_symbol = symbol;
  }
TodayStart() finds the exact moment the current calendar day began on the server clock. It decomposes the current server time into an MqlDateTime structure, zeroes the hour, minute, and second fields, then recomposes the structure back into a datetime. That midnight value becomes the anchor for the entire session window.
//+------------------------------------------------------------------+
//| TodayStart                                                       |
//+------------------------------------------------------------------+
datetime CSessionWindow::TodayStart(void)
  {
   MqlDateTime now_struct;
//--- decompose the current server time into its calendar fields
   ::TimeToStruct(::TimeCurrent(), now_struct);
//--- zero out the intraday fields to land on midnight
   now_struct.hour = 0;
   now_struct.min  = 0;
   now_struct.sec  = 0;
//--- recompose the struct back into a datetime value
   return(::StructToTime(now_struct));
  }
Resolve() builds the actual window that the rest of the pipeline consumes. It sets from to today's server-midnight start and to to the current server time. A false return signals a window that is empty or inverted. This is not limited to the exact instant of a midnight rollover. TimeCurrent() can also return an unusable value when the market is closed over a weekend or holiday, when the terminal has no fresh quotes yet, or immediately after startup before the first tick arrives.
//+------------------------------------------------------------------+
//| Resolve                                                          |
//+------------------------------------------------------------------+
bool CSessionWindow::Resolve(datetime &from, datetime &to)
  {
//--- the session starts at today's midnight and runs to now
   from = TodayStart();
   to   = ::TimeCurrent();
//--- an empty or inverted window means nothing can be aggregated yet
   if(to <= from)
      return(false);
   return(true);
  }
Section 3: CTickLoader — Loading Raw Ticks Reliably
With a session window in hand, the next job is pulling raw ticks out of the terminal's tick history. CopyTicksRange() does this. Given a symbol, a destination array, a set of tick flags, and a from/to range in milliseconds, it fills the array and returns the count copied. CTickLoader wraps that call and adds two things a bare call to CopyTicksRange() does not offer on its own: a fallback between tick types, and resilience against a pair of errors that live testing uncovered.
//+------------------------------------------------------------------+
//|                                                   TickLoader.mqh |
//+------------------------------------------------------------------+
#ifndef TICKLOADER_MQH
#define TICKLOADER_MQH

//+------------------------------------------------------------------+
//| CTickLoader                                                      |
//| Wraps CopyTicksRange() to load raw ticks for a session window,   |
//| preferring real trade ticks and falling back to all ticks only   |
//| when the absence of trade ticks is confirmed (zero ticks and no  |
//| error), for example on forex symbols.                            |
//+------------------------------------------------------------------+
class CTickLoader
  {
private:
   int               m_last_error;
   int               m_last_count;
   bool              m_partial;
   bool              m_all_ticks;

public:
                     CTickLoader(void);
                    ~CTickLoader(void);
   int               Load(const string symbol, const datetime from, const datetime to, MqlTick &ticks[]);
   int               LastError(void);
   bool              IsPartial(void);
   bool              UsedAllTicks(void);
  };

//+------------------------------------------------------------------+
//| Constructor                                                      |
//+------------------------------------------------------------------+
CTickLoader::CTickLoader(void)
  {
   m_last_error = 0;
   m_last_count = 0;
   m_partial    = false;
   m_all_ticks  = false;
  }

//+------------------------------------------------------------------+
//| Destructor                                                       |
//+------------------------------------------------------------------+
CTickLoader::~CTickLoader(void)
  {
  }
Load() starts with COPY_TICKS_TRADE. Forex symbols are quote-driven and often return no trade ticks, so Load() falls back to COPY_TICKS_ALL, but only when the trade request returns zero ticks and no error. A failed request is retried in trade mode instead. UsedAllTicks() reports which type was used, and the driver logs it as mode=trade or mode=all. Testing exposed two errors. ERR_HISTORY_TIMEOUT (4403) means tick synchronization timed out and cached data was returned. ERR_HISTORY_SMALL_BUFFER (4407) appeared on a busy metals symbol despite a dynamic array, and I did not isolate its cause.
Load() pre-sizes the array to the previous tick count plus 50 percent, with a floor of 50,000 ticks. The floor is only an initial capacity, not a limit: on the first refresh each instrument started from it and returned 248,745 to 399,910 ticks. Both errors trigger a retry, even when some ticks were returned. It makes up to five attempts, 500 milliseconds apart, for a wait of about 2.5 seconds. Only 4407 raises the buffer, to a 4,000,000-tick ceiling of about 240 megabytes. IsPartial() is true after a retry, after an exactly filled buffer, or when ticks arrive with either error. These constants are defaults, not tuned values. A cold terminal can need longer, as XAUUSD did in Section 1 (about 55 seconds of 4403), so the next 30-second timer asks again.
//+-------------------------------------------------------------------+
//| Load                                                              |
//+-------------------------------------------------------------------+
int CTickLoader::Load(const string symbol, const datetime from, const datetime to, MqlTick &ticks[])
  {
   long      from_msc      = (long)from * 1000;
   long      to_msc        = (long)to   * 1000;
   int       copied        = 0;
   const int max_retries   = 5;
   const int retry_delay   = 500;      // milliseconds
   const int buffer_cap    = 4000000;  // ceiling, only used after a 4407 retry
   const int buffer_floor  = 50000;    // minimum initial capacity

   m_partial   = false;
   m_all_ticks = false;

//--- normal pre-size: previous known count plus 50% headroom, or the floor
   int pre_size = m_last_count + m_last_count / 2;
   if(pre_size < buffer_floor)
      pre_size = buffer_floor;

   for(int attempt = 0; attempt < max_retries; attempt++)
     {
      ::ArrayResize(ticks, pre_size);
      m_all_ticks = false;

      //--- always request real trade ticks first
      ::ResetLastError();
      copied = ::CopyTicksRange(symbol, ticks, COPY_TICKS_TRADE, from_msc, to_msc);
      m_last_error = ::GetLastError();

      //--- fall back only when the absence of trade ticks is confirmed:
      //--- nothing returned and no error reported
      if(copied == 0 && m_last_error == 0)
        {
         ::ArrayResize(ticks, pre_size);
         ::ResetLastError();
         copied = ::CopyTicksRange(symbol, ticks, COPY_TICKS_ALL, from_msc, to_msc);
         m_last_error = ::GetLastError();
         m_all_ticks  = true;
        }

      //--- a result that exactly fills the offered buffer may have been
      //--- truncated at the buffer's edge rather than genuinely ending there
      if(copied > 0 && copied == pre_size)
         m_partial = true;

      //--- success or any non-transient error ends the loop
      if(m_last_error != 4403 && m_last_error != 4407)
         break;

      //--- 4403 and 4407 are retried in the same tick mode, even when some
      //--- ticks came back with them. Only 4407 escalates the buffer.
      m_partial = true;
      if(m_last_error == 4407)
         pre_size = buffer_cap;
      ::Sleep(retry_delay);
     }

   if(copied < 0)
      copied = 0;

//--- partial data accepted after exhausting all retries: the caller
//--- still gets the ticks (some data beats none), but m_partial stays
//--- true so it is not displayed or logged as a complete session
   if(copied > 0 && (m_last_error == 4403 || m_last_error == 4407))
      m_partial = true;

   m_last_count = copied;

//--- trim the array back down to the actual tick count
   ::ArrayResize(ticks, copied);

   return(copied);
  }
LastError() is the plain accessor that exposes the code captured during that most recent Load() call. Its value is what turns a vague suspicion of a stuck sync into a confirmed diagnosis, since the driver logs it on every single refresh rather than only on outright failure.
//+------------------------------------------------------------------+
//| LastError                                                        |
//+------------------------------------------------------------------+
int CTickLoader::LastError(void)
  {
   return(m_last_error);
  }
IsPartial() is the second plain accessor on the class. It reports whether the most recent Load() result should be treated as possibly incomplete. The flag is set inside Load() when a retry was needed, when the final copy exactly filled the buffer, or when ticks were returned together with error 4403 or 4407. The driver reads it after every refresh and prints it in the summary line, so a trader can see at a glance whether a given profile was built from trustworthy data.
//+------------------------------------------------------------------+
//| IsPartial                                                        |
//+------------------------------------------------------------------+
bool CTickLoader::IsPartial(void)
  {
   return(m_partial);
  }
UsedAllTicks() is the third plain accessor. It reports whether the most recent Load() result came from COPY_TICKS_ALL, which means every tick counts as one unit of volume. The driver prints it as mode=all or mode=trade, so a change in what the profile measures is visible in the log.
//+------------------------------------------------------------------+
//| UsedAllTicks                                                     |
//+------------------------------------------------------------------+
bool CTickLoader::UsedAllTicks(void)
  {
   return(m_all_ticks);
  }
Section 4: CVolumeProfile — the O(1) Aggregator
This class is what the rest of the pipeline exists to feed. It owns an array of price bins, stored as doubles so a fractional volume_real value is not truncated, and does two things well: allocate that array, and increment the right bin for each tick in constant time.
//+------------------------------------------------------------------+
//|                                                VolumeProfile.mqh |
//+------------------------------------------------------------------+
#ifndef VOLUMEPROFILE_MQH
#define VOLUMEPROFILE_MQH

//+------------------------------------------------------------------+
//| ResolveTickPrice                                                 |
//| Returns the price a tick represents, preferring last, then bid,  |
//| then ask, and returning 0.0 when none of the three is usable.    |
//| AddTick() below and the price-range scan in VolumeProfileEA.mq5  |
//| both call this same function, so the range that sizes the profile|
//| and the price that bins each tick can no longer disagree about   |
//| which field to read.                                             |
//+------------------------------------------------------------------+
double ResolveTickPrice(const MqlTick &tick)
  {
   if(tick.last > 0.0)
      return(tick.last);
   if(tick.bid > 0.0)
      return(tick.bid);
   if(tick.ask > 0.0)
      return(tick.ask);
   return(0.0);
  }

//+------------------------------------------------------------------+
//| CVolumeProfile                                                   |
//| Owns a pre-allocated array of price bins on a tick-size grid and |
//| aggregates tick volume into those bins in O(1) per tick.         |
//+------------------------------------------------------------------+
class CVolumeProfile
  {
private:
   double            m_bins[];
   int               m_bin_count;
   double            m_price_min;
   double            m_price_max;
   double            m_bin_size;
   double            m_total_volume;
   long              m_skipped_zero_price;

public:
                     CVolumeProfile(void);
                    ~CVolumeProfile(void);
   bool              Initialize(const double price_min, const double price_max, const double bin_size);
   void              AddTick(const MqlTick &tick);
   int               Aggregate(const MqlTick &ticks[], const int count);
   int               BinCount(void);
   double            BinVolume(const int index);
   double            BinPrice(const int index);
   double            BinSize(void);
   double            TotalVolume(void);
   int               MaxBinIndex(void);
   long              SkippedZeroPriceCount(void);
  };

//+------------------------------------------------------------------+
//| Constructor                                                      |
//+------------------------------------------------------------------+
CVolumeProfile::CVolumeProfile(void)
  {
   m_bin_count          = 0;
   m_price_min          = 0.0;
   m_price_max          = 0.0;
   m_bin_size           = 0.0;
   m_total_volume       = 0.0;
   m_skipped_zero_price = 0;
  }

//+------------------------------------------------------------------+
//| Destructor                                                       |
//+------------------------------------------------------------------+
CVolumeProfile::~CVolumeProfile(void)
  {
  }
Initialize() validates the range and bin size, then figures out how many bins are needed by dividing the range by the bin size and adding one extra bin to absorb rounding at the top edge. A range of zero width, where every valid tick traded at the same price, is accepted and produces a single bin. Only a negative range or a non-positive bin size is rejected. It resizes the array with ArrayResize() and zeroes every element with ArrayInitialize(). Any allocation failure or invalid input returns false, so the caller can bail out before touching an uninitialized array.
//+------------------------------------------------------------------+
//| Initialize                                                       |
//+------------------------------------------------------------------+
bool CVolumeProfile::Initialize(const double price_min, const double price_max, const double bin_size)
  {
   if(bin_size <= 0.0 || price_max < price_min)
      return(false);

//--- store the tick-size grid parameters
   m_price_min = price_min;
   m_price_max = price_max;
   m_bin_size  = bin_size;

//--- size the array from the price range, with one extra bin for edge rounding
   m_bin_count = (int)::MathRound((price_max - price_min) / bin_size) + 1;
   if(::ArrayResize(m_bins, m_bin_count) != m_bin_count)
      return(false);

//--- zero every bin and reset the running total
   ::ArrayInitialize(m_bins, 0.0);
   m_total_volume       = 0.0;
   m_skipped_zero_price = 0;

   return(true);
  }
AddTick() resolves a price for the tick through a shared helper, ResolveTickPrice(), that tries last, then bid, then ask. The range scan inside the driver Expert Advisor, covered in Section 7, calls this same helper, so the two stages can no longer disagree about which field to read. When none of the three prices is usable, the tick carries no information to bin, so AddTick() skips it entirely and counts it in a running skipped-tick total instead of binning it at an edge.
A tick with a valid price that simply falls outside the pre-allocated range is still clamped to the nearest edge bin rather than dropped. A tick trading slightly outside that range should still count somewhere, or the total volume would silently disagree with the tick count the driver reports, and this clamping remains a known source of distortion between refreshes, covered again in Section 11. Volume selection prefers volume_real, kept as a double so its fractional part survives, falls back to volume, and finally defaults to a count of one, which is the common case on forex symbols.
//+------------------------------------------------------------------+
//| AddTick                                                          |
//+------------------------------------------------------------------+
void CVolumeProfile::AddTick(const MqlTick &tick)
  {
   double price = ResolveTickPrice(tick);
   if(price <= 0.0)
     {
      m_skipped_zero_price++;
      return;
     }

//--- compute the bin index directly from the quantized price offset
   int bin = (int)::MathRound((price - m_price_min) / m_bin_size);

//--- clamp out of range prices to the nearest edge bin
   if(bin < 0)
      bin = 0;
   if(bin >= m_bin_count)
      bin = m_bin_count - 1;

//--- prefer real volume (fractional part preserved), fall back to a
//--- tick count of one
   double vol = (tick.volume_real > 0.0) ? tick.volume_real : 1.0;
   if(tick.volume > 0 && tick.volume_real <= 0.0)
      vol = (double)tick.volume;

   m_bins[bin]    += vol;
   m_total_volume += vol;
  }
Aggregate() simply runs AddTick() across the full array. That single loop is the aggregation pass, the O(n) sweep that replaces the nested loop described in Section 1.
//+------------------------------------------------------------------+
//| Aggregate                                                        |
//+------------------------------------------------------------------+
int CVolumeProfile::Aggregate(const MqlTick &ticks[], const int count)
  {
   int processed = 0;
//--- single aggregation pass over the full tick array
   for(int i = 0; i < count; i++)
     {
      AddTick(ticks[i]);
      processed++;
     }
   return(processed);
  }
BinCount(), BinVolume(), BinPrice(), and BinSize() are the four lookup methods that every downstream class relies on instead of touching m_bins directly. BinCount() reports how many bins exist. BinVolume() returns a bin's aggregated volume, bounds-checked against a negative or out-of-range index. BinPrice() runs the binning formula in reverse, turning an index back into the price level it represents. BinSize() returns the price height of one bin. The renderer needs it to give a bar visible height even when the profile has only one bin, where the distance between two neighboring bins does not exist. TotalVolume() sits alongside them as the running sum across every bin, updated once per tick inside AddTick() rather than recomputed on demand.
//+------------------------------------------------------------------+
//| BinCount                                                         |
//+------------------------------------------------------------------+
int CVolumeProfile::BinCount(void)
  {
   return(m_bin_count);
  }

//+------------------------------------------------------------------+
//| BinVolume                                                        |
//+------------------------------------------------------------------+
double CVolumeProfile::BinVolume(const int index)
  {
   if(index < 0 || index >= m_bin_count)
      return(0.0);
   return(m_bins[index]);
  }

//+------------------------------------------------------------------+
//| BinPrice                                                         |
//+------------------------------------------------------------------+
double CVolumeProfile::BinPrice(const int index)
  {
   if(index < 0 || index >= m_bin_count)
      return(0.0);
   return(m_price_min + index * m_bin_size);
  }

//+------------------------------------------------------------------+
//| BinSize                                                          |
//| Returns the price height of one bin. The renderer uses it so a   |
//| single-bin profile still has a visible bar height.               |
//+------------------------------------------------------------------+
double CVolumeProfile::BinSize(void)
  {
   return(m_bin_size);
  }

//+------------------------------------------------------------------+
//| TotalVolume                                                      |
//+------------------------------------------------------------------+
double CVolumeProfile::TotalVolume(void)
  {
   return(m_total_volume);
  }
MaxBinIndex() earns its own paragraph because, unlike the four accessors above it, it does real work. It scans every bin looking for the highest volume and returns that index. This scan becomes the seed for the point of control in the next section.
//+------------------------------------------------------------------+
//| MaxBinIndex                                                      |
//+------------------------------------------------------------------+
int CVolumeProfile::MaxBinIndex(void)
  {
   int    best_index  = 0;
   double best_volume = 0.0;

//--- linear scan for the highest volume bin
   for(int i = 0; i < m_bin_count; i++)
     {
      if(m_bins[i] > best_volume)
        {
         best_volume = m_bins[i];
         best_index  = i;
        }
     }
   return(best_index);
  }
SkippedZeroPriceCount() reports how many ticks in the most recent aggregation had no valid price at all and were skipped rather than binned. The driver logs this value on every refresh, so a feed sending unusable ticks shows up in the Experts tab rather than silently distorting the profile.
//+------------------------------------------------------------------+
//| SkippedZeroPriceCount                                            |
//+------------------------------------------------------------------+
long CVolumeProfile::SkippedZeroPriceCount(void)
  {
   return(m_skipped_zero_price);
  }
Section 5: CValueArea — POC, VAH, and VAL
Once the histogram is finished, CValueArea turns it into the three numbers traders actually look at.
//+------------------------------------------------------------------+
//|                                                    ValueArea.mqh |
//+------------------------------------------------------------------+
#ifndef VALUEAREA_MQH
#define VALUEAREA_MQH
#include "VolumeProfile.mqh"

//+------------------------------------------------------------------+
//| CValueArea                                                       |
//| Computes the point of control, value area high, and value area   |
//| low from a finished CVolumeProfile using the standard expansion  |
//| algorithm.                                                       |
//+------------------------------------------------------------------+
class CValueArea
  {
private:
   int               m_poc_index;
   int               m_vah_index;
   int               m_val_index;
   double            m_poc_volume;

public:
                     CValueArea(void);
                    ~CValueArea(void);
   bool              Compute(CVolumeProfile &profile, const double coverage);
   double            PocPrice(CVolumeProfile &profile);
   double            PocVolume(void);
   double            ValueAreaHigh(CVolumeProfile &profile);
   double            ValueAreaLow(CVolumeProfile &profile);
   int               PocIndex(void);
   int               ValueAreaHighIndex(void);
   int               ValueAreaLowIndex(void);
  };

//+------------------------------------------------------------------+
//| Constructor                                                      |
//+------------------------------------------------------------------+
CValueArea::CValueArea(void)
  {
   m_poc_index  = 0;
   m_vah_index  = 0;
   m_val_index  = 0;
   m_poc_volume = 0.0;
  }

//+------------------------------------------------------------------+
//| Destructor                                                       |
//+------------------------------------------------------------------+
CValueArea::~CValueArea(void)
  {
  }
Compute() implements the expansion algorithm. The point of control is simply the bin CVolumeProfile::MaxBinIndex() already found. The value area grows outward from the point of control one bin at a time, always extending toward whichever neighboring bin, above or below, carries more volume, until the combined volume reaches a target coverage of total volume, with seventy percent as the default. This greedy, nearest-larger-neighbor approach does not evaluate alternative windows, so it does not guarantee the narrowest possible contiguous range that reaches the target coverage. It only guarantees a locally greedy one that stays centered on the busiest part of the distribution.
That greedy choice is deliberate. It keeps the value area centered on the busiest part of the distribution instead of drifting arbitrarily toward one side. If the market traded more heavily just above the point of control, the value area grows upward first. The loop stops once covered volume reaches the target, or once both edges of the histogram run out.
//+------------------------------------------------------------------+
//| Compute                                                          |
//+------------------------------------------------------------------+
bool CValueArea::Compute(CVolumeProfile &profile, const double coverage)
  {
   int    bin_count = profile.BinCount();
   double total_vol = profile.TotalVolume();

   if(bin_count <= 0 || total_vol <= 0.0)
      return(false);

//--- locate the point of control as the richest bin
   m_poc_index  = profile.MaxBinIndex();
   m_poc_volume = profile.BinVolume(m_poc_index);

   int    lo      = m_poc_index;
   int    hi      = m_poc_index;
   double covered = m_poc_volume;
   double target  = coverage * total_vol;

//--- expand outward from the POC toward the richer neighbor each step
   while(covered < target)
     {
      int    up_index   = hi + 1;
      int    down_index = lo - 1;
      double up_vol     = (up_index   < bin_count) ? profile.BinVolume(up_index)   : -1.0;
      double down_vol   = (down_index >= 0)        ? profile.BinVolume(down_index) : -1.0;

      //--- stop once both edges of the histogram are exhausted
      if(up_vol < 0 && down_vol < 0)
         break;

      if(up_vol >= down_vol)
        {
         hi       = up_index;
         covered += up_vol;
        }
      else
        {
         lo       = down_index;
         covered += down_vol;
        }
     }

   m_val_index = lo;
   m_vah_index = hi;

   return(true);
  }
PocPrice(), PocVolume(), ValueAreaHigh(), and ValueAreaLow() are grouped together because each one either reads or translates a stored value into something a trader would recognize on a price scale. The price-facing methods among them need the profile passed back in, since only the profile knows how to turn a raw index into a price.
//+------------------------------------------------------------------+
//| PocPrice                                                         |
//+------------------------------------------------------------------+
double CValueArea::PocPrice(CVolumeProfile &profile)
  {
   return(profile.BinPrice(m_poc_index));
  }

//+------------------------------------------------------------------+
//| PocVolume                                                        |
//+------------------------------------------------------------------+
double CValueArea::PocVolume(void)
  {
   return(m_poc_volume);
  }

//+------------------------------------------------------------------+
//| ValueAreaHigh                                                    |
//+------------------------------------------------------------------+
double CValueArea::ValueAreaHigh(CVolumeProfile &profile)
  {
   return(profile.BinPrice(m_vah_index));
  }

//+------------------------------------------------------------------+
//| ValueAreaLow                                                     |
//+------------------------------------------------------------------+
double CValueArea::ValueAreaLow(CVolumeProfile &profile)
  {
   return(profile.BinPrice(m_val_index));
  }
PocIndex(), ValueAreaHighIndex(), and ValueAreaLowIndex() exist for one reason. The renderer needs to compare a bin's raw index against these boundaries on every single bin, every refresh. Comparing integers is both simpler and cheaper than converting each bin back to a price first.
//+------------------------------------------------------------------+
//| PocIndex                                                         |
//+------------------------------------------------------------------+
int CValueArea::PocIndex(void)
  {
   return(m_poc_index);
  }

//+------------------------------------------------------------------+
//| ValueAreaHighIndex                                               |
//+------------------------------------------------------------------+
int CValueArea::ValueAreaHighIndex(void)
  {
   return(m_vah_index);
  }

//+------------------------------------------------------------------+
//| ValueAreaLowIndex                                                |
//+------------------------------------------------------------------+
int CValueArea::ValueAreaLowIndex(void)
  {
   return(m_val_index);
  }
Section 6: CProfileRenderer — Drawing the Profile in Open Chart Space
A finished histogram is just an array of numbers until it reaches the chart. CProfileRenderer makes the aggregation visible. It translates each price bin into a horizontal bar a trader can read at a glance. The class knows nothing about how the volume got calculated. It only takes a finished CVolumeProfile and a computed CValueArea and turns them into shapes on the screen.
//+------------------------------------------------------------------+
//|                                              ProfileRenderer.mqh |
//+------------------------------------------------------------------+
#ifndef PROFILERENDERER_MQH
#define PROFILERENDERER_MQH
#include "VolumeProfile.mqh"
#include "ValueArea.mqh"

//+------------------------------------------------------------------+
//| CProfileRenderer                                                 |
//| Renders a finished volume profile on the chart as horizontal     |
//| bars, one per non-empty price bin, using OBJ_RECTANGLE objects   |
//| anchored at the right edge of the chart.                         |
//+------------------------------------------------------------------+
class CProfileRenderer
  {
private:
   string            m_prefix;
   color             m_color_normal;
   color             m_color_poc;
   color             m_color_value_area;
   int               m_max_bar_seconds;
   int               m_margin_seconds;
   int               m_active_bins[];   // bin indices drawn on the previous Render() call

   string            BarName(const int index);
   bool              WasActive(const int index, const int &prev_bins[]);

public:
                     CProfileRenderer(void);
                    ~CProfileRenderer(void);
   void              SetPrefix(const string prefix);
   void              Render(CVolumeProfile &profile, CValueArea &va, const datetime anchor_time);
   void              Clear(void);
  };

//+------------------------------------------------------------------+
//| Constructor                                                      |
//+------------------------------------------------------------------+
CProfileRenderer::CProfileRenderer(void)
  {
   m_prefix           = "VPA_";
   m_color_normal     = clrSteelBlue;
   m_color_poc        = clrOrangeRed;
   m_color_value_area = clrDodgerBlue;
//--- bar length is measured in chart time, so these two values suit an H1
//--- chart: the longest bar spans four candles and the anchor sits five
//--- candles past the last one. Other timeframes need a different pair.
   m_max_bar_seconds  = 3600 * 4;
   m_margin_seconds   = 3600 * 5;
  }

//+------------------------------------------------------------------+
//| Destructor                                                       |
//+------------------------------------------------------------------+
CProfileRenderer::~CProfileRenderer(void)
  {
  }
SetPrefix() and BarName() are two small helpers that go together. SetPrefix() overrides the object name prefix, so several renderers can coexist on one chart without colliding. BarName() builds a deterministic name from that prefix plus a bin index, which lets Render() move an existing object instead of recreating it, and lets Clear() find every object this renderer owns.
//+------------------------------------------------------------------+
//| SetPrefix                                                        |
//+------------------------------------------------------------------+
void CProfileRenderer::SetPrefix(const string prefix)
  {
   m_prefix = prefix;
  }

//+------------------------------------------------------------------+
//| BarName                                                          |
//+------------------------------------------------------------------+
string CProfileRenderer::BarName(const int index)
  {
   return(m_prefix + "BIN_" + ::IntegerToString(index));
  }
WasActive() is a small private helper that answers one question. Did a given bin index appear in a list of bins? Render() calls it twice. The first call checks whether a bar already exists from the previous refresh, so the bar can be moved instead of recreated. The second call checks whether a previously drawn bin is still non-empty, so a bar that is no longer needed can be deleted. A linear search is acceptable here, since the list never grows beyond the bin count, which stays near two hundred when the bin size is auto-sized.
//+------------------------------------------------------------------+
//| WasActive                                                        |
//+------------------------------------------------------------------+
bool CProfileRenderer::WasActive(const int index, const int &prev_bins[])
  {
   int n = ::ArraySize(prev_bins);
   for(int i = 0; i < n; i++)
      if(prev_bins[i] == index)
         return(true);
   return(false);
  }
Render() draws one OBJ_RECTANGLE per non-empty bin. The right corner sits at the session end plus a margin, and the left corner is set back by a number of seconds proportional to the bin's share of the point of control's volume, so the busiest bin gets the full width. Half the bar's height comes from the profile's BinSize(), so a single-bin profile, which has no neighbor to measure against, still draws a visible bar. Render() does not begin with Clear(), because that would delete every bar before it could be reused. It remembers the bins drawn last time in m_active_bins. WasActive() then decides whether a bar is moved with ObjectMove(), created with ObjectCreate(), or deleted. Clear() remains for a full reset, such as on deinit. The point of control bar gets a distinct color, bars inside the value area get a second one, and the rest keep the normal color.
The anchor sits past the session end because bars placed exactly at the end covered the last several hours of candles and made the price action hard to read. This requires the empty right margin that CHART_SHIFT creates in the driver. The margin, the bar width, and the chart shift were set by eye on live charts, not derived. Bar length is measured in chart time, so m_max_bar_seconds (four hours) and m_margin_seconds (five hours) suit an H1 chart, and other timeframes need different values. CHART_SHIFT_SIZE is 15 percent, about fifteen candle widths on an H1 chart showing a hundred bars. Raise it if the chart is zoomed far out.
//+-------------------------------------------------------------------+
//| Render                                                            |
//+-------------------------------------------------------------------+
void CProfileRenderer::Render(CVolumeProfile &profile, CValueArea &va, const datetime anchor_time)
  {
   int    bin_count  = profile.BinCount();
   double poc_volume = va.PocVolume();
   if(poc_volume <= 0.0)
      return;

//--- push the anchor forward into open chart space, past the last candle,
//--- so bars do not paint directly over recent price action; requires the
//--- chart's right-side empty margin (CHART_SHIFT) to be wide enough
   datetime anchor_shifted = anchor_time + m_margin_seconds;

//--- half a bin's price height gives each bar visible thickness
   double half_bin = profile.BinSize() / 2.0;

   int new_active[];
   ::ArrayResize(new_active, bin_count);
   int new_count = 0;

   for(int i = 0; i < bin_count; i++)
     {
      double vol = profile.BinVolume(i);
      //--- skip empty bins, nothing to draw
      if(vol <= 0.0)
         continue;

      double   price_lo    = profile.BinPrice(i) - half_bin;
      double   price_hi    = profile.BinPrice(i) + half_bin;
      double   fraction    = vol / poc_volume;
      int      bar_seconds = (int)::MathRound(fraction * m_max_bar_seconds);
      datetime time_left   = anchor_shifted - bar_seconds;

      string name   = BarName(i);
      bool   exists = WasActive(i, m_active_bins);

      //--- create the rectangle anchored past the last candle, extending left;
      //--- reuse it in place when it was already drawn on the previous call
      if(!exists)
         ::ObjectCreate(0, name, OBJ_RECTANGLE, 0, time_left, price_lo, anchor_shifted, price_hi);
      else
        {
         ::ObjectMove(0, name, 0, time_left, price_lo);
         ::ObjectMove(0, name, 1, anchor_shifted, price_hi);
        }

      //--- pick the bar color: POC first, then value area, then normal
      color bar_color = m_color_normal;
      if(i == va.PocIndex())
         bar_color = m_color_poc;
      else
         if(i >= va.ValueAreaLowIndex() && i <= va.ValueAreaHighIndex())
            bar_color = m_color_value_area;

      ::ObjectSetInteger(0, name, OBJPROP_COLOR, bar_color);
      ::ObjectSetInteger(0, name, OBJPROP_BGCOLOR, bar_color);
      ::ObjectSetInteger(0, name, OBJPROP_FILL, true);
      ::ObjectSetInteger(0, name, OBJPROP_BACK, true);
      ::ObjectSetInteger(0, name, OBJPROP_SELECTABLE, false);
      ::ObjectSetInteger(0, name, OBJPROP_HIDDEN, true);

      new_active[new_count] = i;
      new_count++;
     }
   ::ArrayResize(new_active, new_count);

//--- remove bars for bins that were drawn last time but are empty now
   int prev_total = ::ArraySize(m_active_bins);
   for(int p = 0; p < prev_total; p++)
     {
      int idx = m_active_bins[p];
      if(!WasActive(idx, new_active))
         ::ObjectDelete(0, BarName(idx));
     }

   ::ArrayResize(m_active_bins, new_count);
   for(int i = 0; i < new_count; i++)
      m_active_bins[i] = new_active[i];

   ::ChartRedraw(0);
  }
Clear() closes out the class. It removes every rectangle whose name starts with the renderer's prefix, walking the object list backward since ObjectDelete() shifts the indices of every object after the one just removed. A forward loop under those conditions would skip entries.
//+------------------------------------------------------------------+
//| Clear                                                            |
//+------------------------------------------------------------------+
void CProfileRenderer::Clear(void)
  {
   int total = ::ObjectsTotal(0, 0, OBJ_RECTANGLE);
//--- walk backward since deleting shifts the index of later objects
   for(int i = total - 1; i >= 0; i--)
     {
      string name = ::ObjectName(0, i, 0, OBJ_RECTANGLE);
      if(::StringFind(name, m_prefix) == 0)
         ::ObjectDelete(0, name);
     }
   ::ArrayResize(m_active_bins, 0);
  }
Section 7: VolumeProfileEA.mq5 — the Driver EA
The Expert Advisor wires the five classes into one pipeline and keeps it refreshed. It starts with inputs governing bin sizing, value area coverage, and refresh cadence, plus a small amount of global state used to detect a stalled tick history sync across refreshes. OnInit() validates these inputs before anything else runs, covered below, so a value out of range is rejected at load time rather than silently producing a broken profile.
//+------------------------------------------------------------------+
//|                                             VolumeProfileEA.mq5  |
//+------------------------------------------------------------------+
#property strict

#include <VolumeProfileAggregator/SessionWindow.mqh>
#include <VolumeProfileAggregator/TickLoader.mqh>
#include <VolumeProfileAggregator/VolumeProfile.mqh>
#include <VolumeProfileAggregator/ValueArea.mqh>
#include <VolumeProfileAggregator/ProfileRenderer.mqh>

//--- Inputs
input double InpBinSize        = 0.0;     // fixed price bin size (0 = auto-size, rounded to tick size)
input int    InpTargetBins     = 200;     // approximate bin count when auto-sizing
input double InpCoverage       = 0.70;    // value area coverage fraction
input int    InpRefreshSeconds = 30;      // OnTimer refresh interval in seconds (UX choice, pipeline costs tens of ms)

CSessionWindow   g_session;
CTickLoader      g_loader;
CVolumeProfile   g_profile;
CValueArea       g_value_area;
CProfileRenderer g_renderer;

long   g_last_tick_count = -1;
int    g_stall_count     = 0;
double g_fixed_bin       = 0.0;   // InpBinSize aligned to the tick size, 0 = auto
TickStep() returns the instrument's tick size, falling back to the point size when the broker reports none. Both the automatic bin sizing in RunPipeline() and the alignment of a fixed InpBinSize in OnInit() use it, so the two paths can never disagree about the grid.
//+------------------------------------------------------------------+
//| TickStep                                                         |
//| The symbol's tick size, falling back to the point size when the  |
//| broker reports none.                                             |
//+------------------------------------------------------------------+
double TickStep(void)
  {
   double step = ::SymbolInfoDouble(::_Symbol, SYMBOL_TRADE_TICK_SIZE);
   if(step <= 0.0)
      step = ::SymbolInfoDouble(::_Symbol, SYMBOL_POINT);
   if(step <= 0.0)
      step = 0.00001; // last-resort fallback, should not trigger in practice
   return(step);
  }
ValidateInputs() checks the four numeric inputs that can break the pipeline if they fall outside a sensible range. InpBinSize must not be negative, where zero selects auto-sizing, so a negative value is rejected instead of being silently treated as automatic. InpTargetBins must be positive, since it divides the price range. InpCoverage must be greater than zero and no more than one, since it is a fraction of total volume. InpRefreshSeconds must be positive, since it drives the timer. Each failure prints a clear message to the Experts tab and returns false. OnInit() then refuses to start, so a bad setting is caught at load time instead of producing a confusing profile later.
//+-------------------------------------------------------------------+
//| ValidateInputs                                                    |
//+-------------------------------------------------------------------+
bool ValidateInputs(void)
  {
   if(InpBinSize < 0.0)
     {
      ::Print("VolumeProfileEA: InpBinSize must be >= 0 (0 = auto-size), got ", InpBinSize);
      return(false);
     }
   if(InpTargetBins <= 0)
     {
      ::Print("VolumeProfileEA: InpTargetBins must be > 0, got ", InpTargetBins);
      return(false);
     }
   if(InpCoverage <= 0.0 || InpCoverage > 1.0)
     {
      ::Print("VolumeProfileEA: InpCoverage must satisfy 0 < coverage <= 1, got ", InpCoverage);
      return(false);
     }
   if(InpRefreshSeconds <= 0)
     {
      ::Print("VolumeProfileEA: InpRefreshSeconds must be > 0, got ", InpRefreshSeconds);
      return(false);
     }
   return(true);
  }
InpRefreshSeconds defaults to 30 as a user-experience choice, not a processing limit. In the Section 9 run the median pipeline cost was 28 to 46 milliseconds, about 0.1 percent of the interval. Lowering the interval makes the profile follow price more closely. A value of a few seconds or less is not recommended, because the slowest refreshes in that run took 1.6 to 3.2 seconds, entirely in the tick load, and the timer callback blocks the chart's Expert Advisor while it runs.
RunPipeline() is called by both OnInit() and OnTimer(), so the two entry points stay in sync. It resolves the session, loads ticks, checks for a stalled sync, scans the price range, sizes the bins, aggregates, computes the value area, renders, and logs a summary line. Each stage is timed separately, and the line also reports the tick mode. Loading, scanning, and aggregation are O(n). The remaining stages are O(m), and rendering adds a small linear lookup per bin, about forty thousand comparisons at two hundred bins.
Bin sizing and stall detection come from live testing. A fixed width tuned for forex gave over six hundred thousand mostly empty bins on a metals symbol, so the width is derived from the observed range and rounded up to a multiple of the tick size. A fixed InpBinSize is rounded to a tick multiple once in OnInit(), with a warning if it changed. Because price_min is an observed price, every bin edge lands on a tradable price. If all ticks share one price, the profile has a single bin of one tick. For stalls, CopyTicksRange() can return a frozen count with error 4403. After two consecutive stalls, RunPipeline() toggles the Market Depth subscription to nudge the tick cache. A flat count with no error is not flagged, since it can simply mean a quiet market.
//+-------------------------------------------------------------------+
//| RunPipeline                                                       |
//+-------------------------------------------------------------------+
void RunPipeline(void)
  {
   ulong t_total_start = ::GetMicrosecondCount();

   datetime from = 0;
   datetime to   = 0;

//--- resolve the current session window
   if(!g_session.Resolve(from, to))
     {
      ::Print("VolumeProfileEA: session window is empty, nothing to aggregate");
      return;
     }

//--- load raw ticks for the session window
   MqlTick ticks[];
   ulong t_load_start = ::GetMicrosecondCount();
   int tick_count = g_loader.Load(::_Symbol, from, to, ticks);
   double load_ms = (::GetMicrosecondCount() - t_load_start) / 1000.0;
   if(tick_count <= 0)
     {
      ::Print("VolumeProfileEA: no ticks loaded, last error ", g_loader.LastError());
      return;
     }

//--- detect a stalled tick-history sync: CopyTicksRange can return a
//--- non-zero but frozen count while silently reporting ERR_HISTORY_TIMEOUT
//--- (4403) on every call, which the tick_count <= 0 branch above never
//--- catches since the count itself is not zero
   if(tick_count == g_last_tick_count && g_loader.LastError() == 4403)
     {
      g_stall_count++;
      ::PrintFormat("VolumeProfileEA: tick history appears stalled (stuck at %d ticks, error 4403, %d consecutive stalls)",
                    tick_count, g_stall_count);

      //--- after two consecutive stalls, nudge the terminal's tick sync by
      //--- toggling the Market Depth subscription for this symbol
      if(g_stall_count == 2)
        {
         ::Print("VolumeProfileEA: attempting resync via Market Depth toggle");
         ::MarketBookAdd(::_Symbol);
         ::MarketBookRelease(::_Symbol);
        }
     }
   else
     {
      g_stall_count = 0;
     }
   g_last_tick_count = tick_count;

//--- scan once for the price range the bin array must cover. Uses the
//--- same ResolveTickPrice() helper that AddTick() uses (last -> bid ->
//--- ask), so the range used to size the profile and the price used to
//--- bin each tick cannot disagree. A tick with no valid price at all is
//--- skipped from the scan, the same as AddTick() skips it from aggregation.
   ulong  t_scan_start = ::GetMicrosecondCount();
   double price_min    = 0.0;
   double price_max    = 0.0;
   bool   have_price   = false;
   for(int i = 0; i < tick_count; i++)
     {
      double p = ResolveTickPrice(ticks[i]);
      if(p <= 0.0)
         continue;
      if(!have_price)
        {
         price_min  = p;
         price_max  = p;
         have_price = true;
        }
      else
        {
         if(p < price_min)
            price_min = p;
         if(p > price_max)
            price_max = p;
        }
     }
   double scan_ms = (::GetMicrosecondCount() - t_scan_start) / 1000.0;

   if(!have_price)
     {
      ::Print("VolumeProfileEA: no ticks with a valid price in this session, skipping");
      return;
     }

//--- size the tick-size grid: use the fixed input (already aligned to the
//--- tick size in OnInit) if given, otherwise derive a bin size from the
//--- observed range so instruments with very different price scales
//--- (forex vs. metals vs. indices) each get a sensible bin count. The
//--- derived size is rounded UP to a multiple of the symbol's tick size
//--- (SYMBOL_TRADE_TICK_SIZE, falling back to SYMBOL_POINT). Bin edges
//--- are price_min plus whole bins, and price_min is an observed price,
//--- so every edge lands on the tick-size grid in both modes. A range of
//--- zero width gives raw = 0, so the bin size becomes one tick size.
   double bin_size = g_fixed_bin;
   if(bin_size <= 0.0)
     {
      double step      = TickStep();
      double raw       = (price_max - price_min) / InpTargetBins;
      double multiples = ::MathCeil(raw / step);
      if(multiples < 1.0)
         multiples = 1.0;
      bin_size = multiples * step;
     }

   ulong t_init_start = ::GetMicrosecondCount();
   if(!g_profile.Initialize(price_min, price_max, bin_size))
     {
      ::Print("VolumeProfileEA: failed to initialize the volume profile");
      return;
     }
   double init_ms = (::GetMicrosecondCount() - t_init_start) / 1000.0;

//--- time the aggregation pass with microsecond resolution
   ulong start_usec   = ::GetMicrosecondCount();
   g_profile.Aggregate(ticks, tick_count);
   ulong elapsed_usec = ::GetMicrosecondCount() - start_usec;
   double agg_ms       = elapsed_usec / 1000.0;

//--- compute the point of control and the value area boundaries
   ulong t_va_start = ::GetMicrosecondCount();
   g_value_area.Compute(g_profile, InpCoverage);
   double va_ms = (::GetMicrosecondCount() - t_va_start) / 1000.0;

//--- render the finished profile on the chart
   ulong t_render_start = ::GetMicrosecondCount();
   g_renderer.Render(g_profile, g_value_area, to);
   double render_ms = (::GetMicrosecondCount() - t_render_start) / 1000.0;

   double total_ms = (::GetMicrosecondCount() - t_total_start) / 1000.0;

//--- print the performance summary line to the Experts tab. partial=
//--- reports CTickLoader::IsPartial() so a refresh built from a
//--- possibly-truncated tick set is never logged as if it were complete.
   ::PrintFormat(
      "VolumeProfileEA: ticks=%d bins=%d poc=%.5f mode=%s partial=%s skipped_zero_price=%d "
      "load_ms=%.3f scan_ms=%.3f init_ms=%.3f agg_ms=%.3f va_ms=%.3f render_ms=%.3f total_ms=%.3f last_error=%d",
      tick_count, g_profile.BinCount(), g_value_area.PocPrice(g_profile),
      (g_loader.UsedAllTicks() ? "all" : "trade"),
      (g_loader.IsPartial() ? "true" : "false"), (int)g_profile.SkippedZeroPriceCount(),
      load_ms, scan_ms, init_ms, agg_ms, va_ms, render_ms, total_ms, g_loader.LastError());
  }
OnInit(), OnDeinit(), OnTimer(), and OnTick() are the lifecycle hooks, and they are short enough to explain together. OnInit() first validates the inputs and refuses to start if any is out of range. It then prints the terminal build, core count, memory and operating system once, followed by the symbol, timeframe and inputs in use, so every timing line later in the Experts log can be tied to the conditions it was measured under. If a fixed InpBinSize was given, it is aligned to the tick size here, with a warning when the value changes.
Next it enables CHART_SHIFT so the renderer has open space to draw into, and clears any bars left from a previous run so the renderer starts from an empty baseline. Finally it runs the pipeline once and starts a timer. OnDeinit() stops that timer and clears every object the renderer drew. OnTimer() simply calls RunPipeline() again. OnTick() stays empty on purpose, since the pipeline is driven by the timer. Re-aggregating a full session on every tick would defeat the point of batching.
//+------------------------------------------------------------------+
//| OnInit                                                           |
//| OnInit runs the pipeline once on load and starts the refresh     |
//| timer.                                                           |
//+------------------------------------------------------------------+
int OnInit(void)
  {
   if(!ValidateInputs())
      return(INIT_PARAMETERS_INCORRECT);

//--- log the environment once, so timing lines in the Experts log can be
//--- tied to the terminal build and hardware they were measured on
   ::PrintFormat("VolumeProfileEA: build=%d cores=%d ram_mb=%d x64=%s os=%s",
                 (int)::TerminalInfoInteger(TERMINAL_BUILD),
                 (int)::TerminalInfoInteger(TERMINAL_CPU_CORES),
                 (int)::TerminalInfoInteger(TERMINAL_MEMORY_PHYSICAL),
                 (::TerminalInfoInteger(TERMINAL_X64) ? "true" : "false"),
                 ::TerminalInfoString(TERMINAL_OS_VERSION));
   ::PrintFormat("VolumeProfileEA: symbol=%s period=%s bin_size=%.8f target_bins=%d coverage=%.2f refresh_s=%d",
                 ::_Symbol, ::EnumToString(::Period()), InpBinSize, InpTargetBins, InpCoverage, InpRefreshSeconds);

//--- align a fixed InpBinSize to a whole multiple of the tick size (never
//--- below one tick) and warn once when the value had to change
   g_fixed_bin = 0.0;
   if(InpBinSize > 0.0)
     {
      double step     = TickStep();
      double multiple = ::MathMax(1.0, ::MathRound(InpBinSize / step));
      g_fixed_bin     = multiple * step;
      if(::MathAbs(g_fixed_bin - InpBinSize) > step * 0.000001)
         ::PrintFormat("VolumeProfileEA: InpBinSize %.8f is not a multiple of the tick size %.8f, using %.8f",
                       InpBinSize, step, g_fixed_bin);
     }

//--- give the profile room to draw into open space right of the last candle.
//--- 15 percent leaves room for the renderer's 5 hour margin plus its 4 hour
//--- longest bar on an H1 chart with roughly a hundred bars visible; raise it
//--- on other timeframes or when zoomed far out
   ::ChartSetInteger(0, CHART_SHIFT, true);
   ::ChartSetDouble(0, CHART_SHIFT_SIZE, 15.0);

//--- clear any objects left over from a previous run with this prefix
//--- before drawing, so Render()'s diff-based updates start from a known,
//--- empty baseline rather than assuming the chart is already clean
   g_renderer.Clear();

   RunPipeline();
   ::EventSetTimer(InpRefreshSeconds);
   return(INIT_SUCCEEDED);
  }

//+------------------------------------------------------------------+
//| OnDeinit                                                         |
//+------------------------------------------------------------------+
void OnDeinit(const int reason)
  {
   ::EventKillTimer();
   g_renderer.Clear();
  }

//+------------------------------------------------------------------+
//| OnTimer                                                          |
//+------------------------------------------------------------------+
void OnTimer(void)
  {
   RunPipeline();
  }

//+------------------------------------------------------------------+
//| OnTick                                                           |
//+------------------------------------------------------------------+
void OnTick(void)
  {
  }
EURUSD H1 — Volume Profile Overlay
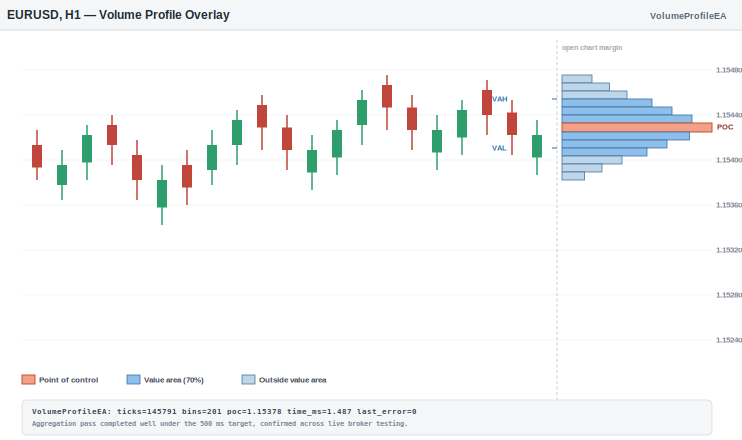
EURUSD H1, Volume Profile Overlay. An illustration of the rendered output: candlesticks on the left with the volume profile drawn into the open chart margin on the right, the point of control highlighted in orange, and the value area shaded in blue. Measured timings appear in the table in Section 9.
Section 8: Verification — TestVolumeProfile.mq5
Before trusting a performance number, it helps to confirm the arithmetic against data small enough to check by hand.
TestAssert() is the small function every check runs through. It counts a pass or a fail and prints immediately on failure, so a broken run points straight at the offending assumption instead of requiring a scroll through the whole log.
//+------------------------------------------------------------------+
//|                                            TestVolumeProfile.mq5 |
//+------------------------------------------------------------------+
#property script_show_inputs

#include <VolumeProfileAggregator/VolumeProfile.mqh>
#include <VolumeProfileAggregator/ValueArea.mqh>

#define ASSERT(condition, message) TestAssert((condition), (message))

int g_pass_count = 0;
int g_fail_count = 0;

//+------------------------------------------------------------------+
//| TestAssert                                                       |
//+------------------------------------------------------------------+
void TestAssert(const bool condition, const string message)
  {
   if(condition)
     {
      g_pass_count++;
     }
   else
     {
      g_fail_count++;
      ::Print("FAIL: ", message);
     }
  }
TestBinQuantization() checks that known prices land in the exact bin indices the formula predicts, and that a price below price_min clamps to bin zero instead of a negative index.
//+------------------------------------------------------------------+
//| TestBinQuantization                                              |
//+------------------------------------------------------------------+
void TestBinQuantization(void)
  {
   CVolumeProfile profile;
   profile.Initialize(1.1000, 1.1030, 0.0001);

   MqlTick t0, t5, t23, t_below;
   ::ZeroMemory(t0);
   ::ZeroMemory(t5);
   ::ZeroMemory(t23);
   ::ZeroMemory(t_below);

   t0.last      = 1.1000;
   t5.last      = 1.1005;
   t23.last     = 1.1023;
   t_below.last = 1.0990;

   profile.AddTick(t0);
   profile.AddTick(t5);
   profile.AddTick(t23);
   profile.AddTick(t_below);

   ASSERT(profile.BinVolume(0)  == 2, "bin 0 should hold the base tick plus the clamped below-range tick");
   ASSERT(profile.BinVolume(5)  == 1, "price 1.1005 should land in bin 5");
   ASSERT(profile.BinVolume(23) == 1, "price 1.1023 should land in bin 23");
  }
TestAggregationAndPoc() runs Aggregate() over ten synthetic ticks spread across four known price levels. It checks every per-bin volume, the total volume, and the point of control bin against values worked out by hand ahead of time.
//+------------------------------------------------------------------+
//| TestAggregationAndPoc                                            |
//+------------------------------------------------------------------+
void TestAggregationAndPoc(void)
  {
   CVolumeProfile profile;
   profile.Initialize(1.1000, 1.1030, 0.0001);

   MqlTick ticks[10];
   ::ZeroMemory(ticks);

   double prices[10] = {1.1000, 1.1000, 1.1005, 1.1005, 1.1005, 1.1010, 1.1010, 1.1010, 1.1010, 1.1023};
   for(int i = 0; i < 10; i++)
      ticks[i].last = prices[i];

   int processed = profile.Aggregate(ticks, 10);

   ASSERT(processed == 10, "aggregation pass should process all 10 ticks");
   ASSERT(profile.BinVolume(0)  == 2, "bin 0 should hold 2 ticks");
   ASSERT(profile.BinVolume(5)  == 3, "bin 5 should hold 3 ticks");
   ASSERT(profile.BinVolume(10) == 4, "bin 10 should hold 4 ticks");
   ASSERT(profile.BinVolume(23) == 1, "bin 23 should hold 1 tick");
   ASSERT(profile.TotalVolume() == 10, "total volume should equal the tick count");
   ASSERT(profile.MaxBinIndex() == 10, "the point of control should be bin 10");
  }
TestValueAreaExpansion() is the most involved of the first three. It builds a five-bin histogram with volumes of five, ten, forty, twenty-five, and twenty, deliberately placing the point of control at the forty-volume bin. It then confirms the seventy percent expansion produces exactly the boundaries worked out ahead of time. The value area grows from index two to index three, reaching sixty-five of one hundred units, still short of the target. It then grows to index four, reaching eighty-five units and clearing the target. The greedy rule picks index four over index one because twenty exceeds ten.
//+------------------------------------------------------------------+
//| TestValueAreaExpansion                                           |
//+------------------------------------------------------------------+
void TestValueAreaExpansion(void)
  {
   CVolumeProfile profile;
   profile.Initialize(1.1000, 1.1004, 0.0001);

   MqlTick ticks[100];
   ::ZeroMemory(ticks);

   int    index = 0;
   double level_price[5]  = {1.1000, 1.1001, 1.1002, 1.1003, 1.1004};
   int    level_volume[5] = {5, 10, 40, 25, 20};

   for(int level = 0; level < 5; level++)
     {
      for(int v = 0; v < level_volume[level]; v++)
        {
         ticks[index].last = level_price[level];
         index++;
        }
     }

   profile.Aggregate(ticks, index);

   CValueArea value_area;
   value_area.Compute(profile, 0.70);

   ASSERT(value_area.PocIndex() == 2, "the POC should be the 40-volume bin at index 2");
   ASSERT(value_area.ValueAreaLowIndex()  == 2, "VAL should stay at index 2");
   ASSERT(value_area.ValueAreaHighIndex() == 4, "VAH should expand to index 4");
  }
Five tests cover the remaining edge cases. TestAskOnlyTick() confirms a tick with only an ask price is binned correctly. TestZeroPriceTickSkipped() confirms a tick with no usable price is dropped and counted. TestVolumeRealFraction() confirms a volume_real of 2.75 keeps its fractional part. TestUpperBoundBinCount() confirms a profile of five thousand and one bins fills its first and last bins correctly. TestSinglePriceProfile() covers a session in which every valid tick has the same price, so the range has zero width. The profile must build with a single bin, all three ticks must land in it, and the point of control and both value area edges must collapse onto that bin.
//+------------------------------------------------------------------+
//| TestAskOnlyTick                                                  |
//+------------------------------------------------------------------+
void TestAskOnlyTick(void)
  {
   CVolumeProfile profile;
   profile.Initialize(1.1000, 1.1030, 0.0001);

   MqlTick t;
   ::ZeroMemory(t);
   t.ask = 1.1005;

   profile.AddTick(t);

   ASSERT(profile.BinVolume(5) == 1.0, "ask-only tick should bin using the ask price");
   ASSERT(profile.SkippedZeroPriceCount() == 0, "ask-only tick must not be counted as skipped");
  }

//+------------------------------------------------------------------+
//| TestZeroPriceTickSkipped                                         |
//+------------------------------------------------------------------+
void TestZeroPriceTickSkipped(void)
  {
   CVolumeProfile profile;
   profile.Initialize(1.1000, 1.1030, 0.0001);

   MqlTick t;
   ::ZeroMemory(t);   // last, bid, ask all 0.0

   profile.AddTick(t);

   ASSERT(profile.BinVolume(0) == 0.0, "zero-price tick must not land in bin 0");
   ASSERT(profile.TotalVolume() == 0.0, "zero-price tick must not count toward total volume");
   ASSERT(profile.SkippedZeroPriceCount() == 1, "zero-price tick must be counted as skipped");
  }

//+------------------------------------------------------------------+
//| TestVolumeRealFraction                                           |
//+------------------------------------------------------------------+
void TestVolumeRealFraction(void)
  {
   CVolumeProfile profile;
   profile.Initialize(1.1000, 1.1030, 0.0001);

   MqlTick t;
   ::ZeroMemory(t);
   t.last        = 1.1005;
   t.volume_real = 2.75;

   profile.AddTick(t);

   ASSERT(::MathAbs(profile.BinVolume(5) - 2.75) < 0.0000001, "fractional volume_real must be preserved, not truncated");
  }

//+------------------------------------------------------------------+
//| TestUpperBoundBinCount                                           |
//+------------------------------------------------------------------+
void TestUpperBoundBinCount(void)
  {
   CVolumeProfile profile;
   bool ok = profile.Initialize(1.00000, 1.05000, 0.00001); // 5000 bins

   MqlTick t_first, t_last;
   ::ZeroMemory(t_first);
   ::ZeroMemory(t_last);
   t_first.last = 1.00000;
   t_last.last  = 1.05000;

   profile.AddTick(t_first);
   profile.AddTick(t_last);

   ASSERT(ok, "a 5000-bin profile should initialize successfully");
   ASSERT(profile.BinCount() == 5001, "bin count should match (range / bin_size) + 1");
   ASSERT(profile.BinVolume(0) == 1.0, "the first bin should receive the low-edge tick");
   ASSERT(profile.BinVolume(profile.BinCount() - 1) == 1.0, "the last bin should receive the high-edge tick");
  }

//+------------------------------------------------------------------+
//| TestSinglePriceProfile                                           |
//+------------------------------------------------------------------+
void TestSinglePriceProfile(void)
  {
   CVolumeProfile profile;
   bool ok = profile.Initialize(1.1000, 1.1000, 0.0001);

   MqlTick ticks[3];
   ::ZeroMemory(ticks);
   for(int i = 0; i < 3; i++)
      ticks[i].last = 1.1000;
   profile.Aggregate(ticks, 3);

   CValueArea value_area;
   bool computed = value_area.Compute(profile, 0.70);

   ASSERT(ok, "a zero-width price range should initialize");
   ASSERT(profile.BinCount() == 1, "a single-price profile should have one bin");
   ASSERT(profile.BinVolume(0) == 3, "all three ticks should land in the only bin");
   ASSERT(computed && value_area.PocIndex() == 0 && value_area.ValueAreaLowIndex() == 0 &&
          value_area.ValueAreaHighIndex() == 0, "POC, VAL and VAH should all be bin 0");
  }
OnStart() ties the tests together and prints one final summary line. Running this script on a live terminal, rather than only reasoning about the arithmetic on paper, confirmed that the compiled classes agree with the expected values for the scenarios covered here. A run on 2026.11.06 reported twenty-seven assertions passed and zero failed: three from TestBinQuantization, seven from TestAggregationAndPoc, three from TestValueAreaExpansion, two from TestAskOnlyTick, three from TestZeroPriceTickSkipped, one from TestVolumeRealFraction, four from TestUpperBoundBinCount, and four from TestSinglePriceProfile. Passing every assertion confirms these specific scenarios behave as described. It does not, by itself, confirm the classes are correct under every real trading condition, since a script passing its own checks is a narrower claim than general correctness.
//+-------------------------------------------------------------------+
//| OnStart                                                           |
//+-------------------------------------------------------------------+
void OnStart(void)
  {
   TestBinQuantization();
   TestAggregationAndPoc();
   TestValueAreaExpansion();
   TestAskOnlyTick();
   TestZeroPriceTickSkipped();
   TestVolumeRealFraction();
   TestUpperBoundBinCount();
   TestSinglePriceProfile();

   ::PrintFormat("TestVolumeProfile: %d passed, %d failed", g_pass_count, g_fail_count);
  }
Section 9: Field Notes from Multi-Broker Testing
Running this pipeline on three broker demo servers surfaced issues that reasoning about the code alone would not have caught. Two of them shaped the implementation and are described in Sections 3 and 7. The pattern applies beyond this project: trust nothing about a live terminal until it has been observed under real conditions.
The first issue was tick history synchronization. On two brokers and more than one instrument, CopyTicksRange() returned a non-zero count that stopped increasing across dozens of refreshes, with an error code that a naive success check never surfaces. Logging the error code on every line, not only on failure, turned a suspicion into a diagnosis. The second was bin sizing. One fixed width tuned for forex gave over six hundred thousand mostly empty bins on a metals symbol. Sizing the width from the observed range and rounding it up to the tick size keeps the bin count near the target on every symbol tested.
A third observation needed no code change. The medians are steady, but the worst refreshes are not. At 14:47 and 14:48 terminal time, two refreshes a minute apart showed load_ms of 1.2 to 3.2 seconds on all three instruments at once. Every other stage was normal, last_error was 0, and the load was not flagged partial. All three Expert Advisors shared one terminal, so a terminal-level cause such as the history subsystem or operating-system contention is plausible. This log cannot separate it from the network, the broker's server, or chart redraw timing. Smaller one-stage spikes also occur, for example a maximum render_ms of 6.6 ms against a median of 0.26 ms on USDJPY. The worst spike was about a tenth of the 30-second interval. It was noted, not chased.
The table covers a 35-minute run on 2026.11.06 on MetaQuotes-Demo, from 14:39 to 15:14 terminal time. The server clock was one hour ahead. One VolumeProfileEA ran on each of three H1 charts in the same terminal: a major forex pair, a yen cross, and a metals symbol. The terminal was MetaTrader 5 build 6291 on Windows 11 Pro (build 26200), on a Dell G15 5530 laptop with an Intel Core i7-13650HX processor (14 cores, 20 logical processors) and 64 GB of RAM. Inputs were the defaults: InpBinSize 0, InpTargetBins 200, InpCoverage 0.70, and InpRefreshSeconds 30.
Each instance logged 71 refreshes. The first refresh is reported separately, because the terminal is still synchronizing tick history. The other 70 count as steady state and form the sample, with none removed, so spikes appear in the maximum and the 95th percentile. The table gives the minimum, median, 95th percentile, and maximum of each stage in milliseconds. Ticks grew from 248,745 to 274,214 on EURUSD, from 399,910 to 423,971 on USDJPY, and from 284,142 to 299,658 on XAUUSD. Bins stayed at 191 on USDJPY and 199 on XAUUSD, and rose from 183 to 200 on EURUSD.
| Instrument | Statistic | load_ms | scan_ms | init_ms | agg_ms | va_ms | render_ms | total_ms |
|---|---|---|---|---|---|---|---|---|
| EURUSD | min | 12.53 | 0.70 | 0.000 | 1.13 | 0.000 | 0.14 | 14.58 |
| EURUSD | median | 24.80 | 1.12 | 0.001 | 1.95 | 0.001 | 0.25 | 28.19 |
| EURUSD | 95th percentile | 60.45 | 2.98 | 0.003 | 4.26 | 0.002 | 0.57 | 68.92 |
| EURUSD | max | 2903.00 | 4.83 | 0.003 | 11.81 | 0.003 | 2.52 | 2905.99 |
| USDJPY | min | 20.51 | 1.20 | 0.000 | 1.76 | 0.000 | 0.14 | 24.38 |
| USDJPY | median | 40.88 | 1.75 | 0.001 | 3.20 | 0.001 | 0.26 | 46.36 |
| USDJPY | 95th percentile | 83.15 | 6.24 | 0.001 | 7.58 | 0.003 | 0.64 | 102.20 |
| USDJPY | max | 3167.91 | 12.82 | 0.001 | 9.63 | 0.003 | 6.60 | 3173.12 |
| XAUUSD | min | 11.70 | 0.79 | 0.000 | 1.21 | 0.000 | 0.09 | 13.92 |
| XAUUSD | median | 25.57 | 1.31 | 0.001 | 2.38 | 0.001 | 0.14 | 29.34 |
| XAUUSD | 95th percentile | 43.57 | 3.24 | 0.002 | 5.19 | 0.002 | 0.30 | 49.39 |
| XAUUSD | max | 1646.07 | 4.63 | 0.018 | 12.63 | 0.022 | 1.80 | 1649.00 |
load_ms dominates: at the median it is 87 to 88 percent of total_ms, matching the O(n + m) accounting in Section 7. The median agg_ms of 1.95 to 3.20 ms agrees with the 1.4 to 3.0 ms in the Section 1 benchmark. The largest total_ms values, 1.6 to 3.2 seconds, are the coincident spikes. Without those two refreshes, the largest was 149 ms on EURUSD, 111 ms on USDJPY, and 53 ms on XAUUSD.
The first refresh is slower while the terminal synchronizes tick history. Its load_ms was 1,383 ms on EURUSD, 2,487 ms on USDJPY, and 1,023 ms on XAUUSD. These ran after the Section 1 benchmark had already read the day's ticks, so a cold first refresh can be slower still. In that benchmark, XAUUSD received error 4403 for about 55 seconds before its ticks arrived.
Every refresh logged mode=all. MetaQuotes-Demo returned no trade ticks for any of the three symbols, metals included, so these profiles are tick-count histograms and the COPY_TICKS_TRADE path was not exercised (Section 11). The lines below are copied from the Experts log. The first two are printed once by OnInit(), followed by the first, a near-median, and the slowest refresh for each instrument.
2026.11.06 14:39:12.735  VolumeProfileEA: build=6291 cores=20 ram_mb=65228 x64=true os=Windows 11 build 26200
2026.11.06 14:39:12.735  VolumeProfileEA: symbol=EURUSD period=PERIOD_H1 bin_size=0.00000000 target_bins=200 coverage=0.70 refresh_s=30

EURUSD, first refresh
2026.11.06 14:39:14.121  VolumeProfileEA: ticks=248745 bins=183 poc=1.11738 mode=all partial=false skipped_zero_price=0 load_ms=1383.069 scan_ms=1.181 init_ms=0.016 agg_ms=1.876 va_ms=0.002 render_ms=0.208 total_ms=1386.360 last_error=0
EURUSD, near the median
2026.11.06 14:40:44.173  VolumeProfileEA: ticks=250036 bins=183 poc=1.11738 mode=all partial=false skipped_zero_price=0 load_ms=24.527 scan_ms=1.112 init_ms=0.000 agg_ms=2.187 va_ms=0.002 render_ms=0.223 total_ms=28.061 last_error=0
EURUSD, slowest
2026.11.06 14:48:17.031  VolumeProfileEA: ticks=256500 bins=183 poc=1.11738 mode=all partial=false skipped_zero_price=0 load_ms=2902.998 scan_ms=1.102 init_ms=0.001 agg_ms=1.739 va_ms=0.001 render_ms=0.141 total_ms=2905.991 last_error=0

USDJPY, first refresh
2026.11.06 14:39:27.256  VolumeProfileEA: ticks=399910 bins=191 poc=157.87100 mode=all partial=false skipped_zero_price=0 load_ms=2487.123 scan_ms=1.854 init_ms=0.017 agg_ms=3.202 va_ms=0.001 render_ms=0.206 total_ms=2492.410 last_error=0
USDJPY, near the median
2026.11.06 15:00:27.303  VolumeProfileEA: ticks=414265 bins=191 poc=157.87100 mode=all partial=false skipped_zero_price=0 load_ms=40.894 scan_ms=1.626 init_ms=0.001 agg_ms=3.523 va_ms=0.001 render_ms=0.191 total_ms=46.245 last_error=0
USDJPY, slowest
2026.11.06 14:47:30.444  VolumeProfileEA: ticks=405918 bins=191 poc=157.87100 mode=all partial=false skipped_zero_price=0 load_ms=3167.907 scan_ms=1.755 init_ms=0.000 agg_ms=3.213 va_ms=0.001 render_ms=0.235 total_ms=3173.120 last_error=0

XAUUSD, first refresh
2026.11.06 14:39:19.071  VolumeProfileEA: ticks=284142 bins=199 poc=4045.35000 mode=all partial=false skipped_zero_price=0 load_ms=1023.434 scan_ms=1.300 init_ms=0.016 agg_ms=2.213 va_ms=0.001 render_ms=0.113 total_ms=1027.085 last_error=0
XAUUSD, near the median
2026.11.06 14:56:19.112  VolumeProfileEA: ticks=292052 bins=199 poc=4045.35000 mode=all partial=false skipped_zero_price=0 load_ms=26.513 scan_ms=1.050 init_ms=0.000 agg_ms=2.056 va_ms=0.001 render_ms=0.138 total_ms=29.769 last_error=0
XAUUSD, slowest
2026.11.06 14:48:20.716  VolumeProfileEA: ticks=288394 bins=199 poc=4045.35000 mode=all partial=false skipped_zero_price=0 load_ms=1646.074 scan_ms=1.195 init_ms=0.001 agg_ms=1.630 va_ms=0.001 render_ms=0.092 total_ms=1648.999 last_error=0
Section 10: Extending the Aggregator
The five-class design leaves room for extension. A composite profile across multiple days is a matter of choosing a wider from and to pair than the single-day window that Resolve() returns. CVolumeProfile is then initialized once against the combined price range of every day involved, and each day's ticks are fed into that same bin array.
Splitting bins by bid and ask direction turns a single volume profile into a delta profile, showing not just how much volume traded at each price but whether it leaned toward buying or selling. That change touches AddTick() most directly. Instead of one array, the class would maintain two, incrementing the bid-side array when a tick sits closer to the bid and the ask-side array otherwise.
Incremental updates matter once a session runs long enough that a full re-aggregation on every timer tick becomes wasteful. The loader could track the last processed tick's timestamp and request only newer ticks, feeding those into the existing bin array. That turns each refresh from an O(n) pass over the whole session into an O(k) pass over just the new arrivals. This is a different kind of incremental update from the one CProfileRenderer already performs at the chart-object level, described in Section 6. That reuse only avoids recreating chart objects. The tick-level incremental update described here would avoid rereading and re-binning ticks that were already processed on an earlier refresh.
Section 11: Limitations
Forex profiles may use tick counts instead of real trade volume when trade ticks are unavailable. The selected mode is logged.
Prices outside the allocated range are clamped to edge bins until the next refresh. Invalid prices are skipped.
Profiles cover the server calendar day, not actual trading sessions.
Partial tick loads are still displayed, with warnings only in the log.
Rendering becomes slower with hundreds of chart objects, although bar reuse reduces overhead.
Broker history limits, delays, and CopyTicksRange() failures may cause incomplete profiles. Retries and partial-load detection cannot guarantee completeness.
Invalid inputs are rejected at initialization. Positive bin sizes are rounded to the nearest valid tick-size multiple.
Conclusion
Five classes turn raw tick data into a rendered volume profile without ever comparing a tick against a list of candidate price levels. CSessionWindow resolves what to aggregate. CTickLoader fetches the ticks with resilience against the tick history quirks observed across multiple brokers. CVolumeProfile bins every tick in constant time through direct index arithmetic. CValueArea derives the point of control and value area through a standard expansion algorithm. CProfileRenderer draws the result into the chart's open margin rather than over the price action itself, reusing its existing bars from one refresh to the next.
The complexity win is the difference between O(n × m) matching and an O(n) aggregation pass, with a handful of additional O(n) and O(m) stages around it for loading, scanning, initialization, value area computation, and rendering, covered stage by stage in Section 7. In the Section 1 benchmark on the same ticks, direct indexing was 17 to 30 times faster than the nested loop, 1.4 to 3 milliseconds against 27 to 59. On EURUSD, USDJPY, and XAUUSD, the full pipeline had a median of 28 to 46 milliseconds end to end on a steady-state refresh, with a 95th percentile of 49 to 102 milliseconds, against tick counts from roughly 250,000 to 420,000 per session.
Two refreshes per instrument were far slower, up to 3.2 seconds, entirely in the tick load. The first refresh after attaching the Expert Advisor took 1.0 to 2.5 seconds. That full-pipeline total, not the aggregation step alone, is the number worth quoting. What this aggregator does not attempt is worth stating plainly too. It does not reconstruct true trade volume where a broker never provided any. It does not widen its own price range the instant the market escapes what was initialized. It does not manage the rendering cost of an arbitrarily fine grid. Those limits follow directly from the design, and Section 10 sketches how a production version could address each one without abandoning the O(1) binning idea that makes the whole approach worth building.
Programs used in the article:
| # | Name | Type | Description |
|---|---|---|---|
| 1 | SessionWindow.mqh | Include File | CSessionWindow resolves the current server calendar day's time range |
| 2 | TickLoader.mqh | Include File | CTickLoader wrapping CopyTicksRange() with adaptive pre-sizing, retry on 4403 and 4407, and a COPY_TICKS_ALL fallback only when trade ticks are confirmed absent |
| 3 | VolumeProfile.mqh | Include File | CVolumeProfile fixed-size bin array with O(1) tick binning; accepts a single-price range |
| 4 | ValueArea.mqh | Include File | CValueArea computes POC, VAH, and VAL via the expansion algorithm |
| 5 | ProfileRenderer.mqh | Include File | CProfileRenderer draws the histogram in the chart's open margin, reusing its existing bars from one refresh to the next |
| 6 | VolumeProfileEA.mq5 | Expert Advisor | The driver EA with adaptive and fixed bin sizing aligned to the tick-size grid, input validation, stall detection, environment logging, and full-stage performance logging |
| 7 | TestVolumeProfile.mq5 | Script | Verification of quantization, aggregation, POC, value area, ask-only ticks, zero-price filtering, fractional volume, bin-count upper bounds, and single-price sessions |
| 8 | BenchNaiveVsDirect.mq5 | Script | Times a nested-loop aggregation against direct indexing on the same session ticks and counts mismatched bins |
| 9 | VolumeProfileAggregator.zip | Zip Archive | Zip archive containing all the attached files and their paths relative to the terminal's root folder. |
Warning: All rights to these materials are reserved by MetaQuotes Ltd. Copying or reprinting of these materials in whole or in part is prohibited.
This article was written by a user of the site and reflects their personal views. MetaQuotes Ltd is not responsible for the accuracy of the information presented, nor for any consequences resulting from the use of the solutions, strategies or recommendations described.


