

Encoding Candlestick Patterns (Part 5): Expanding Taxonomy of Candlestick for General Pattern Frequency Analysis
 69
69
 0
0

Introduction
Throughout this series, candlesticks that fell outside the predefined classification rules were collapsed into a single symbol: the underscore (_). This bucket made no distinction between a bullish candle that simply failed to meet the body-to-wick thresholds and a bearish candle that did the same—both were flattened into the same neutral placeholder. In Part 3 and Part 4, this limitation became difficult to ignore. The unclassified symbol consistently dominated both the single- and double-candlestick frequency tables across GBPUSD and gold (XAUUSD), on every timeframe tested. Rather than treating this frequency as evidence of recurring market structure, it highlights a limitation of the current classification scheme: a substantial proportion of candles do not fit the defined categories and are therefore assigned to the unclassified class. Consequently, the frequency of the unclassified symbol should be interpreted primarily as an indication of classification coverage, rather than as evidence of a meaningful or actionable market pattern.
With this refinement, we re-run the frequency analysis pipeline developed in Parts 3 and Part 4 on the same case-study instruments, GBPUSD and gold, using the M15 and H1 timeframes. The goal is to test whether splitting the underscore reveals which structures and transitions truly dominate price action.
Objective
The primary objective of this article is to expand the candlestick encoding alphabet introduced in Part 1 so that unclassified candlesticks are separated into directional categories, and to re-evaluate the single- and double-candlestick frequency profiles established in Parts 3 and 4 under this expanded scheme.
Specifically, we will:
- Extend the CandleType() classification function so that any candle failing the existing shape rules is assigned N (unclassified bullish) or n (unclassified bearish) instead of a single neutral symbol.
- Re-encode 1,500-candle samples of GBPUSD and gold (XAUUSD) on the M15 and H1 timeframes using the expanded 11-symbol alphabet (A, a, G, g, H, h, E, e, D, N, n).
- Compute single- and double-candlestick frequency and percentage statistics, sorted in descending order, under the new taxonomy.
- Compare the resulting distributions across instruments and timeframes to determine whether the expanded taxonomy reveals structure that the collapsed '_' symbol had obscured.
- Test the expanded system on diverse assets, including BTCUSD, OilCash, and GBPJPY, to observe how pattern uniqueness increases with sequence length.
The resulting script is designed to be flexible: the user can choose to output either the full encoded series together with its frequency analysis, or the frequency analysis alone, and can adjust the pattern length being extracted without modifying the underlying logic.
Expanding the Taxonomy
The change required to support the new taxonomy is minimal but consequential. In the original CandleType() function (Part 1, refined in Part 3), any bullish candle that did not satisfy the Marubozu, spinning-top, pinbar, or inverted-pinbar conditions simply fell through to the default return value, (_). The same applied to bearish candles. Because the fallthrough was direction-agnostic, both cases produced an identical symbol.
The fix is to place a directional fallback inside each branch rather than outside both of them:
//+------------------------------------------------------------------+
//|  Candle Type labeling function                                   |
//+------------------------------------------------------------------+
string CandleType(const double &open[], const double &close[],
                  const double &high[], const double &low[], int idx)
  {
   double o = open[idx];
   double c = close[idx];
   if(c == o)
      return "D";

   double body      = MathAbs(c - o);
   double upperWick = high[idx] - MathMax(o, c);
   double lowerWick = MathMin(o, c) - low[idx];
   bool isBullish   = (c > o);

  //--- Candle type return
   if(body > 1.5 * upperWick && body > 1.5 * lowerWick)
      return isBullish ? "A" : "a";
   if(2 * body < upperWick && 2 * body < lowerWick)
      return isBullish ? "G" : "g";
   if(lowerWick > 2.5 * body && lowerWick > 2 * upperWick)
      return isBullish ? "H" : "h";
   if(upperWick > 2.5 * body && upperWick > 2 * lowerWick)
      return isBullish ? "E" : "e";
   return isBullish ? "N" : "n";
  }
The revised CandleType() function accepts the open, close, high, and low price arrays together with the candle index. It first determines whether the candle is bullish, bearish, or neutral, then calculates the body size, upper wick, and lower wick. These measurements are compared against the classification rules to identify the appropriate candle type and return its corresponding alphabet.
If the candle does not satisfy any of the predefined patterns (A/a, G/g, H/h,or E/e), the function assigns a default type based on its direction: N for a bullish candle and n for a bearish candle. This guarantees that every non-neutral candle receives a classification, eliminating unclassified candles while preserving the bullish or bearish direction.
Code Structure
Every other component of the pipeline—CountPatterns(), SortPatternsByCount(), and SaveMarketStructureToFile(), all introduced in Part 4—requires little or no modification to support the new symbols. Because these functions operate on the encoded string generically, they automatically accommodate N and n without any change to their pattern-matching logic. This is a direct benefit of the symbolic, text-based design established early in the series: expanding the alphabet only changes what characters can appear in the series, not how the series is processed. Two of these functions, CountPatterns() and SaveMarketStructureToFile(), were nonetheless adjusted slightly in this article to improve output performance and usability; SortPatternsByCount() is unchanged from Part 4.
CountPatterns() pre-allocates memory for the maximum number of unique patterns instead of growing the array dynamically. This avoids repeated reallocations, which become expensive as both sample size and pattern length increase. Actual pattern uniqueness is tracked separately with a uniqueCount variable, incremented only when a newly-encountered pattern has no match among those already stored. Once the sliding-window scan completes, the array is resized down from its pre-allocated maximum to uniqueCount, discarding the unused capacity.
//+------------------------------------------------------------------+
//| Count all patterns of the specified length                       |
//+------------------------------------------------------------------+
void CountPatterns(string series, int plen, PatternData &patterns[])
  {
   int len = StringLen(series);
   if(len < plen)
      return;

   int totalSlides = len - plen + 1;

   ArrayResize(patterns, totalSlides); // Pre-allocate to maximum possible unique patterns
   int uniqueCount = 0;

   for(int i = 0; i < totalSlides; i++)
     {
      string pat = StringSubstr(series, i, plen);
      int found = -1;
      //--- Search for existing pattern
      for(int j = 0; j < uniqueCount; j++)
        {
         if(patterns[j].pattern == pat)
           {
            found = j;
            break;
           }
        }
      //--- Increment or add new
      if(found >= 0)
        {
         patterns[found].count++;
        }
      else
        {
         patterns[uniqueCount].pattern = pat;
         patterns[uniqueCount].count   = 1;
         uniqueCount++;
        }
     }
//--- Trim the array to the actual number of unique patterns found
   ArrayResize(patterns, uniqueCount);
  }
The SaveMarketStructureToFile() retains the same overall logic explained in Part 4: it creates a text file name, writes a header, calls CountPatterns() and SortPatternsByCount() to build the ranked frequency table; and writes that table row by row. The one functional addition in this article is a writeRawSeries option, which lets the user choose whether the full encoded character series is written to the file alongside the frequency table, or whether the file contains only the analysis report. This becomes useful once sample sizes grow into the thousands of candles, as in the BTCUSD, GBPJPY, and OilCash tests later in this article—writing out a 15,000-character raw series is rarely necessary once the frequency table itself is the object of interest, and omitting it keeps the output file short and readable.
//+------------------------------------------------------------------+
//| Write series + pattern frequency to TXT file                     |
//+------------------------------------------------------------------+
void SaveMarketStructureToFile(string series, int nlookback, int plen, string filename = "")
  {
   if(StringLen(filename) == 0)
      filename = _Symbol + "_" + TimeFrameToString(Period()) + "_" + IntegerToString(plen) + "-Pattern.txt";

   int handle = FileOpen(filename, FILE_TXT | FILE_WRITE);
   if(handle == INVALID_HANDLE)
     {
      MessageBox("Failed to create file.\nError: " + IntegerToString(GetLastError()), "File Error");
      return;
     }

//--- Write header and raw series
   FileWriteString(handle, "=== MARKET CODED STRUCTURE: "+_Symbol+ "-"+ TimeFrameToString(Period()) + " SERIES ===\r\n");
   if(writeRawSeries)
     {
      FileWriteString(handle, series);
      FileWriteString(handle, "\r\n\r\n");
     }

//--- Analyze patterns
   PatternData patterns[];
   CountPatterns(series, plen, patterns);
   SortPatternsByCount(patterns);

   int totalPatterns = StringLen(series) - plen + 1;
   int uniqueCount   = ArraySize(patterns);

//--- Write analysis report
   FileWriteString(handle, "=== PATTERN FREQUENCY ANALYSIS ===\r\n");
   FileWriteString(handle, "Window: " + IntegerToString(nlookback) + " candles\r\n");
   FileWriteString(handle, "Pattern Length: " + IntegerToString(plen) + " candles\r\n");
   FileWriteString(handle, "Total Sliding Windows: " + IntegerToString(totalPatterns) + "\r\n");
   FileWriteString(handle, "Unique Patterns Found: " + IntegerToString(uniqueCount) + "\r\n");
   FileWriteString(handle, "----------------------------------------------------------------\r\n");
   FileWriteString(handle, "Rank | Pattern | Count | Percentage\r\n");
   FileWriteString(handle, "-----|---------|-------|------------\r\n");

   for(int i = 0; i < uniqueCount; i++)
     {
      double pct = (totalPatterns > 0) ? (patterns[i].count * 100.0 / totalPatterns) : 0.0;
      string report = StringFormat(" %2d  |   %s   |  %3d  |   %6.2f%%\r\n", i + 1, patterns[i].pattern, patterns[i].count, pct);
      FileWriteString(handle, report);
     }
   FileWriteString(handle, "----------------------------------------------------------------\r\n");
   FileClose(handle);
   MessageBox(StringFormat("Results saved to file:\n%s", filename), "Success");
  }
Encoded Candlestick Series
With the expanded taxonomy in place, the encoded series now displays N and n alongside the original nine symbols. A short excerpt of an encoded series might now read ...AGNaHnnAaG... instead of ...AG_aH__AaG..., with every previously ambiguous position now carrying a directional label. The meaning of every other alphabet character is unchanged from Part 1. Figure 1 shows a screenshot of the encoded symbol under the new taxonomy.
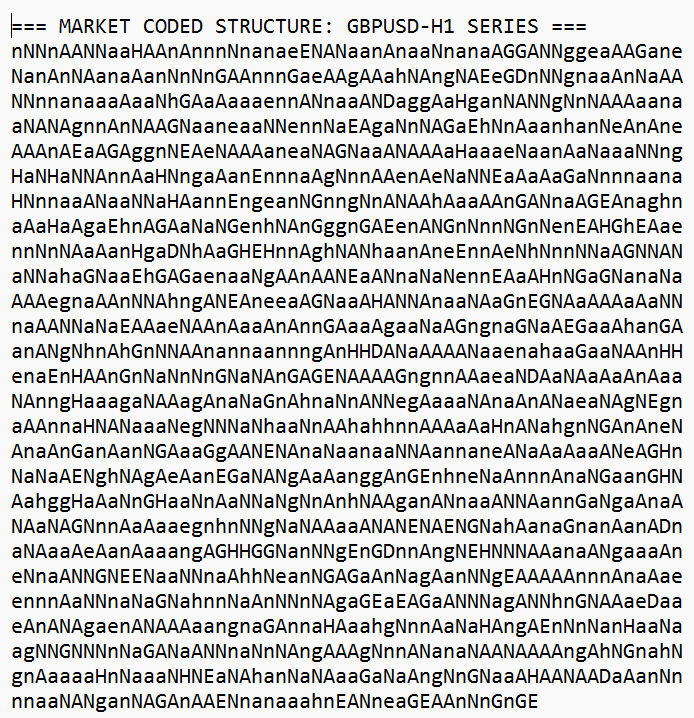
Figure 1: Encoded Series Sample
Case Study: Single and Double Candlestick Analysis
In this section, we examine the frequency statistics of single- and double-candlestick patterns for GBPUSD and gold on the M15 and H1 timeframes. Rather than displaying the full encoded series for every case, we focus on the statistical evidence produced for each timeframe, consistent with the case-study format used in Parts 3 and 4. As in previous parts, each sample consists of 1,500 candlesticks.
GBPUSD Analysis:
- M15 Timeframe: Single-Candlestick Analysis
Table 1: GBPUSD M15 Single-Candlestick Frequency
| Pattern | Count | Percentage |
|---|---|---|
| A | 333 | 22.20% |
| a | 316 | 21.07% |
| n | 284 | 18.93% |
| N | 252 | 16.80% |
| G | 72 | 4.80% |
| g | 66 | 4.40% |
| h | 45 | 3.00% |
| E | 41 | 2.73% |
| e | 40 | 2.67% |
| H | 36 | 2.40% |
| D | 15 | 1.00% |
Table 1 presents the occurrence frequency of all eleven candlestick classes identified by the expanded taxonomy. The Marubozu categories (A and a) dominate the distribution, collectively accounting for 43.27% of all candlesticks. This is consistent with our findings in Parts 3 and 4, where Marubozu-type candles consistently appeared as the most frequent structures across multiple timeframes.
The expanded taxonomy now provides visibility into previously unclassified candles. The bearish unclassified n ranks third with 18.93%, while the bullish unclassified N ranks fourth with 16.80%. Combined, the unclassified categories account for 35.73% of all observations—a substantial portion of the market that was previously represented simply as '_' without directional information. This expansion alone transforms what was once a blind spot into actionable data.
The spinning top categories (G and g) appear with moderate frequency at 4.80% and 4.40%, respectively. Pin bars (H and h) and inverted pin bars (E and e) occur less frequently, ranging from 2.40% to 3.00%. The Doji (D) is the rarest pattern at just 1.00%, consistent with its nature as a neutral indecision candle that typically occurs less frequently than directional candle types.
Aggregating by direction, bullish candles (A, N, G, H, E) account for 48.93% of observations, while bearish candles (a, n, g, h, e) account for 50.07%. This near-perfect symmetry suggests that, over the 1,500-candle sample, the market exhibited a remarkably balanced bullish–bearish structure—a finding that aligns with the symmetry observations documented in earlier parts of this series.
- M15 Timeframe: Double-Candlestick Pattern Analysis
When extending this to double-candlestick patterns, 103 unique permutations were identified.
Table 2: GBPUSD M15 Double-Candlestick Frequency, Patterns Above 2%
| Pattern | Count | Percentage |
|---|---|---|
| AA | 77 | 5.14% |
| an | 72 | 4.80% |
| aA | 71 | 4.74% |
| An | 69 | 4.60% |
| nA | 63 | 4.20% |
| Na | 63 | 4.20% |
| Aa | 63 | 4.20% |
| aa | 61 | 4.07% |
| na | 59 | 3.94% |
| aN | 55 | 3.67% |
| nN | 51 | 3.40% |
| nn | 48 | 3.20% |
| NA | 48 | 3.20% |
| AN | 45 | 3.00% |
| NN | 40 | 2.67% |
| Nn | 38 | 2.54% |
Table 2 shows double-candlestick patterns with above 2%. The double-candlestick pattern analysis for GBPUSD M15 reveals that the AA pattern ranks first with 5.14% of all two-symbol combinations. This is followed by an at 4.80% and aA at 4.74%.
A striking observation is the prominent role of the expanded unclassified categories (N and n) in double patterns. Patterns containing N or n appear in 12 of the 16 patterns listed above (75% of the top patterns). This demonstrates that the expansion of the taxonomy was not merely an academic exercise—unclassified candles frequently participate in recurring two-symbol combinations, and their directional classification now enables traders to analyze these sequences meaningfully.
The dominance of Marubozu-related patterns (AA, aA, Aa, aa) confirms the finding from the single-candlestick analysis that these candle types are the most prevalent market structures. However, the expanded taxonomy reveals that unclassified candles frequently occur alongside Marubozu candles in the observed sequences. For example, the pattern an ranks second in frequency, indicating that a bearish Marubozu is often followed by a bearish unclassified candle. While this recurring sequence is an observable feature of the dataset, its frequency alone does not establish causation or imply that the sequence predicts continuation or consolidation. Such interpretations would require further analysis of conditional probabilities and subsequent price behavior.
The pattern nN at 3.40% and Nn at 2.54% suggest that transitions between unclassified bullish and bearish states occur with measurable frequency, offering potential reversal or continuation signals that were previously invisible under the old taxonomy.
- H1 Timeframe: Single-Candlestick Analysis
Table 3: GBPUSD H1 Single-Candlestick Frequency
| Pattern | Count | Percentage |
|---|---|---|
| a | 327 | 21.80% |
| A | 310 | 20.67% |
| n | 267 | 17.80% |
| N | 264 | 17.60% |
| G | 80 | 5.33% |
| g | 72 | 4.80% |
| e | 49 | 3.27% |
| E | 45 | 3.00% |
| h | 41 | 2.73% |
| H | 36 | 2.40% |
| D | 9 | 0.60% |
In Table 3, the GBPUSD H1 single-candlestick distribution exhibits a similar structure to the M15 timeframe, though with some notable shifts. The bearish Marubozu (a) now ranks first at 21.80%, slightly ahead of the bullish Marubozu (A) at 20.67%. The unclassified categories maintain a substantial presence: bearish unclassified (n) at 17.80% and bullish unclassified (N) at 17.60%, collectively accounting for 35.40% of observations—nearly identical to the M15 figure of 35.73%. This consistency across timeframes suggests that the proportion of unclassified candles is relatively stable for GBPUSD, reinforcing the importance of expanding the taxonomy to capture their directional bias.
The spinning top categories (G at 5.33%, g at 4.80%) appear slightly more frequently on H1 compared to M15, while pin bars (H at 2.40%, h at 2.73%) show a modest decrease. The Doji (D) is notably rare at just 0.60%, even lower than the M15 figure of 1.00%, suggesting that indecision candles are less common at higher timeframes for GBPUSD.
Aggregating by direction, bullish candles account for 49.00% while bearish candles account for 50.40%, maintaining the near-symmetrical balance observed across all analyses in this series.
- H1 Timeframe: Double-Candlestick Pattern Analysis
Using the expanded taxonomy, 104 unique double patterns were identified.
Table 4: GBPUSD H1 Double-Candlestick Frequency, Patterns Above 2%
| Pattern | Count | Percentage |
|---|---|---|
| aa | 76 | 5.07% |
| Aa | 74 | 4.94% |
| aA | 67 | 4.47% |
| AA | 65 | 4.34% |
| aN | 63 | 4.20% |
| NA | 61 | 4.07% |
| Na | 59 | 3.94% |
| An | 58 | 3.87% |
| na | 57 | 3.80% |
| an | 52 | 3.47% |
| nA | 51 | 3.40% |
| AN | 49 | 3.27% |
| nn | 47 | 3.14% |
| nN | 46 | 3.07% |
| Nn | 46 | 3.07% |
| NN | 41 | 2.74% |
The H1 double-candlestick pattern distribution shows aa as the most frequent pattern at 5.07%, consistent with the shift toward bearish dominance observed in the single-candlestick analysis. The alternating patterns Aa (4.94%) and aA (4.47%) follow closely, while AA (4.34%) ranks fourth.
Compared to the M15 results, the H1 timeframe exhibits a higher concentration of Marubozu-only patterns in the top positions. The top four patterns on H1 are all pure Marubozu combinations (aa, Aa, aA, AA), whereas on M15, the top pattern was AA followed by patterns involving unclassified candles (an, aA, An).
Nevertheless, patterns containing N or n remain highly represented, appearing in 12 of the 16 top patterns (75%). The pattern aN ranks fifth at 4.20%, while NA ranks sixth at 4.07%. These sequences suggest that transitions between Marubozu and unclassified states occur regularly within the observed sample that traders can potentially exploit. Statistical testing and out-of-sample analysis would be required to determine whether these observed patterns represent meaningful market structure.
The unclassified-to-unclassified patterns (nn at 3.14%, nN at 3.07%, Nn at 3.07%, NN at 2.74%) collectively account for approximately 12% of all double patterns, providing further evidence that the expanded taxonomy captures meaningful sequential structure in price action that was previously hidden.
XAUUSD Analysis:
- M15 Timeframe Single-Candlestick Analysis
Table 5: XAUUSD M15 Single-Candlestick Frequency
| Pattern | Count | Percentage |
|---|---|---|
| a | 318 | 21.20% |
| N | 289 | 19.27% |
| A | 282 | 18.80% |
| n | 260 | 17.33% |
| G | 107 | 7.13% |
| g | 89 | 5.93% |
| h | 48 | 3.20% |
| E | 42 | 2.80% |
| e | 33 | 2.20% |
| H | 31 | 2.07% |
| D | 1 | 0.07% |
Table 5, the XAUUSD M15 single-candlestick analysis reveals a markedly different distribution compared to GBPUSD. While the bearish Marubozu (a) still ranks first at 21.20%, the bullish unclassified (N) ranks second at an impressive 19.27%—substantially higher than its GBPUSD M15 counterpart of 16.80%. The bullish Marubozu (A) follows at 18.80%, while the bearish unclassified n ranks fourth at 17.33%.
The most striking difference is the significantly higher frequency of spinning top categories for gold. The bullish spinning top (G) appears at 7.13% (compared to 4.80% for GBPUSD M15), and the bearish spinning top (g) at 5.93% (compared to 4.40%). This suggests that gold exhibits more consolidation and indecision patterns than GBPUSD at the M15 resolution, potentially reflecting the different market dynamics of a commodity versus a currency pair.
Pin bars and inverted pin bars occur at frequencies similar to those observed in GBPUSD. In contrast, the Doji (D) is exceptionally rare, accounting for just 0.07% of the sample, with only one occurrence across 1,500 candles. This near-absence of Doji candles in gold's M15 timeframe is a noteworthy finding that may reflect gold's tendency toward more directional price action at this resolution, where clear buyer-seller imbalances dominate.
Aggregating by direction, bullish candles (A, N, G, H, E) account for 50.07%, while bearish candles (a, n, g, h, e) account for 49.86%. The near-perfect symmetry—with a difference of only 0.34%—is remarkable and reinforces the observation that, across sufficiently large samples, markets exhibit balanced directional distributions.
- M15 Timeframe: Double-Candlestick Pattern Analysis
The expanded taxonomy generated 96 unique double-candlestick combinations.
Table 6: XAUUSD M15 Double-Candlestick Frequency, Patterns Above 2%
| Pattern | Count | Percentage |
|---|---|---|
| Na | 74 | 4.94% |
| Aa | 73 | 4.87% |
| aA | 65 | 4.34% |
| aN | 63 | 4.20% |
| aa | 58 | 3.87% |
| an | 58 | 3.87% |
| AN | 58 | 3.87% |
| Nn | 55 | 3.67% |
| NA | 52 | 3.47% |
| nA | 48 | 3.20% |
| na | 48 | 3.20% |
| nN | 48 | 3.20% |
| An | 46 | 3.07% |
| NN | 42 | 2.80% |
| AA | 40 | 2.67% |
| nn | 37 | 2.47% |
From Table 6, the XAUUSD M15 double-candlestick pattern distribution reveals a distinctive structure that reflects gold's unique price-action characteristics. The top pattern is Na (bullish unclassified followed by bearish Marubozu) at 4.94%, closely followed by Aa (bullish Marubozu followed by bearish Marubozu) at 4.87%. This contrasts with GBPUSD M15, where AA was the top pattern, suggesting that gold exhibits more frequent bearish reversals following bullish candles than GBPUSD does.
The prominent position of patterns involving unclassified candles is even more pronounced for gold. 12 out of 16 patterns listed above contain N or n, meaning that 75% of the top double-candlestick patterns on XAUUSD M15 involve at least one unclassified candle. This is a striking finding: unlike GBPUSD, where pure Marubozu patterns occupied the top positions, gold's most frequent double-candlestick patterns all involve the expanded unclassified categories. This underscores the critical importance of the taxonomy expansion for analyzing gold, where unclassified candles play an even more central role in recurring price-action sequences.
The pattern Nn ranks eighth at 3.67%, while NN ranks fourteenth at 2.80%. These unclassified-to-unclassified transitions are more frequent in gold than in GBPUSD, suggesting that gold's price action may spend more time in states that fall outside the strict Marubozu, pin bar, and spinning top definitions.
- H1 Timeframe Single-Candlestick Analysis
Table 7: XAUUSD H1 Single-Candlestick Frequency
| Pattern | Count | Percentage |
|---|---|---|
| a | 328 | 21.87% |
| N | 278 | 18.53% |
| n | 268 | 17.87% |
| A | 267 | 17.80% |
| g | 108 | 7.20% |
| G | 94 | 6.27% |
| E | 47 | 3.13% |
| h | 41 | 2.73% |
| e | 37 | 2.47% |
| H | 32 | 2.13% |
Table 7 shows the bearish Marubozu (a) leading at 21.87%, followed by bullish unclassified (N) at 18.53%, bearish unclassified (n) at 17.87%, and bullish Marubozu (A) at 17.80%. Notably, the Doji (D) is entirely absent from the H1 sample, with only 10 unique patterns identified compared to 11 on M15.
The spinning top categories are even more prominent on H1: bearish spinning top (g) ranks fifth at 7.20%, while bullish spinning top (G) ranks sixth at 6.27%. Combined, spinning tops account for 13.47% of all observations on XAUUSD H1, compared to 13.06% on M15. This sustained high frequency of spinning tops across both timeframes for gold confirms that consolidation patterns are a fundamental characteristic of gold's price action.
The inverted pin bar (E) (3.13%) appears more frequently than its bearish counterpart (e) (2.47%) on H1, while pin bars (h) (2.73%) and (H) (2.13%) show the reverse relationship. These modest asymmetries may provide clues about directional biases in gold's price action at the hourly resolution.
Aggregating by direction, bullish candles account for 47.86% (A, N, G, H, E), while bearish candles account for 52.14% (a, n, g, h, e). This indicates a slight bearish imbalance, with bearish candles occurring more frequently than bullish candles across the 1,500-candle sample.
- H1 Timeframe: Double-Candlestick Pattern Analysis
A total of 95 unique double patterns were identified.
Table 8: XAUUSD H1 Double-Candlestick Frequency, Patterns Above 2%
| Pattern | Count | Percentage |
|---|---|---|
| aA | 67 | 4.47% |
| aa | 67 | 4.47% |
| Na | 62 | 4.14% |
| Aa | 61 | 4.07% |
| an | 59 | 3.94% |
| nn | 56 | 3.74% |
| NN | 56 | 3.74% |
| aN | 55 | 3.67% |
| na | 55 | 3.67% |
| Nn | 49 | 3.27% |
| nN | 48 | 3.20% |
| AN | 47 | 3.14% |
| AA | 46 | 3.07% |
| nA | 46 | 3.07% |
| NA | 44 | 2.94% |
| An | 40 | 2.67% |
Table 8 shows the most common combinations are aA and aa, each contributing 4.47% of the observations, followed by Na (4.14%) and Aa (4.07%). Similar to the M15 timeframe, patterns involving N and n remain highly represented among the most frequent combinations. The consistency across both Gold timeframes demonstrates that the expanded taxonomy successfully captures additional structural information while maintaining stable statistical behaviour.
The unclassified-to-unclassified patterns show notable frequencies: nn and NN each appear at 3.74%. This is higher than the corresponding frequencies for GBPUSD H1 (nn at 3.14%, NN at 2.74%), further supporting the observation that gold exhibits more frequent transitions between unclassified states.
Cross-Instrument and Cross-Timeframe Comparison
Table 9 summarizes the key candlestick pattern metrics across all four datasets.
| Metric | GBPUSD M15 | GBPUSD H1 | XAUUSD M15 | XAUUSD H1 |
|---|---|---|---|---|
| Bullish % | 48.93 | 49 | 50.07 | 47.87 |
| Bearish % | 50.07 | 50.4 | 49.87 | 52.14 |
| Doji % | 1 | 0.6 | 0.07 | 0 |
| A + a % | 43.27 | 42.47 | 40 | 39.67 |
| N + n % | 35.73 | 35.4 | 36.6 | 36.4 |
| Top double pattern | AA (5.14%) | aa (5.07%) | Na (4.94%) | aA / aa (4.47%) |
| Unique double patterns | 103 | 104 | 96 | 95 |
Several observations follow directly from this comparison:
The N + n proportion is stable and consistent with prior parts. Across all four datasets, the combined unclassified share is 35.4%–36.6%. Expanding the taxonomy redistributes this population; it does not change its overall size. This single-candlestick difference propagates directly into the double-candlestick rankings. On GBPUSD, the repeated bullish pattern AA remains a top-four double-candlestick structure, consistent with Part 4. On gold, AA collapses to 13th–15th place, displaced by patterns that pair the Marubozu symbols with N or n.
Unique double-candlestick pattern counts rose across the board. GBPUSD unique double-candlestick pattern count (103–104) and gold's (95–96) are both meaningfully higher than the 83–89 (GBPUSD) and 73–79 (gold) ranges reported in Part 4, confirming that separating N from n increases the granularity of the double-candlestick alphabet without requiring any change to the counting or sorting logic. Gold retains a slightly more bearish tilt at H1. The 52.13% bearish share for XAUUSD H1 is the largest directional imbalance recorded in this study.
General-Purpose Use of the MQL5 Script
Throughout the previous sections, we have demonstrated the single- and double-candlestick pattern analysis using gold and GBPUSD across M15 and H1 timeframes as case studies. However, the MQL5 script file developed for this series is designed for general-purpose use and can be applied to any financial instrument and any timeframe. The script accepts user-defined inputs for symbol, timeframe, lookback period, and output preferences, making it a versatile tool for traders and researchers.
To illustrate the script's broader applicability, we demonstrate its use with three additional instruments with larger sample sizes and pattern lengths as observed in Figures 2-4:
- BTCUSD (M15): Triple‑candlestick patterns over 5,000 candles.
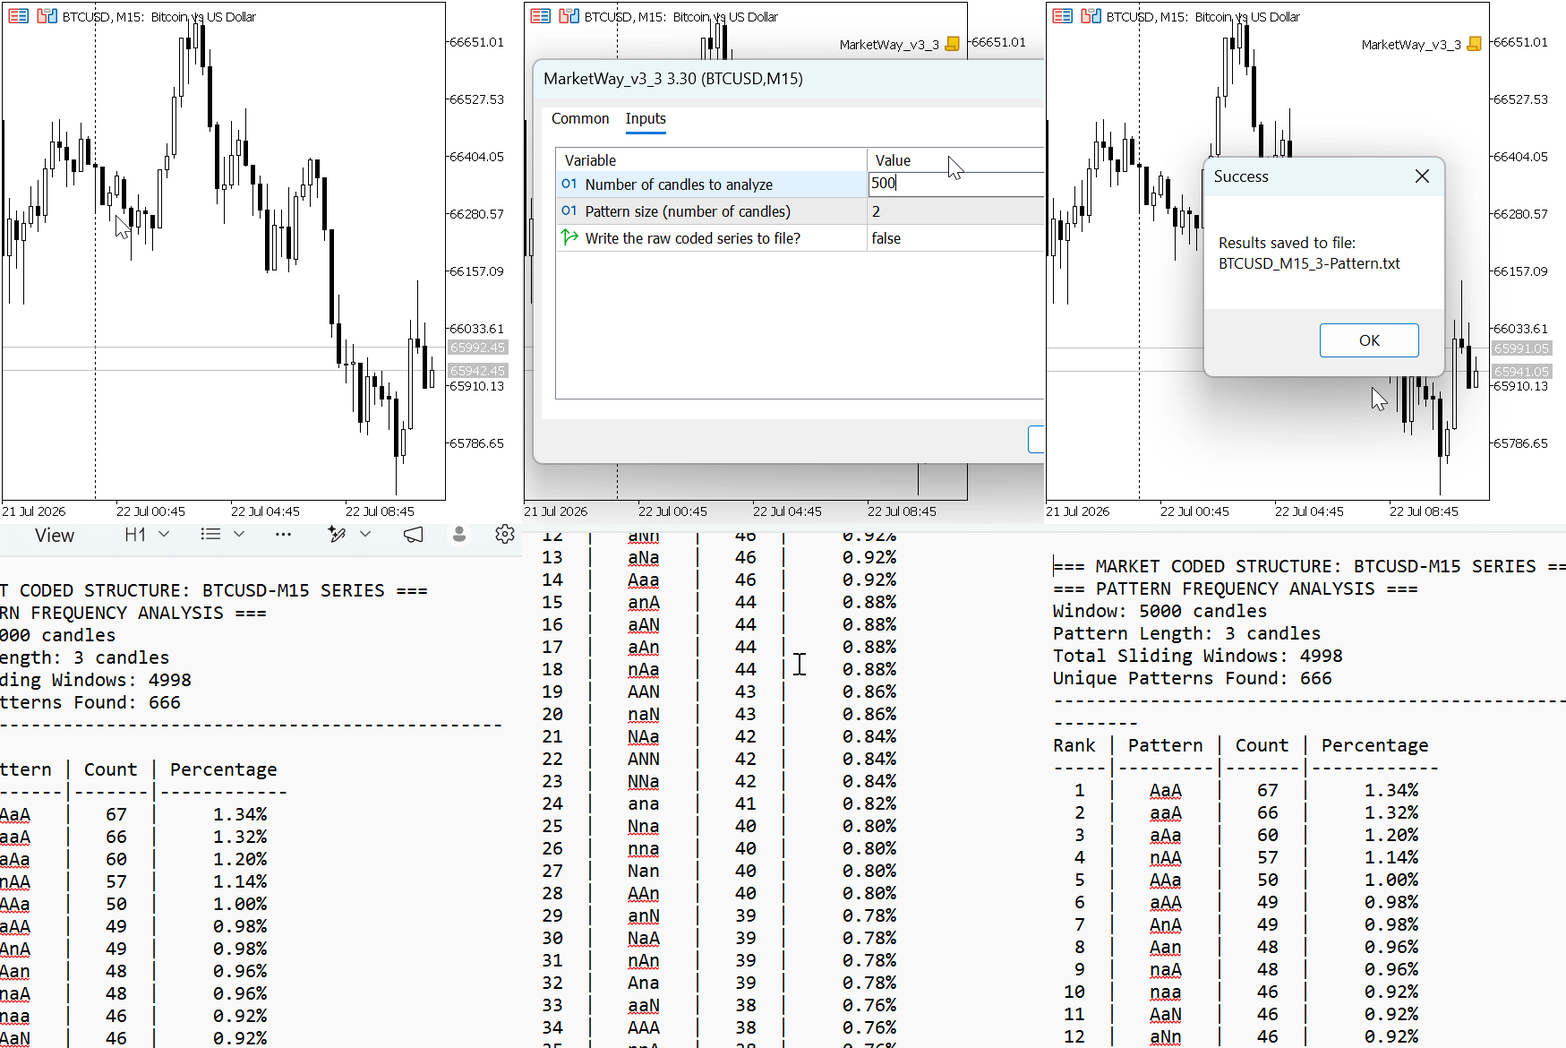
Figure 2: BTCUSD Sample
- GBPJPY (M30): Quadruple‑candlestick patterns over 10,000 candles.
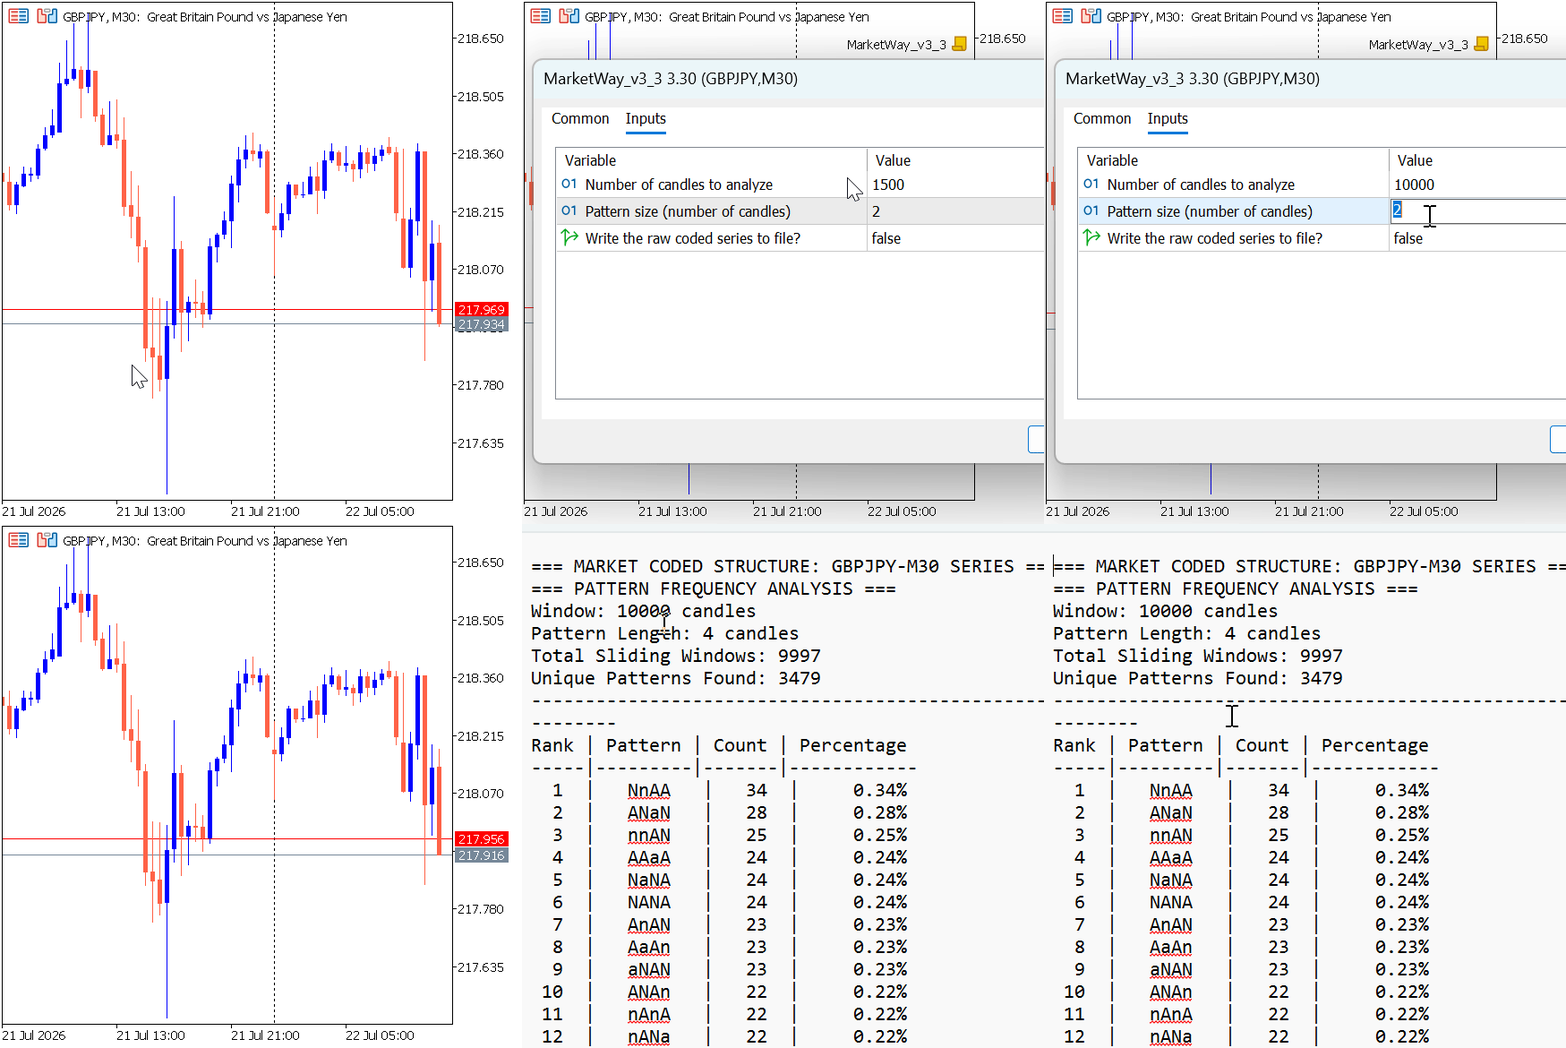
Figure 3: GBPJPY Sample
- OilCash (H1): Sextuple‑candlestick patterns over 15,000 candles.
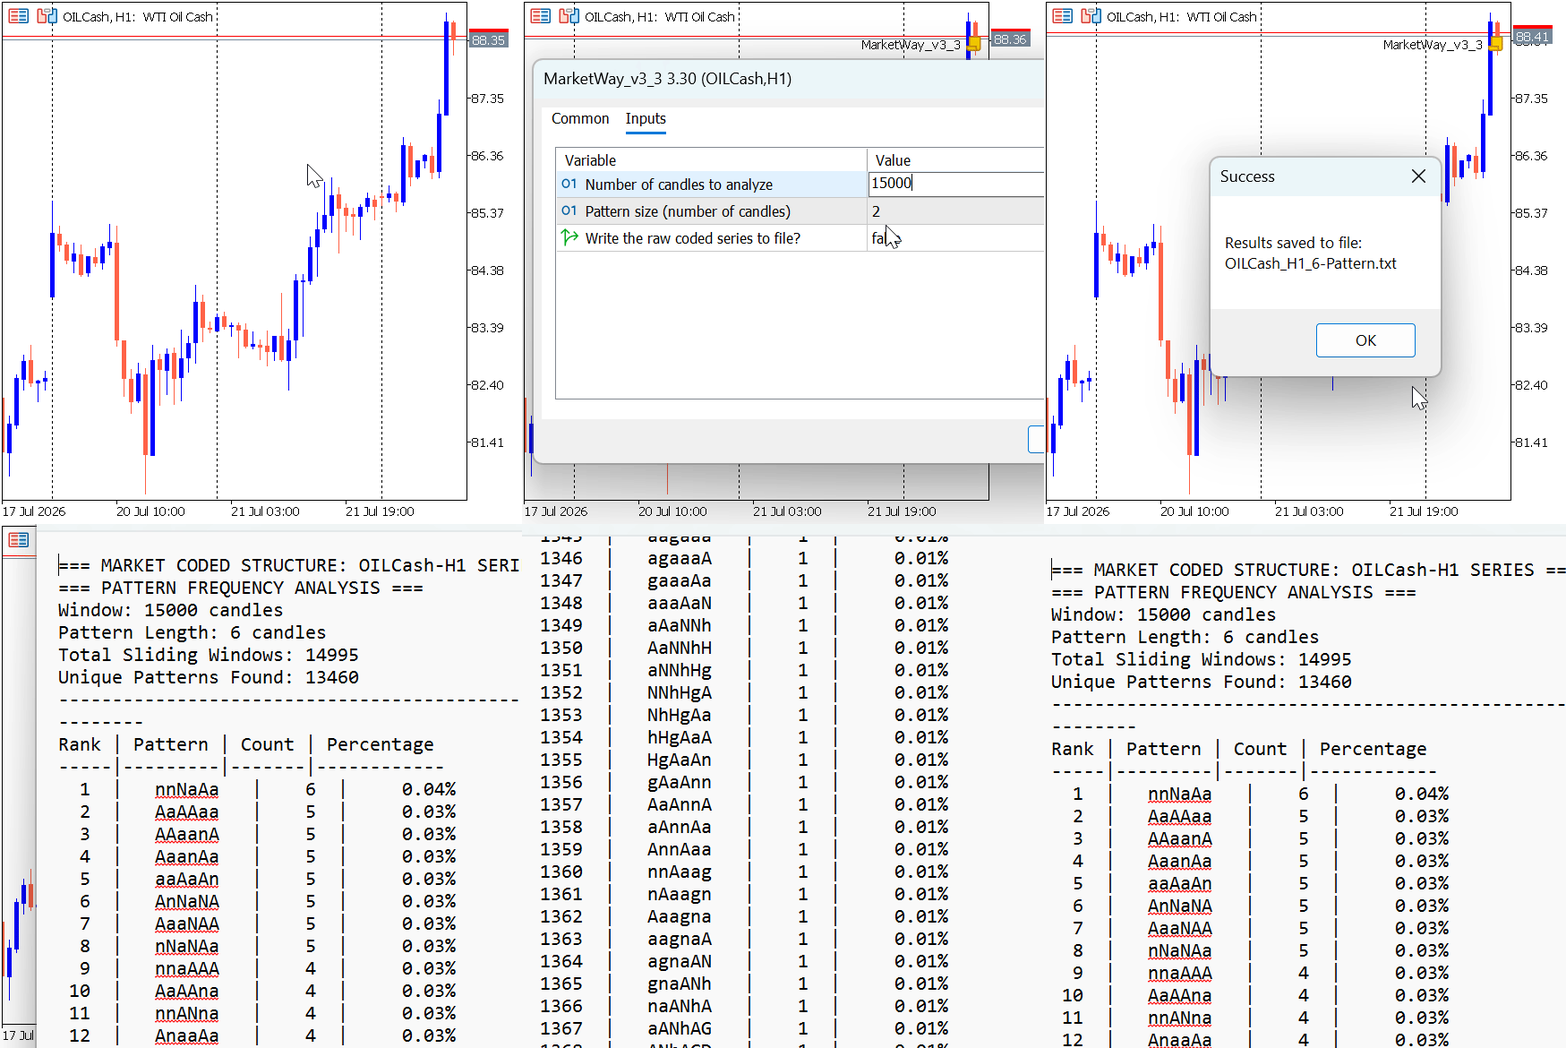
Figure 4: OilCash Sample
These extended tests confirm a key property: as pattern length increases, permutations grow exponentially and the frequency of any single permutation decreases. As a result, pattern uniqueness rises sharply. With our expanded taxonomy of 11 symbol types, the theoretical number of possible sequences is 11^k. For triple patterns (k=3), there are 1,331 possible combinations; for quadruple (k=4), 14,641; for sextuple (k=6), the number increases to 1,771,561. The sample sizes we used—5,000, 10,000, and 15,000 candlesticks, respectively—are far smaller than the theoretical search space for quadruple and especially sextuple patterns, meaning that the vast majority of possible sequences will never appear even once.
These findings have important practical implications for traders and quantitative researchers. While the expanded taxonomy offers a rich language for describing price action, the statistical reliability of a pattern decays rapidly as the pattern length increases. Shorter patterns (single, double, and to a lesser extent triple) provide sufficient repetition to support robust backtesting and signal generation. Conversely, longer patterns—while conceptually interesting—are so rare that they are unlikely to form the basis of any systematic trading strategy with an acceptable sample sizes.
Conclusion
In this article, we extended the candlestick encoding framework by expanding the taxonomy to distinguish previously unclassified bullish and bearish candlesticks. Rather than assigning all unidentified market structures to a single underscore symbol, the new classification introduces the symbols N and n, thereby preserving the directional characteristics of these candles and providing a more informative representation of historical price action.
Using the developed MQL5 script, historical data were encoded automatically, sequential candlestick patterns were extracted, and comprehensive frequency statistics were generated for both single- and double-candlestick combinations. The statistical analysis performed on GBPUSD and XAUUSD across the M15 and H1 timeframes demonstrated that the expanded taxonomy consistently captures additional market information while maintaining stable pattern distributions across different instruments and timeframes.
The results further show that the newly introduced bullish and bearish unclassified candles account for a significant proportion of market activity, confirming that the previous underscore notation concealed valuable structural information. By separating these candles according to their directional behavior, the encoded sequences become more descriptive, enabling clearer statistical interpretation and more meaningful pattern analysis.
Furthermore, as demonstrated throughout this series, increasing the pattern length continues to increase the number of unique permutations while reducing the frequency of individual occurrences. Consequently, higher-order candlestick combinations provide greater uniqueness but occur less frequently in historical data, illustrating the natural trade-off between pattern specificity and statistical repetition.
The expanded taxonomy therefore represents an important refinement of the candlestick encoding methodology developed throughout this series. It improves the completeness of the symbolic representation while preserving the objective, quantitative framework required for large-scale statistical analysis of financial markets. Future extensions of this work can build upon this richer encoding system to investigate higher-order candlestick structures, transition probabilities, probabilistic forecasting models, build indicators, and expert advisors based on encoded market sequences.
Warning: All rights to these materials are reserved by MetaQuotes Ltd. Copying or reprinting of these materials in whole or in part is prohibited.
This article was written by a user of the site and reflects their personal views. MetaQuotes Ltd is not responsible for the accuracy of the information presented, nor for any consequences resulting from the use of the solutions, strategies or recommendations described.

 From Deal History to Hazard Curves: Survival Analysis Applied To Strategies
 Neural Networks in Trading: A Unified View of Space and Time (Global-Local Attention)
 Features of Experts Advisors
 Competitive Swarm Optimizer (CSO)

- Free trading apps
- Over 8,000 signals for copying
- Economic news for exploring financial markets
You agree to website policy and terms of use