

Building a Correlation-Aware Portfolio Risk Monitor in MQL5
 2 251
2 251
 2
2

Introduction
First, a quick note: I won't rehash the obvious. I'll focus on what correlation means for your actual risk. You already know correlation exists. If you've been trading for more than a week, you know that EUR/USD and GBP/USD tend to drift the same way, that when the dollar moves, it drags half your watchlist with it, and that gold and the indices sometimes hold hands and sometimes don't. That's not news. Most people in this game understand, at least intuitively, that their positions have relationships. But here's the question I actually want to sit on, because this is the part almost nobody can answer: Do you know by how much?
Like, sure, you feel that two of your trades are related. You know the news that hits one hits the other. Fine. But do you know the number? Is that relationship inflating your real risk by 20% or by 90%? Because those are wildly different situations, and they look identical on your Trade tab. "These two move together" is an intuition. It's not a number you can size against. And risk is a number. So, if your feel about correlation never turns into an actual value, you're managing your book on a hunch. And it gets worse the more you trade, interestingly. With two positions, okay, maybe you can hold the relationship in your head. Add a third position, then a fourth and a fifth. At that point, risk is driven by every pairwise interaction. Each correlation either adds risk or offsets it. Nobody eyeballs that. I don't mind how experienced you are; you cannot look at five open trades and feel the combined number. It's not a thing the human head does.
So that's what this is about. I'm not here to tell you correlation exists. You know that; it's been known forever; it's not a discovery. What I want to expose is the gap between knowing your trades are related and knowing, as an actual number, how that specific mix of relationships is building up your risk right now. Because that gap is where accounts get hurt. You think you're diversified because you added variety. But variety isn't the same as independence, and the only way to know the difference is to measure it. The goal is simple: turn the hunch into a number. Then you can tell whether five trades are five independent bets or one bet repeated five times. I'll build it from the ground up. The math is real, but I'll keep it plain, and any symbol that shows up, I'll tell you what it means before I use it. You don't need a finance degree for this. I have one, and honestly the part that matters here fits on one page.
And we won't stop at the math. By the end, you'll have two working programs. A script you can read top to bottom, which computes the number on demand. And a service that starts with your terminal watches the account continuously, keeps a small plain-language panel alive on your chart, and pings your phone the moment your risk crosses a threshold. You will not have to remember to check anything. The checking comes to you.
Two kinds of risk, and only one of them goes away
Before any formulas, one idea. It comes straight out of portfolio theory, and it makes everything else click. [1]
The risk on any position splits into two pieces. One piece belongs only to that instrument. A single stock's earnings surprise, one pair's central bank doing something weird, a supply shock in one commodity. The textbooks call this unsystematic risk, but the useful name is diversifiable risk, because that's the point of it. You can reduce it by holding things that don't move together. One position zigs, another zags, the instrument-specific noise partly cancels, and the whole book ends up calmer than any single piece. [2]
The other piece is shared. The broad risk-on, risk-off tide. A dollar move that touches every USD pair at the same second. A liquidity shock that pulls everything correlated down together. This one is called systematic risk, and you cannot diversify it away. It does not matter how many positions you add. If the new position carries the same shared driver as the ones you already hold, you're not spreading risk. You're buying more of the same exposure and calling it something else. [2]
And this is precisely where traders fool themselves. I've done it too. You add a fourth trade, and it feels like variety, a different ticker, maybe a different asset class. But if it responds to the same dollar move as the other three, you didn't diversify. You added weight to a bet you already had, and the position list makes it look like spreading. One line, and it's the spine of everything that follows: correlation is what decides whether your trades are genuinely different bets or the same bet wearing different names. So we measure it.
The number itself
The measure is the Pearson correlation coefficient. [3] In the books, it's the Greek letter rho, written ρ. One number, always between minus 1 and plus 1, and reading it takes ten seconds: near plus 1, the two instruments move together, same direction, almost every time. Two positions like that in the same direction are close to one doubled bet. Near 0, there is no reliable relationship. These are the genuinely independent bets, the ones diversification is actually made of. Near minus 1, they move opposite. One is a natural hedge for the other.
Where does the number come from? Underneath it sits covariance, which asks a simple question about two return series: when one is above its average, does the other tend to be above its average too? If yes, covariance is positive. If they tend to be on opposite sides, it's negative. Then we divide by each instrument's own volatility, its standard deviation, and that division is just a cleanup step. It squeezes the raw covariance into that tidy minus 1 to plus 1 scale, so a strong relationship reads as 0.8 whether the instruments are sleepy or violent. [3]
rho(i, j) = cov(i, j) / ( sd(i) * sd(j) )
You will not compute this by hand; the terminal will do it from bar history in a minute. But it helps to know what the number is, because from here on it's the main character. To anchor it in something real: EUR/USD and GBP/USD are two of the most reliably positive pairs on any retail platform, commonly sitting somewhere around 0.7 to 0.9. Both are quoted against the dollar, both economies sit next to each other, and any dollar move shows up in both quotes at the same time. A trader long both isn't running two positions. The coefficient says so. [4]
The formula your platform quietly assumes away
Now the key step, and it's where the naive number breaks. The risk of a single position is its volatility. The instinct says the risk of two positions together is just the two added up. The actual formula for the variance of a two-asset portfolio (variance is volatility squared, the standard risk measure in portfolio theory) is this: [1]
var(portfolio) = w1²·sd1² + w2²·sd2² + 2·w1·w2·rho·sd1·sd2
Every piece in plain words: w1 and w2 are the weights, how much of your money sits in each position. SD1 and SD2 are each position's own volatility. Rho is the correlation we just met. The first two terms are the standalone risks; no surprise there. The third term is the entire story. That 2·w1·w2·rho·sd1·sd2 is the interaction between your positions, and rho is its volume knob. Watch what it does at the extremes. If rho is 0, independent bets, the term disappears. Risks combine gently. Diversification works exactly as advertised. If rho is plus 1, identical bets, the term maxes out, and the whole expression collapses into the risks added in full. Zero diversification benefit. You doubled one bet. If rho is minus 1, a perfect hedge, the term goes fully negative and can cancel the other two. Risk can fall toward zero.
Now here is the uncomfortable part. Your platform shows every position on its own line, with its own P/L and its own margin. Displaying them that way is mathematically the same as assuming the third term is zero for you. That rho equals 0 across your whole book. And for a real trading book full of USD pairs, indices, and metals, that assumption is rarely true.
For more than two positions, the same idea just grows. The variance becomes a sum over every pair of positions, each pair with its own weight and its own rho. In matrix notation, people write it as w transpose Sigma w, where Sigma is the covariance matrix that holds every pairwise relationship at once. [1] You don't need the notation. You need the consequence: every pair in your book has one of these interaction terms; they all add up, and none of them are on your screen.
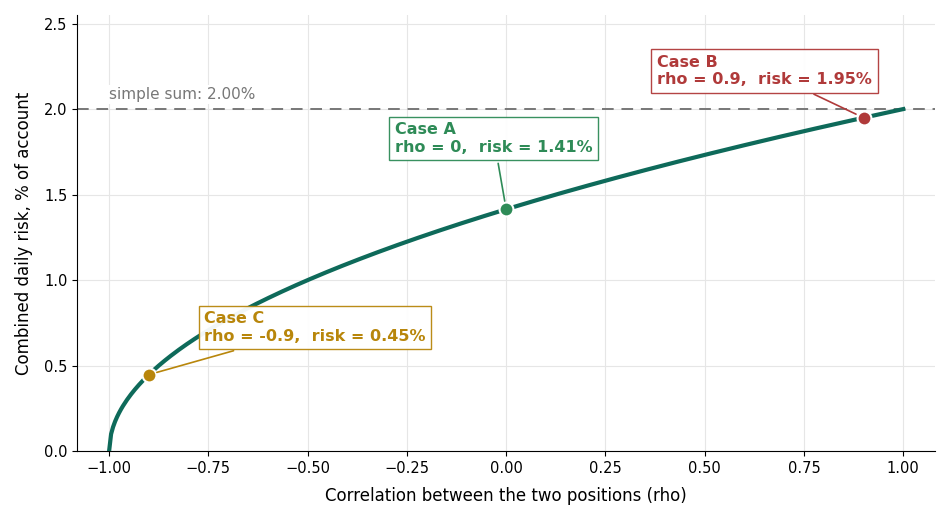
Two positions of 1% each: the combined daily risk as a function of the correlation between them.
Watch the risk move without touching a single lot
Round numbers so you can follow with a phone calculator. Two positions. Each has a daily volatility worth 1% of the account, equal weights. Only one thing will change between the three cases: rho.
- Case A: Genuinely different bets, rho = 0.
var = 1 + 1 + 2·(0) = 2 risk = sqrt(2) ≈ 1.41%
Two independent 1% positions give you about 1.41% combined, less than the 2% you get by adding, because independent wobbles partly cancel. That's diversification actually working.
- Case B: The same bet in disguise, rho = 0.9. This is roughly equivalent to being long EUR/USD and long GBP/USD.
var = 1 + 1 + 2·(0.9) = 3.8 risk = sqrt(3.8) ≈ 1.95%
Same two positions, same sizes, and now the combined risk is 1.95%, nearly the full add-up. At 0.9, they are almost in one position. You felt diversified. The number says you weren't.
- Case C: A real hedge, rho = -0.9.
var = 1 + 1 + 2·(−0.9) = 0.2 risk = sqrt(0.2) ≈ 0.45%
Now the positions largely cancel each other, and the combined risk collapses under half a percent. Sit with what just happened. The lot sizes never moved. The stops never moved. The only thing that changed was a number you cannot see anywhere in your terminal, and your real risk swung from 0.45% to 1.95%. More than four times. Between a book that's nearly hedged and a book that's nearly a doubled bet, the platform shows you the same screen.
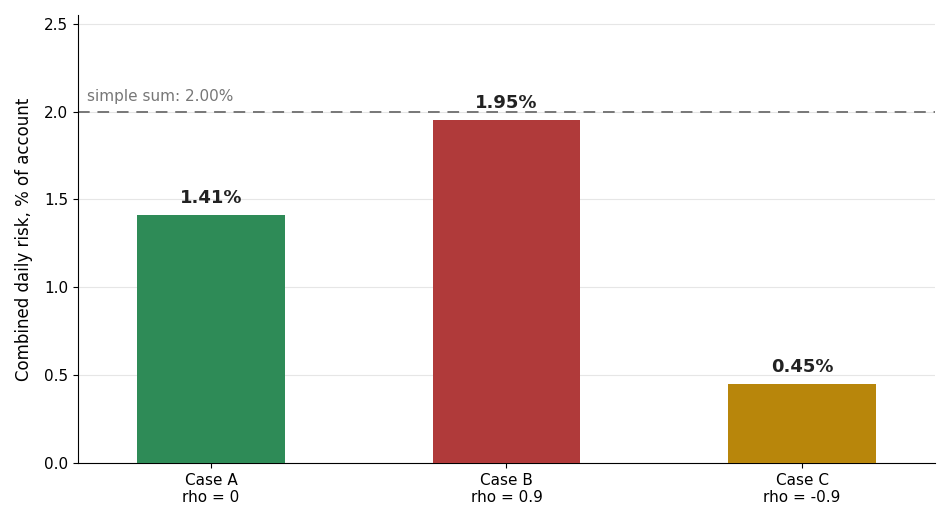
Same two positions, same sizes, only the correlation changes: the real risk swings from 0.45% to 1.95%.
Now scale that up to five positions, or eight, where every pair contributes its own interaction term, some inflating you, some offsetting, all at once. That's how a book that reads as five tidy 1% trades ends up behaving like a single bet worth 8 or 9% of the account on the day the shared driver moves. The intuition "these are related" was true the whole time. It just never told you the size of it.
Getting the number out of MetaTrader
Enough theory. Below is a small script (not an EA). Drop it on a chart once to run the calculation. It reads your open positions, pulls recent H1 history for each symbol, builds the covariance matrix, and prints three things: your naive risk (positions treated as independent), your true correlation-adjusted risk, and how much hidden risk the gap between them represents. For clarity, the script makes a few simplifications: it uses nominal exposure weights, log returns from the last 200 H1 bars, and reports one-standard-deviation daily risk in account currency. It's a measuring tool, not a full risk system. You can read every line of it.
//+------------------------------------------------------------------+
//| PortfolioRiskCheck.mq5 - teaching script                         |
//| Prints naive vs correlation-adjusted portfolio risk              |
//+------------------------------------------------------------------+
#property script_show_inputs
input ENUM_TIMEFRAMES TF       = PERIOD_H1;
input int             LookBack = 200;

#define MAXP 30

//+------------------------------------------------------------------+
//| Money per unit of price move, per lot                            |
//+------------------------------------------------------------------+
double MoneyPerPrice(string s)
  {
   double tv=SymbolInfoDouble(s,SYMBOL_TRADE_TICK_VALUE);
   double ts=SymbolInfoDouble(s,SYMBOL_TRADE_TICK_SIZE);
   return (ts>0 ? tv/ts : 0);
  }

//+------------------------------------------------------------------+
//| Script program start function                                    |
//+------------------------------------------------------------------+
void OnStart()
  {
   string sym[MAXP];
   double expo[MAXP];
   int n=0;

//--- 1. collect open positions as signed nominal exposure
   for(int i=0;i<PositionsTotal() && n<MAXP;i++)
     {
      ulong tk=PositionGetTicket(i);
      if(!PositionSelectByTicket(tk))
         continue;
      string s=PositionGetString(POSITION_SYMBOL);
      double vol=PositionGetDouble(POSITION_VOLUME);
      double pr =PositionGetDouble(POSITION_PRICE_CURRENT);
      double sgn=(PositionGetInteger(POSITION_TYPE)==POSITION_TYPE_BUY? 1:-1);
      double nom=sgn*vol*MoneyPerPrice(s)*pr;
      int k=-1;
      for(int j=0;j<n;j++)
         if(sym[j]==s)
            k=j;
      if(k<0)
        {
         k=n;
         sym[n]=s;
         expo[n]=0;
         n++;
        }
      expo[k]+=nom;
     }
   if(n<2)
     {
      Print("Need at least 2 open positions.");
      return;
     }

//--- 2. time-aligned log returns for every symbol
   datetime t0[];
   if(CopyTime(sym[0],TF,0,LookBack+1,t0)<LookBack+1)
     { Print("Not enough history."); return; }
   ArraySetAsSeries(t0,true);
   static double ret[MAXP][512];
   int m=LookBack;
   if(m>511)
      m=511;
   for(int s2=0;s2<n;s2++)
      for(int t=0;t<m;t++)
        {
         double a=iClose(sym[s2],TF,iBarShift(sym[s2],TF,t0[t],false));
         double b=iClose(sym[s2],TF,iBarShift(sym[s2],TF,t0[t+1],false));
         ret[s2][t]=(a>0 && b>0 ? MathLog(a/b) : 0);
        }

//--- 3. covariance matrix
   static double mu[MAXP], cov[MAXP][MAXP];
   for(int i=0;i<n;i++)
     {
      double s3=0;
      for(int t=0;t<m;t++)
         s3+=ret[i][t];
      mu[i]=s3/m;
     }
   for(int i=0;i<n;i++)
      for(int j=i;j<n;j++)
        {
         double c=0;
         for(int t=0;t<m;t++)
            c+=(ret[i][t]-mu[i])*(ret[j][t]-mu[j]);
         c/=(m-1);
         cov[i][j]=c;
         cov[j][i]=c;
        }

//--- 4. naive risk vs true portfolio risk
   double naive2=0, pv=0, gross=0;
   for(int i=0;i<n;i++)
      gross+=MathAbs(expo[i]);
   for(int i=0;i<n;i++)
     {
      naive2 += expo[i]*expo[i]*cov[i][i];
      for(int j=0;j<n;j++)
         pv += expo[i]*expo[j]*cov[i][j];
     }
   double barsPerDay = 1440.0/MathMax(1,PeriodSeconds(TF)/60);
   double naive = MathSqrt(MathMax(naive2,0))*MathSqrt(barsPerDay);
   double truev = MathSqrt(MathMax(pv,0))    *MathSqrt(barsPerDay);

   PrintFormat("Positions: %d   Gross exposure: %.0f %s",
               n, gross, AccountInfoString(ACCOUNT_CURRENCY));
   PrintFormat("Naive daily risk (independence assumed): %.2f", naive);
   PrintFormat("TRUE daily risk (correlation included) : %.2f", truev);
   if(naive>0)
      PrintFormat("Hidden factor: your real risk is %.0f%% of the naive number.",
                  100.0*truev/naive);

//--- 5. who is actually driving it
   Print("Risk contribution per symbol:");
   for(int i=0;i<n && pv>0;i++)
     {
      double contr=0;
      for(int j=0;j<n;j++)
         contr += expo[i]*expo[j]*cov[i][j];
      PrintFormat("  %-10s %6.1f%%", sym[i], 100.0*contr/pv);
     }
  }
//+------------------------------------------------------------------+
Running it takes about thirty seconds. Save the code as PortfolioRiskCheck.mq5 in MQL5\Scripts\PortfolioRiskCheck\ (create the folder) or unpack the attached MQL5.zip into your terminal data folder, and every file lands in its place. Open MetaEditor and compile; you want zero errors. Back in the terminal, open the Navigator, find PortfolioRiskCheck under Scripts, and drag it onto any chart while you have at least two positions open. It reads your whole account, not just that chart's symbol, so it does not matter which chart you use. The result prints instantly in the Experts tab. That is it. Run it again any time your positions change. Three lines in the output matter.
The naive number is what your risk would be if every position lived on its own island. It's the mental math most traders carry around. The true number is the portfolio variance formula from earlier, applied to your actual book, every pairwise interaction included. The hidden factor is the ratio between them, and it's the punchline of this whole article as a single percentage. Above 100 means your positions gang up on you; your real risk is bigger than the independent sum suggests. Below 100 means you're carrying real hedges and your book is calmer than it looks. Either way, now it's a number instead of a feeling.
The contribution list at the end answers the follow-up question you'll immediately have: fine, so where is my risk actually sitting? Each position's share of the total variance tells you which trades are really driving the book.
I ran it on my own account. Here's what it said
Theory is theory, so let me show you the output from my actual book while writing this. Five open positions: BTCUSD, US500, EURUSD, GBPUSD, and US100, about 143,000 USD of gross exposure.2026.07.15 18:46:51.512 PortfolioRiskCheck (US500.cash,H1) Positions: 5 Gross exposure: 142570 USD
2026.07.15 18:46:51.513 PortfolioRiskCheck (US500.cash,H1) Naive daily risk (independence assumed): 314.73
2026.07.15 18:46:51.513 PortfolioRiskCheck (US500.cash,H1) TRUE daily risk (correlation included) : 492.39
2026.07.15 18:46:51.513 PortfolioRiskCheck (US500.cash,H1) Hidden factor: your real risk is 156% of the naive number.
2026.07.15 18:46:51.513 PortfolioRiskCheck (US500.cash,H1) Risk contribution per symbol:
2026.07.15 18:46:51.513 PortfolioRiskCheck (US500.cash,H1) BTCUSD 6.4%
2026.07.15 18:46:51.513 PortfolioRiskCheck (US500.cash,H1) US500.cash 9.8%
2026.07.15 18:46:51.513 PortfolioRiskCheck (US500.cash,H1) EURUSD 22.3%
2026.07.15 18:46:51.513 PortfolioRiskCheck (US500.cash,H1) GBPUSD 35.4%
2026.07.15 18:46:51.513 PortfolioRiskCheck (US500.cash,H1) US100.cash 26.1%
Look at the two risk numbers. The naive figure, the one that treats every position as its own island, says 314. The true figure, the one that includes how these five actually move together, says 492. That is a hidden factor of 156%. My real risk is more than half again bigger than the naive number tells me, and nothing on my Trade tab would ever show me that. Why so high? Because there is no hedge in here. Every position is contributing positive risk, and several of them are the same bet in different clothes. GBPUSD is 35% of my total risk, US100 is 26%, and EURUSD is 22%. Those are largely one-directional bets on the dollar and on risk appetite, spread across three tickers so it feels diversified. It is not. The math adds their overlap back in, and the number jumps.
If you had asked me before running this, I would have said five positions across FX, indices, and crypto sounded reasonably spread out. The script says otherwise. It says I am carrying 56% more risk than the naive number, concentrated in a dollar and risk-on bet I did not fully realize I had stacked. That is the point of measuring. The answer is not always comforting. Sometimes it credits a hedge you forgot you had, and sometimes, like here, it tells you the book you thought was diversified is really one bet wearing five names. But it tells you the truth, in numbers, and your Trade tab never will.
A monitor that watches the account for you
Running a script by hand has one problem. You have to remember to run it, and the moment that matters most, right before you add a position, is precisely when you are least likely to stop and do it. So, the practical version of all this cannot be something you run. It has to be something that runs by itself. MQL5 has a program type built for exactly this: the service. It lives in MQL5\Services; it starts together with the terminal, and it runs in its own thread, so a looped service cannot slow down anything else you have running. The only event it handles is OnStart, and inside OnStart you are allowed to loop forever. You add it once, and from then on, it just exists in the background, doing its job from the moment the terminal opens until the moment it closes.
So that is what we build here. One service, three jobs, in an endless loop. It measures. Every cycle it redoes the whole calculation from this article on your live account: positions, covariance matrix, naive risk, true risk, hidden factor, and which trade is carrying the book. It shows. The service draws a small panel on one of your open charts and keeps it current. Not a wall of statistics. Three lines, plain words: Is your real risk bigger than it looks, what could you lose on a bad day, and is one trade quietly carrying everything? You glance at it the way you glance at a clock.
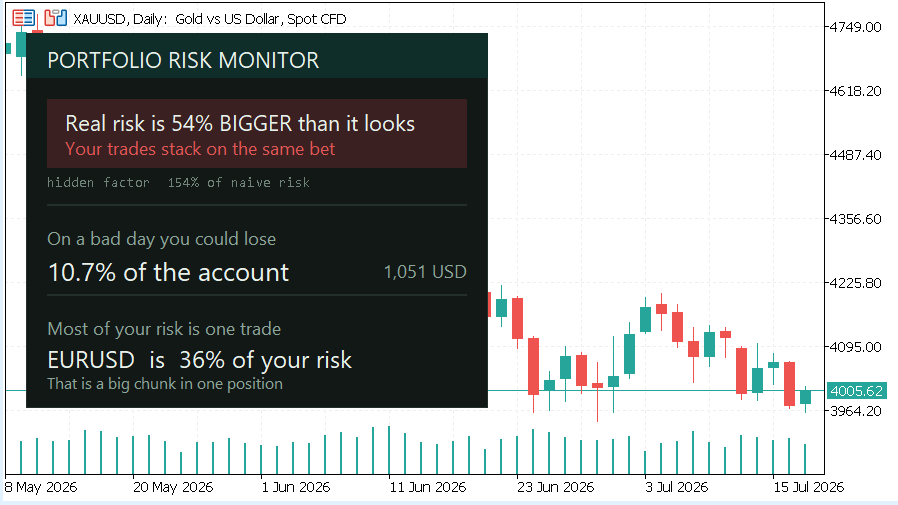
Portfolio Risk Check Panel
It interrupts. And honestly, this is the part I actually care about, because a panel only works while you are looking at the screen, and risk does not wait for you to be at the desk. So, the service also checks every cycle against three thresholds, and when your book crosses one, it pushes to your phone. The thresholds are all adjustable via the input parameters. The hidden factor reaches 130%. Your real risk is now at least 1.3 times the naive number. The stacking got serious. The true daily risk reaches 3% of the account. Whatever the correlations are doing, the absolute number is now big. A single position reaches 50% of total risk. More than half the book's risk is sitting in one trade.
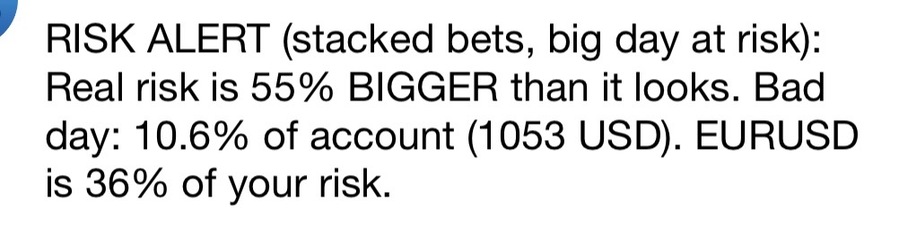
Notification
One design decision: the service must not spam you. The terminal limits push frequency, and repeated alerts quickly become ignored. So the service only notifies when the situation changes, when a new threshold is crossed that was not crossed a minute ago, and if the breach simply persists, it waits out a cooldown before repeating itself. One push when your book turns into a stacked bet. Not one push per minute for as long as it stays that way.
Project Structure
Three files. I will walk them from the result backwards, because that is how you will meet them anyway: the thing that runs, the math it runs on, and the version you have already read. The service app, PortfolioRiskMonitorService.mq5. The thing that runs. Startup checks that push notifications can actually reach your phone, the panel rendering, and the infinite loop: recompute, redraw, compare against the three thresholds, notify on a state change, or after the cooldown. It contains no math of its own.
The engine, PortfolioRiskMonitor.mqh. One class, CRiskEngine, holds the entire calculation: collect open positions as signed exposure, build time-aligned returns, build the covariance matrix, compute naive risk, true risk, the hidden factor, and the top risk contributor, plus a Summary() method that turns the result into one plain sentence ready to be pushed to a phone. If you are a developer, this include is the part you can lift into your own tools unchanged.
The script, PortfolioRiskCheck.mq5, which you have already read. It deliberately keeps everything in one flat file, no classes, no includes, because its job is to be readable top to bottom. The engine class is the same arithmetic reorganized for reuse.
That split is the whole point. The math lives in one place, the include, and the service stays a shell around it: display and delivery. Want the same numbers in an indicator, an EA filter, a report generator, or whatever? Include the same file, call the same Compute(), and you get the same answer the script gives. Same five steps every time: collect, align, covariance, risk, and attribution.
The risk engine class
Everything the script did, the class now does. Same math, same numbers, just organized so other programs can reuse it. Here is the frame: two size limits, the configuration, the working arrays, and the results.
//+------------------------------------------------------------------+
//| PortfolioRiskMonitor.mqh                                         |
//| CRiskEngine: correlation-aware portfolio risk, account-wide.     |
//| Same math as PortfolioRiskCheck.mq5 (the article script):        |
//| naive risk, true risk (w'Sw), hidden factor, top contributor.    |
//| Reads open positions only. Never trades.                         |
//+------------------------------------------------------------------+
#ifndef PORTFOLIO_RISK_MONITOR_MQH
#define PORTFOLIO_RISK_MONITOR_MQH

#define PRM_MAXS 64   // max distinct symbols
#define PRM_MAXR 512  // max return observations

class CRiskEngine
  {
private:
   //--- configuration
   ENUM_TIMEFRAMES   m_tf;
   int               m_lookback;
   double            m_z;

   //--- book: one row per distinct symbol, signed nominal exposure
   string            m_sym[PRM_MAXS];
   double            m_expo[PRM_MAXS];
   int               m_n;
   int               m_npos;

   //--- series
   double            m_close[PRM_MAXS][PRM_MAXR];
   double            m_ret[PRM_MAXS][PRM_MAXR];
   int               m_nret;
   double            m_cov[PRM_MAXS][PRM_MAXS];

   //--- results
   double            m_naiveRisk;
   double            m_trueRisk;
   double            m_hiddenFactor;
   double            m_equity;
   string            m_topSym;
   double            m_topShare;
Three small private helpers first. MoneyPerPricePerLot converts a symbol's tick value and tick size into money per unit of price move, which is what lets us express every position, FX or index or crypto, in the same account-currency terms. BarsPerDay is the scaling factor that turns per-bar volatility into a daily figure. IdxOf finds a symbol in the book.
   //--- money change per 1.0 of price move, per lot
   double            MoneyPerPricePerLot(const string s)
     {
      double tv=SymbolInfoDouble(s,SYMBOL_TRADE_TICK_VALUE);
      double ts=SymbolInfoDouble(s,SYMBOL_TRADE_TICK_SIZE);
      return (ts>0 ? tv/ts : 0);
     }
   //--- bars of the chosen timeframe in one day (for daily scaling)
   double            BarsPerDay()
     {
      int mins=PeriodSeconds(m_tf)/60;
      if(mins<=0)    return 1;
      if(mins>=1440) return 1;
      return 1440.0/mins;
     }
   //--- index of a symbol in the book, -1 if absent
   int               IdxOf(const string v)
     {
      for(int i=0;i<m_n;i++)
         if(m_sym[i]==v)
            return i;
      return -1;
     }
Step one, collect the book. Same as the script: every open position becomes signed nominal exposure, long positive, short negative, and positions on the same symbol merge into one row. The method returns false if there are fewer than two distinct symbols, because with one position there is no correlation to measure.
   //--- 1. collect open positions as signed nominal exposure
   bool              Collect()
     {
      m_n=0;
      m_npos=0;
      int total=PositionsTotal();
      for(int i=0;i<total;i++)
        {
         ulong tk=PositionGetTicket(i);
         if(!PositionSelectByTicket(tk))
            continue;
         string s=PositionGetString(POSITION_SYMBOL);
         double vol=PositionGetDouble(POSITION_VOLUME);
         double pr =PositionGetDouble(POSITION_PRICE_CURRENT);
         double sg =(PositionGetInteger(POSITION_TYPE)==POSITION_TYPE_BUY ? 1 : -1);
         double nom=sg*vol*MoneyPerPricePerLot(s)*pr;
         int k=IdxOf(s);
         if(k<0)
           {
            if(m_n>=PRM_MAXS)
               continue;
            k=m_n;
            m_sym[k]=s;
            m_expo[k]=0;
            m_n++;
           }
         m_expo[k]+=nom;
         m_npos++;
        }
      return (m_n>=2);
     }
Step two, time-aligned returns. This is the one technical subtlety in the whole engine, so let me spell it out. Different symbols have different bar histories. Crypto trades on weekends, indices have session gaps, and a bar that exists for EURUSD might not exist for US500. If you naively take "the last 200 bars" of each symbol, bar number 37 of one series is not the same clock time as bar number 37 of another, and a covariance computed on misaligned series is quietly wrong. Quietly is the bad part, right? It still prints a number; the number just does not mean what you think it means. So we take one symbol's bar times as the master clock and, for every other symbol, use iBarShift to find the bar that was actually live at each of those timestamps. Every return in row i and every return in row j now describe the same window of real time.
   //--- 2. time-aligned log returns via iBarShift on a master clock
   bool              BuildReturns()
     {
      m_nret=0;
      datetime rt[];
      int got=CopyTime(m_sym[0],m_tf,0,m_lookback+1,rt);
      if(got<30)
         return false;
      ArraySetAsSeries(rt,true);
      int nb=(got>PRM_MAXR ? PRM_MAXR : got);
      for(int s=0;s<m_n;s++)
         for(int t=0;t<nb;t++)
           {
            int sh=iBarShift(m_sym[s],m_tf,rt[t],false);
            m_close[s][t]=iClose(m_sym[s],m_tf,sh);
           }
      m_nret=nb-1;
      for(int s=0;s<m_n;s++)
         for(int t=0;t<m_nret;t++)
           {
            double a=m_close[s][t];
            double b=m_close[s][t+1];
            m_ret[s][t]=(a>0 && b>0 ? MathLog(a/b) : 0);
           }
      return (m_nret>=20);
     }
Step three, the covariance matrix. Textbook sample covariance, every pair of symbols, symmetric by construction. This is the Sigma from the w transpose Sigma w expression earlier, built from your actual recent history.
   //--- 3. covariance matrix
   void              Covariance()
     {
      double mean[PRM_MAXS];
      for(int s=0;s<m_n;s++)
        {
         double sm=0;
         for(int t=0;t<m_nret;t++)
            sm+=m_ret[s][t];
         mean[s]=sm/m_nret;
        }
      for(int i=0;i<m_n;i++)
         for(int j=i;j<m_n;j++)
           {
            double c=0;
            for(int t=0;t<m_nret;t++)
               c+=(m_ret[i][t]-mean[i])*(m_ret[j][t]-mean[j]);
            c/=(m_nret-1);
            m_cov[i][j]=c;
            m_cov[j][i]=c;
           }
     }
Step four, the risk numbers. Naive risk sums only the diagonal, each position alone on its island. True risk is the full double sum, every interaction term included. The ratio between them is the hidden factor. Then one pass over the rows finds the position contributing the most variance, which becomes the concentration warning. One small difference from the script: the engine multiplies both figures by a confidence factor, 1.645 by default, so the output reads as a bad day at roughly 95% confidence rather than a one standard deviation day. It is an input. Set it to 1.0, and you get the script's numbers exactly.
   //--- 4. naive vs true risk, hidden factor, top contributor
   void              Risk()
     {
      m_equity=AccountInfoDouble(ACCOUNT_EQUITY);
      double naive2=0, pv=0;
      for(int i=0;i<m_n;i++)
        {
         naive2 += m_expo[i]*m_expo[i]*m_cov[i][i];
         for(int j=0;j<m_n;j++)
            pv += m_expo[i]*m_expo[j]*m_cov[i][j];
        }
      double bpd=BarsPerDay();
      m_naiveRisk   = MathSqrt(MathMax(naive2,0))*MathSqrt(bpd)*m_z;
      m_trueRisk    = MathSqrt(MathMax(pv,0))    *MathSqrt(bpd)*m_z;
      m_hiddenFactor= (m_naiveRisk>0 ? 100.0*m_trueRisk/m_naiveRisk : 0);

      m_topShare=-1.0e18;
      m_topSym="";
      for(int i=0;i<m_n;i++)
        {
         double contr=0;
         for(int j=0;j<m_n;j++)
            contr += m_expo[i]*m_expo[j]*m_cov[i][j];
         double share=(pv>0 ? contr/pv : 0);
         if(share>m_topShare)
           {
            m_topShare=share;
            m_topSym=m_sym[i];
           }
        }
     }
The public interface ties it together. Configure sets the timeframe, lookback, and confidence factor. Compute runs the four steps in order and returns false if there is nothing to measure, fewer than two positions, or not enough history. The getters expose every result, and RiskPctOfEquity gives the true risk as a percentage of the account, which is the number the service checks against its threshold.
public:
                     CRiskEngine() : m_tf(PERIOD_H1), m_lookback(200), m_z(1.645),
                                     m_n(0), m_npos(0), m_nret(0),
                                     m_naiveRisk(0), m_trueRisk(0), m_hiddenFactor(0),
                                     m_equity(0), m_topSym(""), m_topShare(0)
     {
     }
   //--- set timeframe, lookback and confidence z before Compute()
   void              Configure(const ENUM_TIMEFRAMES tf,const int lookback,const double z)
     {
      m_tf=tf;
      m_lookback=(lookback<30 ? 30 : (lookback>PRM_MAXR-1 ? PRM_MAXR-1 : lookback));
      m_z=(z>0 ? z : 1.645);
     }
   //--- full recompute; false if fewer than 2 positions or no history
   bool              Compute()
     {
      if(!Collect())
         return false;
      if(!BuildReturns())
         return false;
      Covariance();
      Risk();
      return true;
     }
   //--- results
   double            NaiveRisk()       const { return m_naiveRisk; }    // risk with correlations ignored, money
   double            TrueRisk()        const { return m_trueRisk; }     // correlation-adjusted risk, money
   double            HiddenFactor()    const { return m_hiddenFactor; } // true risk as % of naive risk
   double            Equity()          const { return m_equity; }       // account equity at last Compute()
   string            TopSymbol()       const { return m_topSym; }       // symbol carrying the most risk
   double            TopShare()        const { return m_topShare; }     // its share of total risk (0..1)
   int               Symbols()         const { return m_n; }            // distinct symbols in the book
   int               Positions()       const { return m_npos; }         // open positions counted
   double            RiskPctOfEquity() const { return (m_equity>0 ? 100.0*m_trueRisk/m_equity : 0); } // true risk, % of equity
And the last method is the one that makes this engine push-notification ready. Summary() turns the whole result into a single plain sentence. A push notification arrives on a phone, on a lock screen, read in two seconds, so it cannot say "hidden factor 156% of naive." It has to say what that means.
   //--- plain-language one-liner, ready for a push notification
   string            Summary()
     {
      string cur=AccountInfoString(ACCOUNT_CURRENCY);
      int diff=(int)MathRound(MathAbs(m_hiddenFactor-100.0));
      string head;
      if(m_hiddenFactor>=108)
         head=StringFormat("Real risk is %d%% BIGGER than it looks.",diff);
      else if(m_hiddenFactor<=92)
         head=StringFormat("Hedges cut your risk by %d%%.",diff);
      else
         head="Risk is about what it looks.";
      return StringFormat("%s Bad day: %.1f%% of account (%.0f %s). %s is %.0f%% of your risk.",
                          head,RiskPctOfEquity(),m_trueRisk,cur,
                          m_topSym,100.0*m_topShare);
     }
  };

#endif // PORTFOLIO_RISK_MONITOR_MQH
//+------------------------------------------------------------------+
In my book from earlier, that method produces one sentence with the real risk versus the naive one, the money at stake on a bad day, and the position carrying the book. One sentence, and it carries the entire article.
The Service app
Now the service itself. One line at the top, #property service, and the terminal treats the whole file differently. Then the inputs: the engine settings, the panel placement, the three thresholds, and the anti-spam controls.
//+------------------------------------------------------------------+
//| PortfolioRiskMonitorService.mq5                                  |
//| MetaTrader 5 SERVICE. Runs in the background with no chart of    |
//| its own, watches correlation-adjusted portfolio risk across      |
//| the account, draws a small plain-language panel on an open       |
//| chart, and sends a push notification to your phone when a        |
//| risk threshold is crossed. Same engine and same math as          |
//| PortfolioRiskCheck.mq5 (the article script).                     |
//| Reads open positions only. Never trades.                         |
//+------------------------------------------------------------------+
#property service
#property version   "2.00"
#property description "Background risk monitor: live panel on the chart plus push alerts."

#include "PortfolioRiskMonitor.mqh"

//--- engine settings (same defaults as the article script)
input ENUM_TIMEFRAMES CorrTimeframe      = PERIOD_H1; // timeframe for correlations
input int             CorrLookbackBars   = 200;       // history bars
input double          VaRConfidenceZ     = 1.645;     // ~95% one-tailed
//--- monitoring
input int             CheckSeconds       = 15;        // how often to check the account
//--- panel display
input bool            ShowPanel          = true;      // draw the panel on a chart
input string          PanelChartSymbol   = "";        // chart symbol to draw on ("" = first open chart)
input int             PanelX             = 20;        // panel x
input int             PanelY             = 30;        // panel y
input double          UIScale            = 1.0;       // interface scale
//--- alert thresholds
input double          AlertHiddenFactor  = 130;       // alert if real risk >= this % of naive
input double          AlertRiskPctEquity = 3.0;       // alert if daily risk >= this % of account
input double          AlertTopSharePct   = 50;        // alert if one position >= this % of total risk
//--- anti-spam
input int             CooldownMinutes    = 60;        // min minutes between repeat pushes
input bool            StartupPush        = true;      // send a test push on start

#define F_HIDDEN 1
#define F_RISK   2
#define F_CONC   4

//--- palette
#define CBG      C'18,24,21'
#define CBORD    C'34,48,41'
#define CHEAD    C'15,46,42'
#define CINK     C'232,240,234'
#define CMUT     C'140,166,154'
#define CKICK    C'111,131,120'
#define CTRACK   C'28,38,32'
#define CGREEN   C'52,201,138'
#define CAMBER   C'230,184,75'
#define CRED     C'229,86,86'
#define CFILLG   C'28,56,46'
#define CFILLA   C'58,50,26'
#define CFILLR   C'58,32,32'
#define PFX      "PRMS_"
#define UIF      "Segoe UI"
#define MONO     "Consolas"
A service has no chart of its own, but it can draw on any open chart because every object function in MQL5 takes a chart ID as its first argument. Indicators pass 0, meaning "my own chart." A service passes the ID of a chart it chose. That single detail is what lets a background program keep a live panel in front of you. Two scaling helpers first, so the panel stays sharp on high-DPI screens, plus a thousand separators for the money figure.
//--- DPI scaling
double gScl=1.0, gFscl=1.0;
//+------------------------------------------------------------------+
//| Scale a distance by the DPI factor                               |
//+------------------------------------------------------------------+
int S(double v)  { return (int)MathRound(v*gScl); }
//+------------------------------------------------------------------+
//| Scale a font size by the UI scale factor                         |
//+------------------------------------------------------------------+
int FS(int p)    { int f=(int)MathRound(p*gFscl); return (f<6 ? 6 : f); }
//+------------------------------------------------------------------+
//| Account currency                                                 |
//+------------------------------------------------------------------+
string Cur() { return AccountInfoString(ACCOUNT_CURRENCY); }
//+------------------------------------------------------------------+
//| Format a value with thousand separators                          |
//+------------------------------------------------------------------+
string Grp(double v)
  {
   int neg=(v<0);
   v=MathAbs(v);
   long n=(long)MathRound(v);
   string s=IntegerToString(n), o="";
   int c=0;
   for(int i=StringLen(s)-1;i>=0;i--)
     {
      o=StringSubstr(s,i,1)+o;
      if(++c%3==0 && i>0)
         o=","+o;
     }
   return (neg ? "-" : "")+o;
  }
The drawing primitives. Two object types cover everything: rectangle labels for the background, the header band, the colored hero band, and the dividers, and text labels for every line of words. Each helper creates the object if it does not exist yet and updates it if it does, so calling them every cycle is cheap and idempotent.
//+------------------------------------------------------------------+
//| Create a rectangle label object on the given chart               |
//+------------------------------------------------------------------+
void RC(long id,string n)
  {
   string nm=PFX+n;
   if(ObjectFind(id,nm)<0)
      ObjectCreate(id,nm,OBJ_RECTANGLE_LABEL,0,0,0);
   ObjectSetInteger(id,nm,OBJPROP_CORNER,CORNER_LEFT_UPPER);
   ObjectSetInteger(id,nm,OBJPROP_BORDER_TYPE,BORDER_FLAT);
   ObjectSetInteger(id,nm,OBJPROP_BACK,false);
   ObjectSetInteger(id,nm,OBJPROP_SELECTABLE,false);
   ObjectSetInteger(id,nm,OBJPROP_HIDDEN,true);
  }
//+------------------------------------------------------------------+
//| Position, size and color a rectangle label                       |
//+------------------------------------------------------------------+
void setRect(long id,string n,int x,int y,int w,int h,color bg,color bd=clrNONE)
  {
   RC(id,n);
   string nm=PFX+n;
   ObjectSetInteger(id,nm,OBJPROP_XDISTANCE,x);
   ObjectSetInteger(id,nm,OBJPROP_YDISTANCE,y);
   ObjectSetInteger(id,nm,OBJPROP_XSIZE,MathMax(1,w));
   ObjectSetInteger(id,nm,OBJPROP_YSIZE,MathMax(1,h));
   ObjectSetInteger(id,nm,OBJPROP_BGCOLOR,bg);
   ObjectSetInteger(id,nm,OBJPROP_COLOR,(bd==clrNONE ? bg : bd));
   ObjectSetInteger(id,nm,OBJPROP_TIMEFRAMES,OBJ_ALL_PERIODS);
  }
//+------------------------------------------------------------------+
//| Hide a rectangle label                                           |
//+------------------------------------------------------------------+
void hideRect(long id,string n)
  {
   string nm=PFX+n;
   if(ObjectFind(id,nm)>=0)
      ObjectSetInteger(id,nm,OBJPROP_TIMEFRAMES,OBJ_NO_PERIODS);
  }
//+------------------------------------------------------------------+
//| Create or update a text label on the given chart                 |
//+------------------------------------------------------------------+
void L(long id,string n,int x,int y,string text,color clr,int size,string font=UIF,ENUM_ANCHOR_POINT a=ANCHOR_LEFT_UPPER)
  {
   string nm=PFX+n;
   if(ObjectFind(id,nm)<0)
      ObjectCreate(id,nm,OBJ_LABEL,0,0,0);
   ObjectSetInteger(id,nm,OBJPROP_CORNER,CORNER_LEFT_UPPER);
   ObjectSetInteger(id,nm,OBJPROP_ANCHOR,a);
   ObjectSetInteger(id,nm,OBJPROP_XDISTANCE,x);
   ObjectSetInteger(id,nm,OBJPROP_YDISTANCE,y);
   ObjectSetString(id,nm,OBJPROP_TEXT,text);
   ObjectSetInteger(id,nm,OBJPROP_COLOR,clr);
   ObjectSetInteger(id,nm,OBJPROP_FONTSIZE,size);
   ObjectSetString(id,nm,OBJPROP_FONT,font);
   ObjectSetInteger(id,nm,OBJPROP_SELECTABLE,false);
   ObjectSetInteger(id,nm,OBJPROP_HIDDEN,true);
   ObjectSetInteger(id,nm,OBJPROP_TIMEFRAMES,OBJ_ALL_PERIODS);
  }
//+------------------------------------------------------------------+
//| Hide a text label                                                |
//+------------------------------------------------------------------+
void hideL(long id,string n)
  {
   string nm=PFX+n;
   if(ObjectFind(id,nm)>=0)
      ObjectSetInteger(id,nm,OBJPROP_TIMEFRAMES,OBJ_NO_PERIODS);
  }
The wording. The panel does not lead with "hidden factor 156%" because most people reading a chart at speed do not think in ratios. It leads with what the ratio means and prints the technical number small underneath for anyone who wants it. Three states: risk bigger than it looks, about what it looks like, or smaller because hedges are working. The color follows the same logic. And FindChart picks where the panel lives: the chart of the symbol you name in the inputs, or simply the first open chart if you name none.
//+------------------------------------------------------------------+
//| Color for the hidden factor state                                |
//+------------------------------------------------------------------+
color HiddenColor(double h)
  {
   if(h>=125) return CRED;
   if(h>=108) return CAMBER;
   if(h<=92)  return CGREEN;
   return CINK;
  }
//+------------------------------------------------------------------+
//| Plain-language headline for the hidden factor                    |
//+------------------------------------------------------------------+
string HiddenHeadline(double h)
  {
   int diff=(int)MathRound(MathAbs(h-100.0));
   if(h>=108) return StringFormat("Real risk is %d%% BIGGER than it looks",diff);
   if(h<=92)  return StringFormat("Hedges cut your risk by %d%%",diff);
   return "Your risk is about what it looks";
  }
//+------------------------------------------------------------------+
//| Secondary line under the headline                                |
//+------------------------------------------------------------------+
string HiddenExplain(double h)
  {
   if(h>=108) return "Your trades stack on the same bet";
   if(h<=92)  return "Some trades cancel each other out";
   return "Your trades are fairly independent";
  }

//+------------------------------------------------------------------+
//| Find the chart to draw on                                        |
//+------------------------------------------------------------------+
long FindChart()
  {
   long id=ChartFirst();
   long first=id;
   while(id>=0)
     {
      if(PanelChartSymbol=="" || ChartSymbol(id)==PanelChartSymbol)
         return id;
      id=ChartNext(id);
     }
   return first;
  }
DrawPanel assembles the whole thing: the header, the colored hero band with the headline, the technical subline, and then the two questions a trader actually asks: what could I lose today and where is my risk concentrated? If there are fewer than two positions, it says so instead of showing stale numbers.
//+------------------------------------------------------------------+
//| Draw the panel on the given chart                                |
//+------------------------------------------------------------------+
void DrawPanel(long id,CRiskEngine &eng,bool hasData)
  {
   int PX=PanelX, PY=PanelY;
   int pad=S(14), colW=S(280);
   int Wpx=pad+colW+pad;
   int hdH=S(30);

   setRect(id,"bg",PX,PY,Wpx,hdH+S(40),CBG,CBORD);
   setRect(id,"hd",PX,PY,Wpx,hdH,CHEAD);
   L(id,"title",PX+pad,PY+S(7),"PORTFOLIO RISK MONITOR",CINK,FS(11),UIF);

   if(!hasData)
     {
      hideRect(id,"hero_tk"); hideRect(id,"hero_fl"); hideRect(id,"d1"); hideRect(id,"d2");
      hideL(id,"head"); hideL(id,"headsub"); hideL(id,"hf_tech");
      hideL(id,"vr_k"); hideL(id,"vr_v"); hideL(id,"vr_sub");
      hideL(id,"tp_k"); hideL(id,"tp_v"); hideL(id,"tp_sub");
      L(id,"empty",PX+pad,PY+hdH+S(12),"Open at least 2 trades and this",CINK,FS(9),UIF);
      L(id,"empty2",PX+pad,PY+hdH+S(30),"panel shows your real risk.",CMUT,FS(9),UIF);
      setRect(id,"bg",PX,PY,Wpx,hdH+S(52),CBG,CBORD);
      ChartRedraw(id);
      return;
     }
   hideL(id,"empty");
   hideL(id,"empty2");

   double hidden=eng.HiddenFactor();
   double trueRisk=eng.TrueRisk();
   double equity=eng.Equity();
   string topSym=eng.TopSymbol();
   double topShare=eng.TopShare();

   int y=PY+hdH+S(14);
   int xL=PX+pad;
   color hc=HiddenColor(hidden);

//--- HERO: plain headline in a colored band
   int heroH=S(46);
   setRect(id,"hero_tk",xL,y,colW,heroH,CTRACK);
   double fillr=hidden/150.0;
   if(fillr<0.05) fillr=0.05;
   if(fillr>1)    fillr=1;
   color hf=(hidden>=125 ? CFILLR : (hidden>=108 ? CFILLA : (hidden<=92 ? CFILLG : CTRACK)));
   setRect(id,"hero_fl",xL,y,(int)MathMax(S(3),colW*fillr),heroH,hf);
   L(id,"head",xL+S(12),y+S(15),HiddenHeadline(hidden),CINK,FS(11),UIF,ANCHOR_LEFT);
   L(id,"headsub",xL+S(12),y+S(32),HiddenExplain(hidden),hc,FS(9),UIF,ANCHOR_LEFT);
   y+=heroH+S(4);
//--- tiny technical line for the quants
   L(id,"hf_tech",xL,y,StringFormat("hidden factor  %.0f%% of naive risk",hidden),CKICK,FS(7),MONO);
   y+=S(20);

   setRect(id,"d1",xL,y,colW,S(1),CBORD);
   y+=S(14);

//--- WORST DAY
   L(id,"vr_k",xL,y,"On a bad day you could lose",CMUT,FS(9),UIF);
   y+=S(18);
   L(id,"vr_v",xL,y,StringFormat("%.1f%% of the account",(equity>0 ? 100.0*trueRisk/equity : 0)),CINK,FS(13),UIF);
   L(id,"vr_sub",xL+colW,y+S(4),StringFormat("%s %s",Grp(trueRisk),Cur()),CMUT,FS(9),UIF,ANCHOR_RIGHT_UPPER);
   y+=S(28);

   setRect(id,"d2",xL,y,colW,S(1),CBORD);
   y+=S(14);

//--- CONCENTRATION
   L(id,"tp_k",xL,y,"Most of your risk is one trade",CMUT,FS(9),UIF);
   y+=S(18);
   int share=(int)MathRound(100.0*topShare);
   L(id,"tp_v",xL,y,StringFormat("%s  is  %d%% of your risk",topSym,share),CINK,FS(12),UIF);
   y+=S(20);
   string csub=(share>=50 ? "That is more than half in one position" :
               (share>=35 ? "That is a big chunk in one position" :
                            "Reasonably spread across trades"));
   L(id,"tp_sub",xL,y,csub,(share>=50 ? CAMBER : CMUT),FS(8),UIF);
   y+=S(24);

   int H=(y-PY);
   setRect(id,"bg",PX,PY,Wpx,H,CBG,CBORD);
   setRect(id,"hd",PX,PY,Wpx,hdH,CHEAD);
   ChartRedraw(id);
  }
The alert message builder. The three flags define letting the service remember which thresholds are breached as one small integer, which is what makes "alert only when the situation changes" a one-line comparison later. The message itself: reasons first, in words, then the engine's summary with the numbers.
//+------------------------------------------------------------------+
//| Compose the push message: reasons first, then the numbers        |
//+------------------------------------------------------------------+
string BuildAlert(const int state,CRiskEngine &eng)
  {
   string why="";
   if((state&F_HIDDEN)!=0)
      why+="stacked bets";
   if((state&F_RISK)!=0)
      why+=(why=="" ? "" : ", ")+"big day at risk";
   if((state&F_CONC)!=0)
      why+=(why=="" ? "" : ", ")+"one-trade concentration";
   return "RISK ALERT ("+why+"): "+eng.Summary();
  }
And OnStart, the whole program. First the startup check: if push notifications are disabled in the terminal, every alert this service ever sends will vanish into nothing, so it says so immediately in the journal. If they are enabled, it sends one test push, so you get confirmation on your phone that the pipeline works before you ever need it to.
Then it enters a loop: check the connection, recompute, redraw the panel, map the result to a state flag, and notify only on state changes or after the cooldown. Notice the panel handling: charts can be closed under a running service, so every cycle it verifies the chart still exists and finds a new one if not. And when the service is stopped, it cleans its objects off the chart on the way out.
//+------------------------------------------------------------------+
//| Service entry point: infinite monitoring loop                    |
//+------------------------------------------------------------------+
void OnStart()
  {
//--- DPI scaling for the panel
   double dpi=(double)TerminalInfoInteger(TERMINAL_SCREEN_DPI);
   if(dpi<=0) dpi=96;
   gScl=(dpi/96.0)*(UIScale>0 ? UIScale : 1.0);
   gFscl=(UIScale>0 ? UIScale : 1.0);

//--- make sure pushes can actually reach the phone
   if(!TerminalInfoInteger(TERMINAL_NOTIFICATIONS_ENABLED))
      Print("Push notifications are DISABLED. Enable them in Tools -> Options -> ",
            "Notifications and enter your MetaQuotes ID, or no alert will arrive.");
   else if(StartupPush)
     {
      if(SendNotification("Portfolio risk monitor started. You will get an alert when risk thresholds are crossed."))
         Print("Startup push sent. Check your phone.");
      else
         Print("Startup push FAILED, error ",GetLastError(),
               ". Check your MetaQuotes ID in Tools -> Options -> Notifications.");
     }

   CRiskEngine engine;
   engine.Configure(CorrTimeframe,CorrLookbackBars,VaRConfidenceZ);

   int      lastState=0;   // which thresholds were breached on the previous pass
   datetime lastAlert=0;   // when the last push went out
   long     chart=-1;      // chart the panel lives on
   int      sleepSec=(CheckSeconds<5 ? 5 : CheckSeconds);

   Print("Portfolio risk monitor running. Checking every ",sleepSec," seconds.");

   while(!IsStopped())
     {
      bool ok=(TerminalInfoInteger(TERMINAL_CONNECTED) && engine.Compute());

      //--- keep the panel on a live chart (charts can be closed under us)
      if(ShowPanel)
        {
         if(chart<0 || ChartPeriod(chart)==0)
            chart=FindChart();
         if(chart>=0)
            DrawPanel(chart,engine,ok);
        }

      if(ok)
        {
         int state=0;
         if(engine.HiddenFactor()>=AlertHiddenFactor)
            state|=F_HIDDEN;
         if(engine.RiskPctOfEquity()>=AlertRiskPctEquity)
            state|=F_RISK;
         if(100.0*engine.TopShare()>=AlertTopSharePct)
            state|=F_CONC;

         bool changed=(state!=lastState);
         bool cooled =((long)TimeCurrent()-(long)lastAlert >= (long)CooldownMinutes*60);

         //--- push only on a NEW breach state, or after the cooldown
         //--- if the breach persists (respects notification frequency limits)
         if(state!=0 && (changed || cooled))
           {
            string msg=BuildAlert(state,engine);
            if(SendNotification(msg))
               lastAlert=TimeCurrent();
            else
               Print("Push failed, error ",GetLastError());
            Print(msg);
           }
         if(state==0 && lastState!=0)
            Print("Back under thresholds. ",engine.Summary());
         lastState=state;
        }
      else
         lastState=0; // fewer than 2 positions or no data: a new breach later must alert again

      Sleep(1000*sleepSec);
     }

//--- clean the panel off the chart when the service stops
   if(chart>=0 && ChartPeriod(chart)>0)
     {
      ObjectsDeleteAll(chart,PFX);
      ChartRedraw(chart);
     }
   Print("Portfolio risk monitor stopped.");
  }
//+------------------------------------------------------------------+
Installing it takes a couple of minutes, once. Place PortfolioRiskMonitorService.mq5 and PortfolioRiskMonitor.mqh together in MQL5\Services\PortfolioRiskMonitor\, or simply unpack the attached MQL5.zip into the terminal data folder, which creates the right folders for you. Open the service in MetaEditor and compile; you want zero errors. Back in the terminal, find the Services section at the bottom of the Navigator, right-click it, choose Add Service, pick Portfolio Risk Monitor, adjust the thresholds if it works for you, and press OK. It starts immediately; the panel appears on your first open chart within seconds, and the service will start together with the terminal from then on.
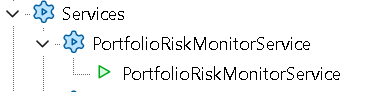
Navigator
For the pushes to reach your phone, the terminal needs your MetaQuotes ID. Open the MetaTrader mobile app, find your ID under Settings, then in the desktop terminal go to Tools, Options, Notifications, tick Enable push notifications, and enter the ID. If StartupPush is on, the service sends a test message the moment it starts, so you know within seconds whether the pipeline works.
Conclusion
Correlation was never the secret. Every trader with a month of screen time knows their positions are related. The secret, if there is one, is that the relationship has a size, the size has a formula, and the formula says things your intuition cannot. Two trades at 1% each are somewhere between 0.45% and 2% of real risk, and the only way to know where on that range you live is to compute it. On my own five-position book, the formula exposed a dollar and risk-on bet I had stacked across three tickers without ever deciding to, 56% more risk than the naive number, in ten lines of output. And now I do not even have to remember to look, because the service watches the account from the moment the terminal starts, keeps the answer live on my chart, and my phone tells me when the book stops being what I think it is. So, the next time you look at your Trade tab and feel diversified, ask yourself the question this article started with. You know your trades are correlated. By how much?
Now you can answer it. And if you'd rather not keep asking, the monitor will answer it for you, all day, on its own.
A note on where this comes from:
The idea that portfolio risk depends on how assets move together, not just on each asset alone, is the foundation of modern portfolio theory, and it is more than seventy years old. If you want to go to the source, here is the trail. Harry Markowitz laid the groundwork in 1952. His paper "Portfolio Selection" is the one that showed, mathematically, that diversification only reduces risk when the assets you hold are not perfectly correlated and that the variance of a portfolio is built from the covariances between its holdings, exactly the interaction term we spent this article on. It won him a Nobel Prize decades later, and every risk model since is a descendant of it. [1]
William Sharpe extended it in 1964 with the work that became the Capital Asset Pricing Model. Sharpe is where the clean split between systematic risk, the shared market driver you cannot diversify away, and unsystematic risk, the instrument-specific part you can, comes from. That is the two kinds of risk section of this article, and it is his. [2]
The rest is standard statistics. The Pearson correlation coefficient and covariance are textbook definitions, and I have used them here exactly as they appear in any portfolio theory course. [3] The real-world correlation figures I quoted, such as the strong positive relationship between EUR/USD and GBP/USD, are widely documented, and, better still, you can verify them yourself on your own history with the script above, which is rather the point.
The framing throughout follows the advanced portfolio theory I studied at Nicolaus Copernicus University. If you read one thing beyond this article, read Markowitz. It is short, it is readable, and it is the whole idea in its original form.
References
[1] Markowitz, H. (1952). Portfolio Selection. The Journal of Finance, 7(1), 77 to 91. https://doi.org/10.1111/j.1540-6261.1952.tb01525.x
[2] Sharpe, W. F. (1964). Capital Asset Prices: A Theory of Market Equilibrium under Conditions of Risk. The Journal of Finance, 19(3), 425 to 442. https://doi.org/10.1111/j.1540-6261.1964.tb02865.x[3] Pearson, K. (1895). Notes on Regression and Inheritance in the Case of Two Parents. Proceedings of the Royal Society of London, 58, 240 to 242.
[4] Markowitz, H. (1959). Portfolio Selection: Efficient Diversification of Investments. John Wiley and Sons, New York.
| # | Name | Type | Description |
|---|---|---|---|
| 1 | PortfolioRiskCheck.mq5 | Script | Prints naive risk, correlation-adjusted risk, the hidden factor and per-symbol risk contribution for all open positions |
| 2 | PortfolioRiskMonitor.mqh | Class Library | CRiskEngine class: time-aligned returns, covariance matrix, naive and true risk, hidden factor, top contributor, plain-language summary |
| 3 | PortfolioRiskMonitorService.mq5 | Service | Background monitoring loop, chart panel rendering and push notifications |
| 4 | MQL5.zip | Archive | An archive of the files above for unpacking into the MQL5 directory of the client terminal; the files land in MQL5\Scripts\PortfolioRiskCheck and MQL5\Services\PortfolioRiskMonitor |
MQL5.zip is an archive with all the files above. Unpack it into the terminal data folder (File, Open Data Folder), and all files will be located in the required places.
Warning: All rights to these materials are reserved by MetaQuotes Ltd. Copying or reprinting of these materials in whole or in part is prohibited.
This article was written by a user of the site and reflects their personal views. MetaQuotes Ltd is not responsible for the accuracy of the information presented, nor for any consequences resulting from the use of the solutions, strategies or recommendations described.

 Dingo Optimization Algorithm Modification (DOAm)
 Price Action Analysis Toolkit Development (Part 75): Building a Modular Multi-Symbol Trading Panel in MQL5
 Defining your Edge (Part 1): Using a Discrete Fourier Transform and a Spiking Neural Network in a Trading Robot
 Digital Signal Processing for Traders (Part 2): The Dominant Cycle, MAMA, and a Regime-Switching Expert Advisor

- Free trading apps
- Over 8,000 signals for copying
- Economic news for exploring financial markets
You agree to website policy and terms of use
A great article and a very useful one. The author put so much effort and thought into this 🙏.
I would also like to suggest something that you can expand on: a portfolio manager that evaluates each asset added to the portfolio and decide if they are correlated, then the manager can also look at all the backtested result from those assets and evaluate if their past trades were correlated or not. I have seen a few that does this but they just don't manage to evaluate mean-reversion strategies well (or should I say its not targeted for that kind of strategy), because mean-reversion strategies have those occasion "fat-tails" that are usually held for few days to maybe months, or even during good days, those small consistent wins usually make the portfolio evaluator "look good" when that might not be the case.
The manager should be able to know each asset's maximum adverse excursion, if they ever happened around the same time, and how their combined risk affects the account etc...