
Beyond the Clock (Part 3): Building an Indicator Window for Alternative Bars in MQL5

Table of Contents
- Introduction
- Design: What the Viewer Must Do
- Architecture
- Data Sources and Render Modes
- The Bar Engine: Reusing CBarConstructor
- CSV File Reading
- The GUI Panel: CViewerPanel
- The Indicator Core: AlternativeBarsViewer
- Degenerate Bars
- Panel Layout and Object Naming
- Attaching the Viewer
- Conclusion
- Attached Files
Introduction
The two previous articles in this series built all ten alternative bar types defined in Chapter 1 of López de Prado's Advances in Financial Machine Learning: standard bars (time, tick, volume, dollar) in Part 1, and runs bars in Part 2. Both articles ended at the same point: bars written to a CSV file and no way to inspect them inside the terminal.
The natural response is to open the CSV in Python and plot it. This works for small histories. At the scale that alternative bars accumulate during live operation — several thousand dollar bars on an active session, tens of thousands of tick bars over a week — both matplotlib and Plotly hit rendering limits. The browser or the figure canvas degrades before the data is fully drawn. Switching platforms during a parameter sweep is slow enough to break the feedback loop. By the time the chart renders, the EA has already produced another batch of bars.
A harder problem is that static plots can miss critical issues entirely. A miscalibrated imbalance threshold can close bars on three ticks during low-volatility periods. Three ticks produce a bar whose open, high, low, and close are nearly identical — a flat candle with no directional information. In a Python chart of a thousand bars, that bar is a small feature somewhere in the middle. In a MetaTrader subwindow, it appears as a gold candle as soon as it closes. This makes the calibration failure visible before it contaminates the downstream feature pipeline. The real value of in-terminal visualization is not convenience; it is that the parameter space becomes legible during live calibration in a way offline analysis cannot match.
This article implements AlternativeBarsViewer, a custom indicator that renders the ten alternative bar types as color-coded candlesticks in a separate subwindow. The implementation reuses the exact CBarConstructor hierarchy that BarBuilderEA uses, so the candles shown in the subwindow are guaranteed to match the EA's and Python's output. It supports three data sources: real ticks (CopyTicksRange), synthetic ticks from chart OHLC, and the EA's exported CSV. It also provides two display layouts that are toggleable at runtime via a button or hotkey.
Design: What the Viewer Must Do
The constraints that shape the design follow directly from the existing codebase. BarBuilderEA writes one CSV file per bar type to MQL5\Files\. The filename encodes the bar type and threshold — for example, EURUSD_dollar_bar_size10000000.csv for a ten-million-dollar threshold. The viewer must be able to read that file without requiring the user to specify a path, and it must re-read it when the file grows so that bars added by a running EA appear without manual intervention.
Beyond CSV replay, the viewer must also be able to construct bars itself from the live tick stream or from the chart's OHLC candles. This serves a different use case: the CSV source is ideal for auditing a completed run or comparing MQL5 output against Python, but the tick and OHLC sources allow bars to be inspected as they form — including the live, still-accumulating bar — without the EA running at all.
Alternative bars do not conform to the host chart's time axis. A dollar bar can close mid-minute, and several tick bars can close within the same minute. The indicator maps each alternative bar to the host chart's slot index and fills five buffers: open, high, low, close, and color. The DRAW_COLOR_CANDLES plot style handles the rendering; MQL5 skips any bar index where all four price buffers hold EMPTY_VALUE, so chart bars with no corresponding alternative bar remain blank.
Three color states are needed. Bullish bars (close ≥ open) render in green. Bearish bars render in tomato. The currently-forming bar (live in-progress bar visible only in the tick and OHLC sources) renders in gold, signaling that it has not yet closed. A toggle button in the indicator subwindow's top-left corner switches between the two layout modes described in the next section.
Architecture

Figure 1. A three-layer illustration of the AlternativeBarsViewer data pipeline
- Top row: BarBuilderEA writes a completed SBar record to the CSV on every bar close. The filename is deterministic from the symbol, bar type, and threshold. The EA also persists its EWM state to a binary file so that imbalance and run bar calibration survives terminal restarts.
- Middle row: AlternativeBarsViewer owns a CBarConstructor instance of the same type as the EA. Depending on InpTickSource, ticks arrive from CopyTicksRange, from the chart's OHLC candles synthesized into four ticks each, or by re-reading the EA's CSV. CSV parsing is performed inline inside UpdateFromCsv() – no separate reader class is required.
- Bottom row: RenderBars() maps the stored bar array into five indicator buffers. CViewerPanel maintains a small overlay panel in the subwindow's top-left corner, directly below the mode toggle button. A toggle button in the indicator subwindow's top-left corner switches the render mode live.
Data Sources and Render Modes
Three data sources
The InpTickSource input selects one of three data paths:
- SRC_TICKS — calls CopyTicksRange with a lookback window of InpLookbackDays days. This is the most accurate source: every real tick is fed through the same ProcessTick() loop the EA uses, producing bit-for-bit identical bars. It also shows the live forming bar. On the first call it loads the full history; subsequent calls in OnCalculate consume only new ticks via a millisecond-level deduplication bookmark.
- SRC_OHLC — synthesizes ticks from the chart's OHLC candles. Each closed candle is expanded into four ticks in the order open → low → high → close for a bearish candle, or open → high → low → close for a bullish candle. This is a rough approximation — the tick rule will assign direction based on price changes between these synthetic events — but it is instantaneous to load, requires no tick history, and is useful for quick threshold exploration on slow machines or in Strategy Tester.
- SRC_CSV — reads the CSV that BarBuilderEA has exported. The file is re-read when its size changes, so new bars from a running EA appear automatically. This source shows only closed bars (the CSV holds no forming-bar state), but it has the advantage that bars are already computed and the viewer is a pure reader — it does not need to replay ticks at all.
Two render modes
The ENUM_RENDER_MODE enum controls how the closed bar array is projected onto the chart's index axis:
- RENDER_TIME — each bar is placed in the chart-grid slot that contains its close timestamp, found via a binary search over the cached g_chart_time[] array. When two alternative bars fall within the same chart slot, the later one overwrites the earlier, which is the correct behavior: it reflects the state of price at the slot's right boundary. Sparse bar types leave visible gaps; dense types (e.g. tick bars on a daily chart) produce many overwrites.
- RENDER_INDEX — bars are packed sequentially into the rightmost chart slots, newest on the right, oldest toward the left. There are no gaps and no collisions. The time axis labels become positional references rather than actual close times. This mode is preferable for parameter calibration work where bar shape and spacing matter more than calendar alignment.

Figure 2a. INDEX mode (sequential, collision‑free)

Figure 2b. TIME mode (calendar‑aligned, gaps visible)
The mode is toggled at runtime by clicking the View: Time / View: Index button in the indicator subwindow's top-left corner, or by pressing the T key while the chart has keyboard focus. No reattachment is needed; RenderBars() re-fills the buffers immediately and calls ChartRedraw().
//+------------------------------------------------------------------+
//| Render the bar store into the plot buffers per the active mode   |
//+------------------------------------------------------------------+
void RenderBars(void)
  {
   if(g_rates_total <= 0)
      return;

   ArrayInitialize(g_open,  EMPTY_VALUE);
   ArrayInitialize(g_high,  EMPTY_VALUE);
   ArrayInitialize(g_low,   EMPTY_VALUE);
   ArrayInitialize(g_close, EMPTY_VALUE);
   ArrayInitialize(g_color, 0.0);

   int total = ArraySize(g_bars);

   if(g_render_mode == RENDER_TIME)
     {
      for(int i = 0; i < total; i++)
        {
         int s = SlotForTime(g_bars[i].time);
         PutCandle(s, g_bars[i],
                   g_bars[i].close >= g_bars[i].open ? COL_BULL : COL_BEAR);
        }
      if(g_has_forming)
         PutCandle(g_rates_total - 1, g_forming, COL_FORMING);
     }
   else // RENDER_INDEX — pack newest into the rightmost slots
     {
      int reserve = g_has_forming ? 1 : 0;
      int slots   = g_rates_total - reserve;
      int ndraw   = (total < slots) ? total : slots;
      int first   = total - ndraw;
      int right   = g_rates_total - 1 - reserve;

      for(int j = 0; j < ndraw; j++)
        {
         int s = right - (ndraw - 1 - j);
         int b = first + j;
         PutCandle(s, g_bars[b],
                   g_bars[b].close >= g_bars[b].open ? COL_BULL : COL_BEAR);
        }
      if(g_has_forming)
         PutCandle(g_rates_total - 1, g_forming, COL_FORMING);
     }
  }
The forming-bar slot always occupies g_rates_total - 1 (the rightmost chart position) in both modes. In RENDER_INDEX mode, the closed-bar packing leaves this slot free when a forming bar exists; in RENDER_TIME mode the forming bar overwrites whatever is in the current chart slot, which is the correct live-chart behavior.
The Bar Engine: Reusing CBarConstructor
The viewer instantiates the bar constructor through the same factory function used in BarBuilderEA. The input parameters — InpBarType, InpBarSize, InpExpTicksInit, InpEwmSpan, and so on — mirror the EA's inputs exactly. This is a deliberate design constraint: if the viewer accepted different parameters, there would be no guarantee that its candles matched the EA's CSV output.
//+------------------------------------------------------------------+
//| Factory — identical mapping to the EA                            |
//+------------------------------------------------------------------+
CBarConstructor *CreateBarConstructor(void)
  {
   switch(InpBarType)
     {
      case BAR_TIME:   return new CTimeBar((int)InpBarSize);
      case BAR_TICK:   return new CTickBar((int)InpBarSize);
      case BAR_VOLUME: return new CVolumeBar(InpBarSize);
      case BAR_DOLLAR: return new CDollarBar(InpBarSize);

      case BAR_TICK_IMB:
         return new CImbalanceBar(IMB_METRIC_TICK,
                                  InpExpTicksInit, InpExpImbInit, InpEwmSpan);
      case BAR_VOLUME_IMB:
         return new CImbalanceBar(IMB_METRIC_VOLUME,
                                  InpExpTicksInit, InpExpImbInit, InpEwmSpan);
      case BAR_DOLLAR_IMB:
         return new CImbalanceBar(IMB_METRIC_DOLLAR,
                                  InpExpTicksInit, InpExpImbInit, InpEwmSpan);

      case BAR_TICK_RUNS:
         return new CRunsBar(IMB_METRIC_TICK,
                             InpExpTicksInit, InpExpRunBuyInit,
                             InpExpRunSellInit, InpEwmSpan);
      case BAR_VOLUME_RUNS:
         return new CRunsBar(IMB_METRIC_VOLUME,
                             InpExpTicksInit, InpExpRunBuyInit,
                             InpExpRunSellInit, InpEwmSpan);
      case BAR_DOLLAR_RUNS:
         return new CRunsBar(IMB_METRIC_DOLLAR,
                             InpExpTicksInit, InpExpRunBuyInit,
                             InpExpRunSellInit, InpEwmSpan);
     }
   return NULL;
  }
All ten bar types are covered. The viewer also exposes the live forming-bar state via the accessors added to CBarConstructor in Part 2 — Open(), High(), Low(), Close(), and LastTickTime() — which are called by UpdateForming() to populate the gold forming candle.
CSV File Reading
The viewer reads the EA's CSV directly inside UpdateFromCsv(). No separate reader class is required. The file is opened with FileOpen (optionally in the Common folder), the header row is skipped, and then each data row is parsed into an SBar structure. The file is re-read only when its size changes, so a running EA can extend the file without needing to reload the indicator.
//+------------------------------------------------------------------+
//| CSV source — (re)read the EA's export when the file size changes |
//+------------------------------------------------------------------+
void UpdateFromCsv(const bool full)
  {
   string name  = BuildCsvName();
   int    flags = FILE_READ | FILE_CSV | FILE_ANSI | FILE_SHARE_READ | FILE_SHARE_WRITE;
   if(InpCsvCommon) flags |= FILE_COMMON;

   int fh = FileOpen(name, flags, ',');
   if(fh == INVALID_HANDLE) { ... }

   long size = (long)FileSize(fh);
   if(!full && size == g_csv_size) { FileClose(fh); return; }

   ArrayResize(g_bars, 0);
   g_has_forming = false;

   while(!FileIsEnding(fh))
     {
      string s0 = FileReadString(fh);   // time
      if(FileIsEnding(fh) && StringLen(s0) == 0) break;
      string s1 = FileReadString(fh);   // open
      // ... read remaining columns
      if(s0 == "time") continue;    // skip header

      SBar b;
      b.time = StringToTime(s0);
      b.open = StringToDouble(s1);
      // ... assign other fields
      if(b.time > 0) AppendBar(b);
     }

   g_csv_size = size;
   FileClose(fh);
   // Update panel's file label if needed
   if(g_panel_created)
     {
      string disp_file = name;
      if(StringLen(disp_file) > 22)
         disp_file = "..." + StringSubstr(disp_file, StringLen(disp_file) - 21);
      string full_obj_name = g_panel.GetObjName("_val_file");
      ObjectSetString(ChartID(), full_obj_name, OBJPROP_TEXT, disp_file);
     }
  }
Row validation guards against partial writes. The bar type string is read from the last column but not stored; it is only used to verify consistency.
The GUI Panel: CViewerPanel
The panel uses seven MQL5 graphical object types and no external libraries. A single OBJ_RECTANGLE_LABEL serves as the background. Pairs of OBJ_LABEL objects display five stat rows: bar type, source file, total bar count, degenerate bar count, and the timestamp of the most recent bar. One OBJ_BUTTON triggers an immediate CSV reload. All objects use CORNER_LEFT_UPPER as their anchor corner so the panel stays positioned relative to the top-left of the subwindow, directly below the toggle button.
//+------------------------------------------------------------------+
//| Create — build all panel objects                                 |
//+------------------------------------------------------------------+
bool CViewerPanel::Create(const long   chart_id,
                          const int    subwin,
                          const string filename)
  {
   m_chart  = chart_id;
   m_subwin = subwin;

   string bg = ObjName("_bg");
   if(!ObjectCreate(m_chart, bg, OBJ_RECTANGLE_LABEL, m_subwin, 0, 0))
     {
      PrintFormat("CViewerPanel::Create: ObjectCreate failed for %s, err=%d",
                  bg, GetLastError());
      return(false);
     }
   ObjectSetInteger(m_chart, bg, OBJPROP_CORNER,       CORNER_LEFT_UPPER);
   ObjectSetInteger(m_chart, bg, OBJPROP_XDISTANCE,    m_left_margin);
   ObjectSetInteger(m_chart, bg, OBJPROP_YDISTANCE,    m_top_margin);
   ObjectSetInteger(m_chart, bg, OBJPROP_XSIZE,        m_panel_w);
   ObjectSetInteger(m_chart, bg, OBJPROP_YSIZE,        m_panel_h);
   ObjectSetInteger(m_chart, bg, OBJPROP_BGCOLOR,      C'13,17,23');
   ObjectSetInteger(m_chart, bg, OBJPROP_BORDER_COLOR, C'48,54,61');
   ObjectSetInteger(m_chart, bg, OBJPROP_BORDER_TYPE,  BORDER_FLAT);
   ObjectSetInteger(m_chart, bg, OBJPROP_BACK,         true);
   ObjectSetInteger(m_chart, bg, OBJPROP_SELECTABLE,   false);
   //--- Row labels and value labels created via MakeLabel()
   //--- (see attached source for the full sequence)
   return(true);
  }
Each label object uses ANCHOR_LEFT_UPPER so that its OBJPROP_XDISTANCE measures from the left edge of the subwindow. This means the panel shifts correctly when the chart is resized. The Update() method changes only the text properties of the value labels, avoiding the cost of destroying and recreating objects on every CSV reload.
One detail prevents a common visual glitch: after a Refresh button click, the button stays in its pressed state until the next mouse event unless it is explicitly reset. Update() always calls:
//--- Reset button visual state after handling click
ObjectSetInteger(m_chart, ObjName("_btn_refresh"), OBJPROP_STATE, false);
This reset happens inside Update() — after the CSV has been read — rather than directly in OnChartEvent. Resetting the state before the read completes gives the user no visual confirmation that the click was registered.
Bold font weight is encoded in the GDI face name ("Courier New Bold") rather than through OBJPROP_BOLD. The OBJPROP_BOLD flag was added in MT5 Build 2361; the face-name approach works on all builds that support OBJ_LABEL.
The Indicator Core: AlternativeBarsViewer
Buffer setup
DRAW_COLOR_CANDLES requires five indicator buffers: the four OHLC price buffers and one color-index buffer. The color-index buffer is bound with INDICATOR_COLOR_INDEX so MQL5 treats it as a lookup into the plot's color array rather than as a price series. The plot's empty sentinel is EMPTY_VALUE (DBL_MAX), set via PlotIndexSetDouble(0, PLOT_EMPTY_VALUE, EMPTY_VALUE). Three colors are defined: green (bullish), tomato (bearish), and gold (forming).
#property indicator_separate_window
#property indicator_buffers 5
#property indicator_plots   1
#property indicator_label1  "AltBar"
#property indicator_type1   DRAW_COLOR_CANDLES
#property indicator_color1  clrLimeGreen,clrTomato,clrGold
#property indicator_width1  1
OnCalculate and tick processing
Every call to OnCalculate with prev_calculated == 0 triggers a full reset: the bar constructor is deleted and recreated, all stores are cleared, and the appropriate data source is loaded from scratch. Incremental calls consume only new data — new ticks since the last processed millisecond for SRC_TICKS, newly closed chart bars for SRC_OHLC, or a file-size check for SRC_CSV. After each incremental or full update, RenderBars() is called to refresh the display.
The OHLC-to-tick synthesizer deserves attention. Each chart bar is expanded into exactly four ticks, routed through the live ProcessTick() loop:
//+------------------------------------------------------------------+
//| Feed one chart bar as 4 synthetic ticks (O/H/L/C)                |
//| Approximation for the OHLC source. Real volume (if available),   |
//| otherwise tick volume, assigned to the close tick.               |
//+------------------------------------------------------------------+
void FeedBarAsTicks(const int i,
                    const datetime &time[], const double &open[],
                    const double &high[],
const double &low[],
                    const double &close[],
const long   &tick_volume[],
                    const long   &volume[], const int    &spread[])
  {
   double vol     = (volume[i] > 0) ? (double)volume[i] : (double)tick_volume[i];
   double ask_off = (double)spread[i] * _Point;
   bool   up      = (close[i] >= open[i]);

   double seq[4];
   seq[0] = open[i];
   seq[1] = up ? low[i]  : high[i];
   seq[2] = up ? high[i] : low[i];
   seq[3] = close[i];

   for(int k = 0; k < 4; k++)
     {
      MqlTick t;
      ZeroMemory(t);
      t.time     = time[i];
      t.time_msc = (long)time[i] * 1000 + k;
      t.bid      = seq[k];
      t.ask      = seq[k] + ask_off;
      t.last     = seq[k];
      t.volume   = (k == 3) ? (ulong)vol : 0;

      g_tick_num++;
      SBar bar;
      if(g_bar.ProcessTick(t, g_tick_num, bar))
         AppendBar(bar);
     }
  }
The direction of the synthetic tick sequence — open→low→high→close for bearish, open→high→low→close for bullish — influences the tick rule classifier inside imbalance and runs bars. This is an acknowledged approximation: the intra-bar tick sequence on a real feed is unknown from OHLC data. For parameter exploration the approximation is sufficient; for precise calibration, use SRC_TICKS.
Tick deduplication
SRC_TICKS uses a millisecond bookmark to avoid reprocessing ticks from the previous OnCalculate call. Ticks are identified by time_msc; because multiple ticks can share the same millisecond, a count of same-millisecond ticks at the bookmark is maintained alongside the timestamp:
//--- Remember where we stopped, counting ties at the last millisecond
ulong last = (ulong)ticks[got - 1].time_msc;
int   cnt  = 0;
for(int i = got - 1;
    i >= 0 && (ulong)ticks[i].time_msc == last;
    i--)
   cnt++;
g_last_msc       = last;
g_last_msc_count = cnt;
On the next call, ticks earlier than g_last_msc are skipped entirely, and exactly g_last_msc_count ticks at g_last_msc are also skipped (they were the last batch consumed). This ensures that each tick is fed to ProcessTick() exactly once across multiple OnCalculate invocations, regardless of overlapping tick delivery windows.
Degenerate Bars
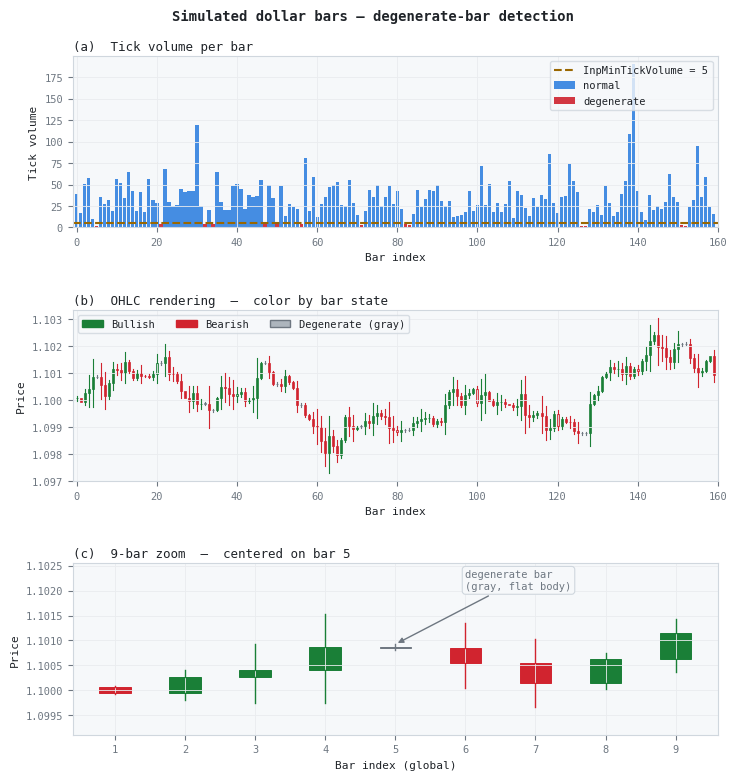
Figure 3. A three-panel illustration of simulated dollar bars with degenerate bars highlighted
- Panel (a): Tick volume histogram for 160 simulated dollar bars. Degenerate bars (forced to 3 ticks) appear in red; the dashed yellow line marks the InpMinTickVolume threshold at 5.
- Panel (b): OHLC candlestick rendering. Bullish bars are green, bearish are orange-red, and degenerate bars are gray. The color coding surfaces the degenerate bars immediately without requiring inspection of tick volume separately.
- Panel (c): Zoom into a nine-bar window centered on one degenerate bar. The flat, gray candle is unambiguous against its neighbors even when surrounding bars are small.
The degenerate-bar condition can arise from two distinct causes, and it is worth distinguishing them before adjusting the threshold. The first cause is a legitimately thin period: low-volatility market sessions produce fewer ticks, and an imbalance threshold calibrated on an active session will fire on less data during quiet periods. The second cause is a miscalibrated threshold: a value set too low relative to the prevailing tick arrival rate closes bars before they accumulate enough information.
The two causes have different corrections. A legitimate thin period requires no action — the bar is valid, just less informative. A miscalibrated threshold requires raising InpExpTicksInit in BarBuilderEA. The panel's degenerate count separates these cases in practice: if the count rises only during specific session hours, the cause is structural. If it is uniformly distributed across all hours, the threshold needs adjustment.
Panel Layout and Object Naming

Figure 4. CViewerPanel layout — graphical objects in the indicator subwindow
- Background: OBJ_RECTANGLE_LABEL sized 200 × 140 px, anchored to the top-left corner of the subwindow, positioned directly below the mode toggle button (YDISTANCE = 60).
- Stats rows: Five rows, each consisting of a label on the left (OBJ_LABEL, grey) and a value on the right (OBJ_LABEL, colour‑coded). Only the value labels change after creation; row labels are set once and never touched again.
- Refresh button: OBJ_BUTTON spanning the full panel width minus a 16‑px margin. Its OBJPROP_STATE is reset to false after every successful reload so it does not remain pressed.
All object names share a common prefix (BV_ by default) so that ObjectDelete calls in Destroy() enumerate the exact set of owned objects without scanning the chart's full object list. The prefix is set in the CViewerPanel constructor and can be overridden if multiple panel instances are needed on the same chart.
Attaching the Viewer
The setup procedure depends on which data source is selected:
Tick or OHLC source
- Attach AlternativeBarsViewer to any chart for the target symbol. Set InpBarType and InpBarSize (and the EWM parameters for imbalance or runs bars) to match the configuration you want to inspect.
- Set InpTickSource to SRC_TICKS for tick-accurate bars with a live forming bar, or to SRC_OHLC for a quick synthetic approximation.
- For SRC_TICKS, set InpLookbackDays to the number of days of tick history to load. Longer lookbacks produce more bars but take more time on the first load.
- Set InpRenderMode to RENDER_INDEX (the default) for collision-free display, or to RENDER_TIME if calendar alignment matters. The mode can be changed at any time with the toggle button or the T key.
CSV source
- Start BarBuilderEA on any chart with the desired bar type and parameters. The EA prints the output CSV filename to the Experts log on init: BarBuilderEA: type=dollar_bar, bar_size=10000000, output=EURUSD_dollar_bar_size10000000.csv.
- Attach AlternativeBarsViewer to the same chart (or any chart on the same symbol). Set InpTickSource to SRC_CSV. Leave InpCsvFile empty to use the auto-constructed filename, or fill it with the exact string from the Experts log.
- If the EA writes to the Common folder (FILE_COMMON), set InpCsvCommon to true. By default, BarBuilderEA writes to the terminal-local MQL5\Files\ folder.
Multiple instances of AlternativeBarsViewer can run simultaneously on the same chart in separate subwindows — one per bar type or parameter set. The host chart's time axis synchronizes the subwindows in RENDER_TIME mode, making side-by-side bar type comparison straightforward. In RENDER_INDEX mode, each subwindow shows its bar sequence independently; the alignment between subwindows loses meaning, but within each subwindow bar spacing is uniform and legible.
Conclusion
Alternative bars are not useful if their calibration cannot be observed in real time. The CSV output from BarBuilderEA is precise and complete, but inspecting it requires leaving the terminal — and at the bar volumes that accumulate during live operation, Python-based visualization degrades before the history is fully rendered. AlternativeBarsViewer addresses both problems by reusing the exact bar construction machinery the EA uses, routing three data sources through it, and rendering the result natively in a dedicated subwindow.
The two render modes serve different needs. RENDER_TIME preserves calendar alignment and makes sparse bar types directly comparable with the host chart's price action. RENDER_INDEX eliminates gaps and collisions, which is essential for imbalance and runs bars whose irregular spacing would otherwise make calibration patterns invisible. The toggle between them costs a single button click and requires no parameter change.
The next article in this series will implement microstructure features directly on the alternative bar stream, replacing the CSV-based signal bus with a live feature pipeline that feeds OHLC and imbalance signals into an ONNX model without writing intermediate files.
13. Attached Files
| File | Location | Description | |
|---|---|---|---|
| 1. | AlternativeBarsViewer.mq5 | MQL5\Indicators\ | Indicator core. Builds alternative bars from real ticks, synthetic OHLC ticks, or the EA's CSV. Renders via DRAW_COLOR_CANDLES in two togglable layout modes. Delegates GUI updates to CViewerPanel |
| 2. | CViewerPanel.mqh | MQL5\Include\AlternativeBars\ | GUI panel. Thirteen graphical objects anchored to the subwindow's top‑left corner; five stat rows with text-only updates on each reload via Update() |
| 3. | BarBuilderEA.mq5 | MQL5\Experts\ | Expert Advisor that constructs alternative bars from the live tick stream and writes them to CSV. Persists EWM state to a binary file across restarts. Required for SRC_CSV mode. |
| 4. | CBarConstructor.mqh | MQL5\Include\AlternativeBars\ | Abstract base class. Owns the OHLC accumulator, SeedBar(), UpdateAccumulator(), FillBar(), and state persistence. Exposes forming-bar accessors used by the viewer to draw the live candle. |
| 5. | CStandardBars.mqh | MQL5\Include\AlternativeBars\ | Concrete constructors for time, tick, volume, and dollar bars. CCumSumBar shared parent for volume and dollar. All derive from CBarConstructor. |
| 6. | CImbalanceBars.mqh | MQL5\Include\AlternativeBars\ | Tick rule classifier (CTickRule) and EWM-adaptive imbalance bar constructor (CImbalanceBar) for tick, volume, and dollar imbalance variants. |
| 7. | CRunsBar.mqh | MQL5\Include\AlternativeBars\ | Run bar constructor. Closes when the buy or sell run accumulator exceeds E[T] × max(E[theta+/T], E[theta-/T]). Tick, volume, and dollar variants. Uses mid-price valuation for dollar runs. |
Warning: All rights to these materials are reserved by MetaQuotes Ltd. Copying or reprinting of these materials in whole or in part is prohibited.
This article was written by a user of the site and reflects their personal views. MetaQuotes Ltd is not responsible for the accuracy of the information presented, nor for any consequences resulting from the use of the solutions, strategies or recommendations described.

- Free trading apps
- Over 8,000 signals for copying
- Economic news for exploring financial markets
You agree to website policy and terms of use