

Strategy Optimization and Forward Analysis (Part 1): The Pardo Method — A Basic Model
 386
386
 4
4

Introduction
You have written a strategy, built an indicator and an Expert Advisor (EA), and gotten a nice curve in the backtest — but the main question remains: can you trust it in real trading? This article focuses not merely on implementing ideas in MQL5 code, but on building a reproducible workflow pipeline: from formalizing a trading idea to objective post-optimization validation. We describe the specific artifacts and steps that every practicing algorithm developer should end up with:
- clear formalization of entry/exit rules and risk management (an indicator plus one or two Expert Advisors (EAs));
- selection of relevant parameters and determination of scan ranges;
- a scheme for dividing the history into in-sample and out-of-sample (forward) periods, with criteria for window sizes;
- a method for finding “plateau” (stable) settings instead of fragile best runs;
- a protocol for forward testing, multi-environment testing (across multiple markets and timeframes), and decision-making thresholds.
The purpose of this article is not to provide a set of magic filters, but rather a practical test plan and procedure that will help you understand which parameters are truly important, how to assess the overall reliability of a model, and how to determine its “shelf life” and the rules for re-optimization. The examples show the PardoSystem indicator and the PardoEA / Breakout_Bounce Expert Advisors (EAs) as illustrative implementations of this methodology.
Development and Structure of a Trading System
Developing a trading system is a complex process consisting of several interrelated steps. This entire procedure is fairly simple, provided that the trader follows each step carefully and meticulously, giving due consideration to its importance.
There are two approaches to creating a trading system. The first approach relies on logic and systematic empirical verification: that is, each step must be thoroughly considered before beginning rigorous testing. This approach, which is presented and developed in this article, is the path of knowledge. The profitable trading models that result from this approach provide an invaluable advantage. A trader who uses this system has a thorough understanding of why and how this trading model works and succeeds. A simple example of this approach is presented in the form of an indicator and two Expert Advisors (EAs).
To understand the results of a trading model, you need to follow the seven steps for building and testing it:
1. Formulating a trading strategy
2. Documenting its rules in a specific format
3. Testing the trading strategy
4. Optimizing the trading strategy
5. Trading using this strategy
6. Tracking live trading performance and comparing it with test performance
7. Improving and refining this trading strategy
Each of these steps depends on the successful completion of the previous step. Constant feedback, and using information from subsequent steps to revisit and adjust earlier steps, is a fundamental component of this approach and one of its greatest strengths. If the system is sound, this approach leads to the continuous evolution, refinement, and improvement of the chosen trading strategy.
Developing a trading system starts with an idea. Without it, everything is just guesswork. The rules that make up the strategy must be laid out in a logical sequence. A strategy can be simple or complex — whatever you prefer; ultimately, it doesn't matter. Coherence and consistency are important for a strategy. In this article, we will analyze and optimize several trading systems based on trading range breakouts.
Failing to fully define all the rules of a strategy is one of the most common mistakes made when developing systems. This is especially true for novice traders. The two basic requirements for defining a trading strategy are an entry rule and an exit rule.
Typically, a strategy consists of buy and sell conditions that are “mirror images” of each other. For example, a buy signal occurs when the price rises above the 3-day high, and a sell signal occurs when the price breaks below the 3-day low. This is a symmetrical (mirror) system: the conditions for BUY and SELL are exactly the same, but they point in different directions (a breakout above the high/below the low over N bars).
A strategy may also consist of completely different conditions for entering a buy or sell position. For example, a buy signal is generated when the price breaks above the 5-day high, and a sell signal is generated when the 5-day moving average falls below the 20-day moving average. This is an asymmetric trading system where BUY uses a breakout of the high, while SELL uses a moving-average crossover.
- Preliminary testing: early detection of fundamental flaws, verification of basic functionality, and assessment of an idea’s initial viability.
- Validation through multiple testing: confirming performance under various conditions, verifying the consistency of results, and assessing the robustness of the strategy.
- Optimization results: verifying parameter stability, assessing the risk of over-optimization, and determining the reliability of the settings.
- Forward analysis: testing on unseen data, assessing generalization capability, and out-of-sample testing beyond the optimization sample.
- Real-world performance: final validation under real-world conditions, testing execution in live trading, and assessing practical applicability.
This algorithm ensures that trading systems undergo rigorous validation before live deployment and have a clear path for continuous improvement based on real-world results.
Key principles:
- step-by-step development: from concept to live trading through validated stages
- evidence-based approach: every decision is based on testing and analysis
- risk management: minimizing losses at each stage
- adaptability: the ability to improve based on experience
- discipline: following a structured methodology
Developing a trading system is a complex process consisting of several interrelated steps. In practice, this process becomes manageable if the trader carefully and consistently follows each step, giving due attention to its significance, because clear rules and discipline are the key to successful trading. We will try to translate this philosophy into actual MQL5 code and create not one, but two fully-fledged trading systems, each of which is a complete strategy with entry and exit rules.
The first of these is a trend-following trading system based on the classic Envelopes indicator and modernized using filters developed by Robert Pardo, author of the renowned book The Evaluation and Optimization of Trading Strategies. The system is designed to trade at the opening of a bar and consists of the PardoSystem.mq5 indicator and the PardoEA.mq5 Expert Advisor (EA). The indicator analyzes the Open[0] price (of the current forming bar) and generates a signal, while the EA, synchronized with the indicator on bar 0, immediately opens a trade at the market price (Ask/Bid). In the Strategy Tester using the “OHLC” model, this perfectly simulates entry at the open price.
Description and Operation of the PardoSystem.mq5 Indicator: Trading in the Direction of the Trend
The system combines three powerful filters to weed out false entries:
- Envelopes channel breakout: the open price must be above the upper band (for Buy) or below the lower band (for Sell).
- Trend confirmation: the open price of the current bar must be higher (for Buy) or lower (for Sell) than the open price of the previous bar (a simple but effective trend filter).
- Local extremum breakout (Pardo): the open price must break out above the high (for Buy) or below the low (for Sell) formed over the last N bars (the `InpLookbackBars` parameter), excluding the current and first bars.
Indicator PardoSystem
External variables (Input Parameters)
//--- INPUT PARAMETERS
//--- ENVELOPES CHANNEL PARAMETERS
input group "========== ENVELOPES CHANNEL PARAMETERS =========="
input int           InpMAPeriod       = 20;               // MA Period for Envelopes
input int           InpMAShift        = 0;                // MA Shift
input double        InpDeviation      = 0.25;             // Deviation (0.25 = 25%)
input ENUM_MA_METHOD InpMAMethod      = MODE_SMA;         // MA Method
input ENUM_APPLIED_PRICE InpAppliedPrice = PRICE_CLOSE;   // Price for MA
input color         InpUpperColor     = clrDodgerBlue;    // Upper band color
input color         InpLowerColor     = clrOrangeRed;     // Lower band color
input bool          InpShowEnvelopes  = true;             // Show bands
Description of the Envelopes parameters:
- InpMAPeriod — the moving average period used to calculate the channel: the higher the value, the slower the channel reacts
- InpDeviation — channel deviation as a percentage: for example, 0.25 means 25% of the MA value
- InpMAMethod — the method used to calculate the moving average (SMA, EMA, SMMA, etc.)
- InpAppliedPrice — the price used to calculate the MA (CLOSE, OPEN, HIGH, LOW)
- InpUpperColor/InpLowerColor — channel band colors for visual distinction
- InpShowEnvelopes — you can disable the display of the bands, leaving only the arrows
Group "Pardo System Parameters"
//--- PARDO SYSTEM PARAMETERS
input group "========== PARDO SYSTEM PARAMETERS =========="
input int           InpLookbackBars = 5;                 // Bars for MAX/MIN search
Description of Pardo parameters:
-
InpLookbackBars — the number of bars to search for the maximum and minimum (starting from bar 2): determines the system's sensitivity to breakouts
Group "Arrow Display Settings"
//--- SIGNAL ARROW SETTINGS
input group "========== SIGNAL ARROW SETTINGS =========="
input color         InpBuyArrowColor = clrBlue;          // BUY arrow color
input color         InpSellArrowColor = clrRed;          // SELL arrow color
input int           InpArrowSize = 2;                    // Arrow size
input double        InpArrowOffset = 15;                 // Offset from the OPEN price
Description of the arrow settings:
- InpBuyArrowColor/InpSellArrowColor — arrow colors for different directions
- InpArrowSize — arrow line thickness
- InpArrowOffset — the arrow offset from the OPEN price in points (so that the arrow does not overlap the price)
//--- PERFORMANCE PARAMETERS
input group "========== PERFORMANCE PARAMETERS =========="
input int           InpMaxHistoryBars = 1000;             // Max bars to display
This indicator:
- displays trading conditions on a chart,
- plots key levels and indicators,
- displays signals as arrows on bar 0,
- displays an instructional comment with calculations,
- helps you understand how the system works.
The OnInit() function — initializing the indicator
//+------------------------------------------------------------------+
//| Initialization function                                          |
//+------------------------------------------------------------------+
int OnInit()
  {
   Print("╔═══════════════════════════════════════════════════════════════════════════════════════════════════════════════╗");
   Print("║        PardoSystem v8.2                                                                                       ║");
   Print("╠═══════════════════════════════════════════════════════════════════════════════════════════════════════════════╣");
   Print("║   TRADING LOGIC:                                                                                              ║");
   Print("║    1. CHANNEL BREAKOUT: OPEN > UPPER (BUY) / OPEN < LOWER (SELL)                                              ║");
   Print("║    2. TREND FILTER: OPEN[0] > OPEN[1] (BUY) / < (SELL)                                                        ║");
   Print("║    3. EXTREMUM BREAKOUT: MAX(High[2..", InpLookbackBars, "]) / MIN(Low[2..", InpLookbackBars, "])             ║");
   Print("╠═══════════════════════════════════════════════════════════════════════════════════════════════════════════════╣");
   Print("║ ARROWS ARE CALCULATED LIVE ON EACH TICK/NEW BAR                                                               ║");
   Print("║ ONLY ONE SIGNAL PER BAR!                                                                                      ║");
   Print("║ BUFFER 2 - BUY | BUFFER 3 - SELL                                                                              ║");
   Print("╚═══════════════════════════════════════════════════════════════════════════════════════════════════════════════╝");

   //--- Bind buffers
   SetIndexBuffer(0, UpperBuffer,    INDICATOR_DATA);
   SetIndexBuffer(1, LowerBuffer,    INDICATOR_DATA);
   SetIndexBuffer(2, BuyArrowBuffer, INDICATOR_DATA);
   SetIndexBuffer(3, SellArrowBuffer,INDICATOR_DATA);

   //--- Plotting Envelopes bands
   PlotIndexSetInteger(0, PLOT_DRAW_TYPE,   InpShowEnvelopes ? DRAW_LINE : DRAW_NONE);
   PlotIndexSetInteger(0, PLOT_LINE_COLOR,  InpUpperColor);
   PlotIndexSetInteger(0, PLOT_LINE_WIDTH,  2);

   PlotIndexSetInteger(1, PLOT_DRAW_TYPE,   InpShowEnvelopes ? DRAW_LINE : DRAW_NONE);
   PlotIndexSetInteger(1, PLOT_LINE_COLOR,  InpLowerColor);
   PlotIndexSetInteger(1, PLOT_LINE_WIDTH,  2);

   //--- BUY arrows (code 233 = up arrow)
   PlotIndexSetInteger(2, PLOT_DRAW_TYPE,   DRAW_ARROW);
   PlotIndexSetInteger(2, PLOT_ARROW,       233);
   PlotIndexSetInteger(2, PLOT_LINE_WIDTH,  InpArrowSize);
   PlotIndexSetInteger(2, PLOT_LINE_COLOR,  InpBuyArrowColor);

   //--- SELL arrows (code 234 = down arrow)
   PlotIndexSetInteger(3, PLOT_DRAW_TYPE,   DRAW_ARROW);
   PlotIndexSetInteger(3, PLOT_ARROW,       234);
   PlotIndexSetInteger(3, PLOT_LINE_WIDTH,  InpArrowSize);
   PlotIndexSetInteger(3, PLOT_LINE_COLOR,  InpSellArrowColor);

   //--- Create Envelopes indicator handle
   handleEnvelopes = iEnvelopes(_Symbol, _Period, InpMAPeriod, InpMAShift,
                                InpMAMethod, InpAppliedPrice, InpDeviation);
   if(handleEnvelopes == INVALID_HANDLE)
     {
      Print("ERROR: Failed to create Envelopes handle! Error code: ", GetLastError());
      return(INIT_FAILED);
     }

   IndicatorSetString(INDICATOR_SHORTNAME, indicatorName + " v8.2 FIXED");
   lastBarTime = 0;
   return(INIT_SUCCEEDED);
  }
This function:
- displays a nice banner describing the logic,
- binds buffers to the indicator,
- configures the display (colors, line types, arrow symbols),
- creates a handle for the built-in indicator iEnvelopes
The OnCalculate() function — the indicator’s “brain”
//+------------------------------------------------------------------+ //| Main calculation function | //+------------------------------------------------------------------+ int OnCalculate(const int rates_total, const int prev_calculated, const datetime &time[], const double &open[], const double &high[], const double &low[], const double &close[], const long &tick_volume[], const long &volume[], const int &spread[]) { if(handleEnvelopes == INVALID_HANDLE) return(0); //--- Need at least InpLookbackBars+2 bars for extremum calculation if(rates_total < InpLookbackBars + 10) return(0); //--- Ensure Envelopes has enough data if(BarsCalculated(handleEnvelopes) < rates_total) return(0); //--- Copy the Envelopes bands (both upper and lower) if(CopyBuffer(handleEnvelopes, 0, 0, rates_total, UpperBuffer) <= 0) return(0); if(CopyBuffer(handleEnvelopes, 1, 0, rates_total, LowerBuffer) <= 0) return(0); //--- Set series orientation (0 = newest bar) ArraySetAsSeries(UpperBuffer, true); ArraySetAsSeries(LowerBuffer, true); ArraySetAsSeries(BuyArrowBuffer, true); ArraySetAsSeries(SellArrowBuffer,true); ArraySetAsSeries(open, true); ArraySetAsSeries(high, true); ArraySetAsSeries(low, true); ArraySetAsSeries(time, true); //--- Determine the calculation range // For performance reasons, we recalculate only the last InpMaxHistoryBars. // But we must clear any arrows outside this range. int maxBars = MathMin(rates_total, InpMaxHistoryBars); //--- Reset all arrow buffers before recalculating (to avoid ghost signals) for(int i = 0; i < rates_total; i++) { BuyArrowBuffer[i] = EMPTY_VALUE; SellArrowBuffer[i] = EMPTY_VALUE; } //--- Main loop: calculate signals for all bars within the history limit for(int bar = 0; bar < maxBars; bar++) { //--- Need enough future bars for the extremum (bar+2 ... bar+InpLookbackBars) if(bar + InpLookbackBars + 2 >= rates_total) continue; //--- Get current and previous open prices double currOpen = open[bar]; double prevOpen = open[bar+1]; //--- Get Envelopes bands double upperEnv = UpperBuffer[bar]; double lowerEnv = LowerBuffer[bar]; //--- Validate bands if(upperEnv <= 0 || lowerEnv <= 0 || upperEnv <= lowerEnv) continue; //--- Calculate the Pardo extremum: // MAX(High[bar+2] ... High[bar+InpLookbackBars]) // MIN(Low[bar+2] ... Low[bar+InpLookbackBars]) double maxHigh = high[bar+2]; double minLow = low[bar+2]; for(int i = 2; i <= InpLookbackBars; i++) { int idx = bar + i; if(idx >= rates_total) break; if(high[idx] > maxHigh) maxHigh = high[idx]; if(low[idx] < minLow) minLow = low[idx]; } //--- BUY signal conditions: // 1. OPEN price above the UPPER band // 2. Trend filter: current OPEN > previous OPEN // 3. Pardo breakout: current OPEN > maxHigh of lookback bars if(currOpen > upperEnv) { if(currOpen > prevOpen && currOpen > maxHigh) { // Place the BUY arrow slightly below the OPEN price double arrowPrice = currOpen - (InpArrowOffset * _Point); BuyArrowBuffer[bar] = arrowPrice; } } //--- SELL signal conditions: // 1. OPEN price below the LOWER band // 2. Trend filter: current OPEN < previous OPEN // 3. Pardo breakout: current OPEN < minLow of lookback bars else if(currOpen < lowerEnv) { if(currOpen < prevOpen && currOpen < minLow) { // Place the SELL arrow slightly above the OPEN price double arrowPrice = currOpen + (InpArrowOffset * _Point); SellArrowBuffer[bar] = arrowPrice; } } //--- If the price is inside the channel -> no signal (already cleared by the reset) } //--- Optional: log on new bar (commented out to prevent spam) datetime currentBarTime = time[0]; if(currentBarTime != lastBarTime) { lastBarTime = currentBarTime; // Uncomment for debugging: // Print("New bar: ", TimeToString(currentBarTime), " | Total bars: ", rates_total); } return(rates_total); }
This function:
- loads Envelopes data via CopyBuffer,
- sets the arrays as time series for correct indexing (bar 0 is the current bar),
- clears all buffers on the first run (to prevent artifacts),
- iterates over the bars in the main loop from newest to oldest,
- calculates new signals based on three conditions,
- limits the display to the last 1,000 bars.
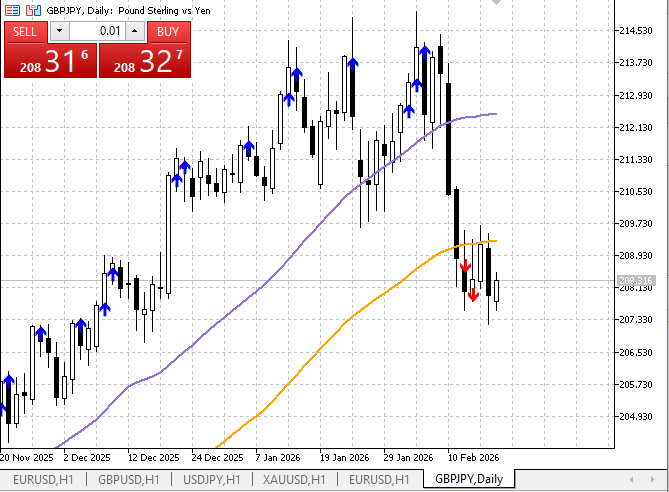
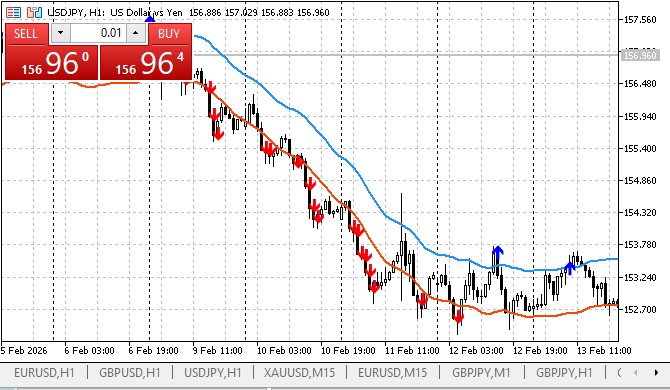
The indicator displays three key elements on the chart:
- Envelopes channel (blue upper band and red lower band) — normal volatility zone
- blue up arrows — BUY signals
- red downward arrows — SELL signals
IMPORTANT: Each bar can have ONLY ONE arrow! The indicator does not generate both BUY and SELL signals on the same bar.
BUY SIGNAL:
    Bar OPEN price > UPPER Envelopes band             // Upward breakout of the channel
    AND
    OPEN[0] > OPEN[1]                                 // Upward trend
    AND
    OPEN[0] > MAX(High[2..N])                         // Breakout of the N-bar high (Pardo)

SELL SIGNAL:
    Bar OPEN price < LOWER Envelopes band             // Downward breakout of the channel
    AND
    OPEN[0] < OPEN[1]                                 // Downward trend
    AND
    OPEN[0] < MIN(Low[2..N])                          // Breakout of the N-bar low (Pardo)
The indicator first checks the price's position relative to the channel:
- if the price is ABOVE the upper band — we check the BUY conditions
- if the price is BELOW the lower band — we check the SELL conditions
- if the price is INSIDE the channel — there are NO signals
It makes sense: a channel breakout is an excellent initial filter.
/*
  INDICATOR BUFFER STRUCTURE:

  Buffer 0 - Upper Envelopes band (UpperBuffer)    - blue line
  Buffer 1 - Lower Envelopes band (LowerBuffer)    - red line
  Buffer 2 - BUY arrows (BuyArrowBuffer)           - value != EMPTY_VALUE = signal
  Buffer 3 - SELL arrows (SellArrowBuffer)         - value != EMPTY_VALUE = signal
*/
A clear visualization of the indicator is available on the chart, and the arrow colors and sizes can be changed in the external variables.
Trading signals for opening positions are indicated by arrows colored blue (buy) and red (sell):
Here is how the indicator displays a bearish trend:
PardoEA Expert Advisor
This Expert Advisor (EA) analyzes the market based on the selected strategy, automatically opens and closes positions, manages risks (lot size calculation, Stop Loss, Take Profit), keeps a log of all actions, and works on ANY timeframe (from M1 to D1).Mathematical formula for trading signals:
- buy
Open[0] > Open[1]                   // Upward trend
AND
Open[0] > MAX(High[2..N])           // Breakout of the N-bar high
AND
Open[0] > UpperEnvelopes            // Breakout above the upper volatility band
- sell
Open[0] < Open[1]                   // Downward trend
AND
Open[0] < MIN(Low[2..N])            // Breakout below the N-bar low
AND
Open[0] < LowerEnvelopes            // Breakout below the lower volatility band
The Expert Advisor (EA) operates based on the iEnvelopes technical indicator and uses it to obtain raw data for processing and preparation for making trading decisions. It is also synchronized to trade at the open price of the current bar)with index "0".
How the Expert Advisor Works
External Variables (Input Parameters)
//--- INPUT PARAMETERS
//--- ENVELOPES CHANNEL PARAMETERS
input group "--- ENVELOPES CHANNEL PARAMETERS"
input int           InpMAPeriod          = 20;               // MA Period for Channel
input double        InpDeviation         = 0.25;             // Channel deviation (0.25 = 25%)
input ENUM_MA_METHOD InpMAMethod         = MODE_SMA;         // Moving Average Method
input ENUM_APPLIED_PRICE InpAppliedPrice = PRICE_CLOSE;      // Price for MA Calculation
Description of the Envelopes group:
- InpMAPeriod — the moving average period used to calculate the channel: the higher the value, the slower the channel reacts
- InpDeviation — channel deviation as a percentage: for example, 0.25 means 25% of the MA value; creates the upper and lower bands
- InpMAMethod — the method used to calculate the moving average (SMA, EMA, SMMA, etc.)
- InpAppliedPrice — the price used to calculate the MA (CLOSE, OPEN, HIGH, LOW, etc.)
//--- PARDO SYSTEM PARAMETERS
input group "--- PARDO SYSTEM PARAMETERS"
input int           InpLookbackBars      = 5;                // Depth for high/low search (N)
Description of the Pardo group:
-
InpLookbackBars — the number of bars used to find the high and low: determines the system's sensitivity to breakouts.
//--- TRADING PARAMETERS
input group "--- TRADING PARAMETERS"
input bool          buy                  = true;       // Allow BUY trades
input bool          sell                 = true;       // Allow SELL trades
input double        InpLotSize           = 0.01;       // Fixed position volume
input int           InpMagicNumber       = 0;          // Unique EA number
input bool          InpReverseClose      = true;       // Close on opposite signal
Description of trading parameters:
- buy/sell — flags indicating whether trading is allowed in each direction. Unwanted signals can be disabled.
- InpLotSize — a fixed lot size for all trades.
- InpMagicNumber — the unique identifier for the Expert Advisor (EA). This allows it to "see" only its own positions and not interfere with other Expert Advisors (EAs) or manual trading.
- InpReverseClose — if true, when an opposite signal is received, the current position is closed and a new one is opened (reversal).
//--- RISK MANAGEMENT
input group "--- RISK MANAGEMENT"
input double        InpStopLoss          = 100;              // Stop Loss (in points, 0 - off)
input double        InpTakeProfit        = 200;              // Take Profit (in points, 0 - off)
Description of risk management:
- InpStopLoss — protection level in points from the entry price: for example, 100 points = 100 * Point
- InpTakeProfit — the take-profit level in points relative to the entry price
The OnInit() function — initialization of the Expert Advisor (EA)
//+------------------------------------------------------------------+
//| Expert initialization function                                   |
//+------------------------------------------------------------------+
int OnInit()
  {
   Print("PardoEA v8.4 | ", _Symbol, " ", EnumToString(_Period),
         " | MA=", InpMAPeriod, " Dev=", InpDeviation,
         " Lookback=", InpLookbackBars, " Lot=", InpLotSize,
         " SL/TP=", InpStopLoss, "/", InpTakeProfit);

   if(InpLotSize <= 0)
     {
      Print("ERROR: Lot size must be > 0");
      return(INIT_PARAMETERS_INCORRECT);
     }

   trade.SetExpertMagicNumber(InpMagicNumber);
   trade.SetDeviationInPoints(0);

   ResetLastError();
   handleEnvelopes = iEnvelopes(_Symbol, _Period,
                                 InpMAPeriod, 0,
                                 InpMAMethod,
                                 InpAppliedPrice,
                                 InpDeviation);

   if(handleEnvelopes == INVALID_HANDLE)
     {
      Print("ERROR: iEnvelopes failed, error ", GetLastError());
      return(INIT_FAILED);
     }

   lastBarTime = iTime(_Symbol, _Period, 0);
   return(INIT_SUCCEEDED);
  }
Displays a detailed table with the Expert Advisor (EA) parameters:
- checks the validity of the input parameters
- creates a handle for the built-in iEnvelopes indicator with the specified parameters
- initializes the "last bar" variable to track new bars
- sets a magic number for trading operations
The OnTick() function — the main execution loop
//+------------------------------------------------------------------+
//| OnTick function                                                  |
//+------------------------------------------------------------------+
void OnTick()
  {
   if(!IsNewBar()) return;

   int signal = GetSignal();
   if(signal == 0) return;   // no signal → silent

   string signalType = (signal == 1) ? "BUY" : "SELL";
   Print("SIGNAL: ", signalType);

   //--- check permission
   if((signal == 1 && !buy) || (signal == -1 && !sell))
      return;

   int currentPos = GetCurrentPositionType();

   if(currentPos != 0)
     {
      if(InpReverseClose && currentPos != signal)
        {
         Print("Opposite signal -> closing position");
         CloseAllPositions();
        }
      else
        {
         return;   // same direction or reverse disabled
        }
     }

   OpenPosition(signal);
  }
Purpose: It is called on every tick, but performs actions only on a new bar. Gets a signal, checks permissions, manages existing positions, and opens new positions.
The GetSignal() function — the brain of the trading system
//+------------------------------------------------------------------+
//| Get trading signal (silent, no debug prints)                     |
//+------------------------------------------------------------------+
int GetSignal()
  {
   int bars = iBars(_Symbol, _Period);
   if(bars < InpLookbackBars + 10) return(0);

   double open[], high[], low[];
   ArraySetAsSeries(open, true);
   ArraySetAsSeries(high, true);
   ArraySetAsSeries(low, true);

   int needed = InpLookbackBars + 5;
   if(CopyOpen(_Symbol, _Period, 0, needed, open) < needed) return(0);
   if(CopyHigh(_Symbol, _Period, 0, needed, high) < needed) return(0);
   if(CopyLow(_Symbol, _Period, 0, needed, low) < needed) return(0);

   double open0 = open[0];
   double open1 = open[1];

   double upperEnv0, lowerEnv0;
   if(!GetEnvelopesValues(0, upperEnv0, lowerEnv0)) return(0);

   double maxHigh = high[2];
   double minLow  = low[2];
   for(int i = 2; i < 2 + InpLookbackBars; i++)
     {
      if(i >= ArraySize(high)) break;
      if(high[i] > maxHigh) maxHigh = high[i];
      if(low[i]  < minLow)  minLow  = low[i];
     }

   if(open0 > open1 && open0 > maxHigh && open0 > upperEnv0)
      return(1);   // BUY

   if(open0 < open1 && open0 < minLow && open0 < lowerEnv0)
      return(-1);  // SELL

   return(0);
  }
- copies market data (OPEN, HIGH, LOW) for calculations,
- retrieves the Envelopes values for the current bar via GetEnvelopesValues(),
- calculates the maximum and minimum using the Pardo Method (bars from 2 to 2+N),
- checks ALL THREE CONDITIONS SIMULTANEOUSLY at OPEN[0],
- returns: 1 — BUY, -1 — SELL, 0 — no signal.
All conditions are checked on the current bar "0" (candlestick) — this ensures an immediate response to a trading signal.
The GetEnvelopesValues() Function — Working with the Indicator
//+------------------------------------------------------------------+
//| Get Envelopes values for the specified bar                       |
//+------------------------------------------------------------------+
bool GetEnvelopesValues(int barIndex, double &upperEnv, double &lowerEnv)
  {
   double upperBuffer[1], lowerBuffer[1];

   ResetLastError();
   int copiedUpper = CopyBuffer(handleEnvelopes, 0, barIndex, 1, upperBuffer);
   int copiedLower = CopyBuffer(handleEnvelopes, 1, barIndex, 1, lowerBuffer);

   if(copiedUpper == 1 && copiedLower == 1)
     {
      if(upperBuffer[0] != EMPTY_VALUE && lowerBuffer[0] != EMPTY_VALUE &&
         upperBuffer[0] > 0 && lowerBuffer[0] > 0 &&
         MathIsValidNumber(upperBuffer[0]) && MathIsValidNumber(lowerBuffer[0]))
        {
         upperEnv = upperBuffer[0];
         lowerEnv = lowerBuffer[0];
         return(true);
        }
     }

   return(false);
  }
Reads data from the iEnvelopes indicator buffers using CopyBuffer:
- Buffer 0 — the upper Envelopes band
- Buffer 1 — the lower Envelopes band
- Checks data validity:
- The value is not equal to EMPTY_VALUE
- The value is greater than 0
- The value is a valid number (MathIsValidNumber)
- Returns true if the read operation is successful
The OpenPosition() function — opening a position
//+------------------------------------------------------------------+
//| Open position                                                    |
//+------------------------------------------------------------------+
void OpenPosition(int signal)
  {
   double entryPrice = iOpen(_Symbol, _Period, 0); //--- OPEN[0]

   if(entryPrice <= 0)
     {
      Print("ERROR: Invalid open price");
      return;
     }

   double sl, tp;
   string typeStr = (signal == 1) ? "BUY" : "SELL";

   CalculateSLTP(entryPrice, signal, sl, tp);

   bool result = false;
   if(signal == 1)
      result = trade.Buy(InpLotSize, _Symbol, entryPrice, sl, tp, eaComment);
   else
      result = trade.Sell(InpLotSize, _Symbol, entryPrice, sl, tp, eaComment);

   if(result)
     {
      Print("SUCCESS: OPEN ", typeStr, " @ ", DoubleToString(entryPrice, _Digits),
            " | SL: ", DoubleToString(sl, _Digits), " | TP: ", DoubleToString(tp, _Digits));
     }
   else
     {
      Print("ERROR: Opening ", typeStr, ": ", trade.ResultRetcodeDescription());
     }

   return;
  }
This function:
- uses the OPEN[0] price to enter the position,
- calculates SL and TP in points relative to the entry price,
- opens a position via CTrade::Buy() or CTrade::Sell(),
- logs the result of the trade.
// ALL DATA IS SYNCHRONIZED AUTOMATICALLY:
// 1. Market data (OPEN, HIGH, LOW) is retrieved directly from the trading terminal
// 2. The Envelopes data is taken from the built-in iEnvelopes indicator
// 3. All calculations are performed on the CURRENT BAR 0

double buySignal[1], sellSignal[1];

// Retrieving Envelopes values for the CURRENT bar (shift=0!)
CopyBuffer(handleEnvelopes, 0, 0, 1, upperBuffer);  // Upper band
CopyBuffer(handleEnvelopes, 1, 0, 1, lowerBuffer);  // Lower band

// Check: value != EMPTY_VALUE
if(upperBuffer[0] != EMPTY_VALUE && lowerBuffer[0] != EMPTY_VALUE)
{
   // The signal is calculated based on OPEN[0] and the obtained values
}
Characteristics of the Expert Advisor's operation:
| Characteristic | Description |
|---|---|
| Immediate response | The program reads signals on the current bar “0” and immediately opens a position |
| Technical analysis | Trades the trend + a breakout above the previous price high |
| Proper risk management | Customizable Stop Loss and Take Profit levels in points from the position entry price |
| Using a magic number | Manages only its own positions, without interfering with others |
| Closing positions safely | Iterating through a list of positions from the highest index to the lowest |
| Detailed logging | Complete information about each trade in the "Experts" journal |
| Protection against repeated entries | Trades only on new candlesticks (bars) |
| Reversal mode | Automatically closes opposite positions when a new trading signal is received |
Here is an example of how the PardoEA Expert Advisor works:
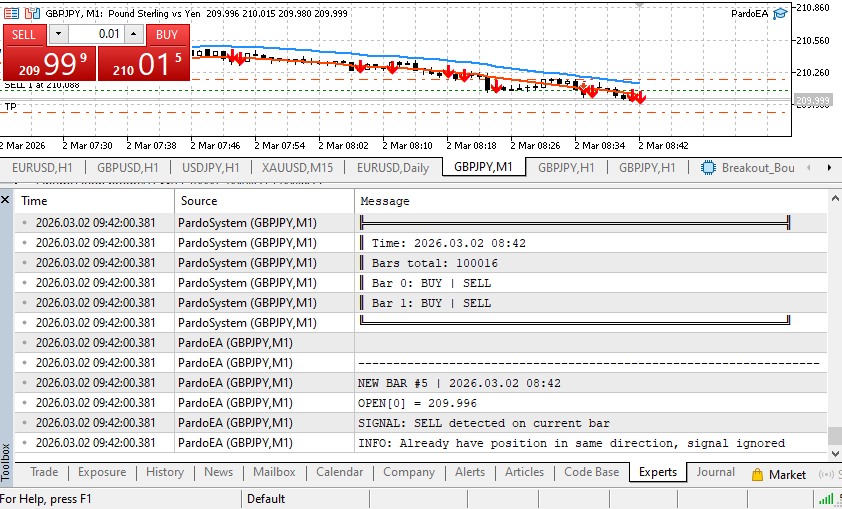
Detailed logging displays trading progress in the "Experts" tab of the MetaTrader 5 trading terminal.
You choose the trading timeframe yourself and run the Expert Advisor (EA). The goal of trading is to make a profit. The main reasons why a trading system helps achieve this goal are its ability to present potential quantitative results, the verifiability of those results, the system’s objectivity, and its consistency.
The Complete Guide to the Breakout_Bounce Universal Trading Strategy
Description of the Trading Algorithm
PHASE 1: Market Analysis and Level Calculation
- Start on a New Candlestick — the system is activated when each new bar opens
- Calculating Daily Levels — identifying the High/Low over the previous N days
- Retrieving Current Prices — current Ask and Bid values
- Analyzing Market Conditions — the user selects a strategy manually
- BREAKOUT MODE — entry in the direction of a level breakout
- BOUNCE MODE — entry in the opposite direction (bounce)
For the BREAKOUT strategy:
- BUY signal: Ask > Daily High Level (upward breakout of resistance)
- SELL signal: Bid < Daily Low Level (downward breakout of support)
For the BOUNCE strategy:
- BUY signal: Bid < Daily Low Level (upward bounce from support)
- SELL signal: Ask > Daily High Level (downward bounce from resistance)
- Closing Opposite Positions — automatic closing before opening a new position
- Checking for an Open Position — preventing duplication
- Opening a Position — BUY at Ask, SELL at Bid
- Setting SL/TP — calculating SL and TP levels
- Drawing Arrows — blue for BUY, red for SELL
- Updating Information — displaying statistics on the chart
- Continuous Monitoring — tracking the open position
- Exit Conditions — TP or SL triggering, a new opposite signal
- Closing a Position — exiting the market
- Deleting Graphical Objects — clearing arrows for closed positions
- Updating Statistics — calculating and displaying results
- Preparing for the Next Candlestick — resetting states and waiting
KEY FEATURES OF THE ALGORITHM
1. DUAL STRATEGY LOGIC
- BREAKOUT (LEVEL BREAKOUT) — for trending markets; trading in the direction of the level breakout
- BOUNCE (BOUNCE OFF LEVELS) — for range-bound markets; trading on bounces from key levels
- Manual Selection by the user
- Automatic SL/TP Calculation
- Preventing Duplicate Positions
- Closing Opposite Positions
- Colored entry arrows
- Automatic cleanup
- Detailed statistics on the chart
- Clear structure — logical division into phases
- Strategy flexibility — two opposing strategies in one system
- Full visibility — every step is clearly defined and visualized
- Reliability — multiple checks before opening positions
- Implementation of a systematic approach to management and monitoring
WE TRADE THE TWO "FACES" OF THE MARKET
| Mode 1: breakout (BREAKOUT) | Mode 2: bounce (BOUNCE) |
|---|---|
| Trading the "Strength Continues the Move" market phase | Trading the market phase "Resistance is weakening" |
| Trading IN THE DIRECTION of the breakout | Trading AGAINST the breakout |
| Buy when the price is ABOVE | Buy when the price is BELOW |
| Sell when the price is BELOW | Sell when the price is ABOVE |
Mathematical Model
PERIOD_D1 in CalculateDailyLevels():
datetime today = iTime(_Symbol, PERIOD_D1, 0);
CopyHigh(_Symbol, PERIOD_D1, 1, InpDayPeriod, highArray);
Levels are always calculated based on the daily timeframe.
InpDayPeriod = the number of days to search for an extreme (2–60 days).
The execution timeframe (M1–H4) determines only the frequency at which conditions are checked.
Trading Signal Logic:
Levels = MAX(High[D1...DN]) and MIN(Low[D1...DN]) for N days Where N = InpDayPeriod (optimized parameter: 3, 5, 7, 10, 14)BREAKOUT (breakout_bounce = true): BUY = Ask > DayHighLevel // Price broke out above the daily high SELL = Bid < DayLowLevel // Price broke out below the daily low BOUNCE (breakout_bounce = false): BUY = Bid < DayLowLevel // Price moved below the low (waiting for an upward bounce) SELL = Ask > DayHighLevel // Price moved above the high (waiting for a downward bounce)
Note: In the Expert Advisor (EA), we read the trading signal for a breakout/bounce from the symbol’s quote value on the daily timeframe. Mode switching is designed for ease of use (one variable — two completely different strategies). The external variables speak for themselves (the code is thoroughly commented).
//══════════════════════════════════════════════════════════════════════════════════
// GROUP 1: BASIC TRADING SETTINGS
//══════════════════════════════════════════════════════════════════════════════════
input group "══════════════════ BASIC TRADING SETTINGS ═══════════════════"
input double   InpLotSize = 0.1;           // Lot size
input int      InpMagicNumber = 1;         // Magic number
input int      InpSlippage = 1000;         // Slippage (points)

//══════════════════════════════════════════════════════════════════════════════════
// GROUP 2: RISK MANAGEMENT
//══════════════════════════════════════════════════════════════════════════════════
input group "══════════════════ RISK MANAGEMENT ═══════════════════"
input double   InpStopLoss = 200;          // Stop Loss (points), 0 = no stop loss
input double   InpTakeProfit = 200;        // Take Profit (points), 0 = no take profit

//══════════════════════════════════════════════════════════════════════════════════
// GROUP 3: PARDO SYSTEM STRATEGY
//══════════════════════════════════════════════════════════════════════════════════
input group "══════════════════ PARDO SYSTEM STRATEGY ═══════════════════"
input bool     breakout_bounce = true;     // Strategy: true = Breakout, false = Bounce
input int      InpDayPeriod = 3;           // Number of days for finding extremes

//══════════════════════════════════════════════════════════════════════════════════
// GROUP 4: VISUALIZATION AND LOGGING SETTINGS
//══════════════════════════════════════════════════════════════════════════════════
input group "══════════════════ VISUALIZATION SETTINGS ═══════════════════"
input bool     InpEnableLogging = true;    // Enable logging
input bool     InpEnableVisuals = true;    // Enable visualization
input color    InpHighLineColor = clrDodgerBlue;  // High line color
input color    InpLowLineColor = clrRed;   // Low line color
input color    InpBuyArrowColor = clrBlue; // BUY arrows color
input color    InpSellArrowColor = clrRed; // SELL arrow color
input bool breakout_bounce = true; // true = BREAKOUT, false = BOUNCE
Mathematical Basis of the System (Calculation of Key Levels)
DayHighLevel = MAX(High[1..N days])
DayLowLevel  = MIN(Low[1..N days])

Where N = InpDayPeriod (default is 3 days)
Let's take a look at the main functions.
//+------------------------------------------------------------------+
//| Expert initialization function                                   |
//+------------------------------------------------------------------+
int OnInit()
  {
//--- Initialize trading objects
   Trade.SetExpertMagicNumber(InpMagicNumber);
   Trade.SetDeviationInPoints(InpSlippage);
   Trade.SetTypeFilling(ORDER_FILLING_FOK);

//--- Initialize symbol information
   if(!SymbolInfo.Name(_Symbol))
     {
      Print("Error: Failed to initialize symbol " + _Symbol);
      return(INIT_FAILED);
     }
   SymbolInfo.RefreshRates();

//--- Initialize graphical objects (using “_” as the prefix)
   highLineName = "_HIGH_" + _Symbol + "_" + IntegerToString(InpDayPeriod);
   lowLineName  = "_LOW_"  + _Symbol + "_" + IntegerToString(InpDayPeriod);

//--- Display startup information
   Print("");
   Print("--- BREAKOUT/BOUNCE SYSTEM v6.5 (PARDO METHODOLOGY)");
   Print("");
   Print("---   • Symbol: " + _Symbol);
   Print("---   • Timeframe: " + EnumToString(_Period));
   Print("---   • Strategy Mode: " + (breakout_bounce ? "BREAKOUT" : "BOUNCE"));
   Print("---   • Day Period: " + IntegerToString(InpDayPeriod));
   Print("---   • Lot Size: " + DoubleToString(InpLotSize, 2));
   Print("---   • SL/TP: " + DoubleToString(InpStopLoss, 0) + "/" + DoubleToString(InpTakeProfit, 0) + " pts");
   Print("---   • Magic Number: " + IntegerToString(InpMagicNumber));
   Print("---   • Visualization: " + (InpEnableVisuals ? "ON" : "OFF"));
   Print("---   • Arrows: BLUE for BUY, RED for SELL");
   Print("");

   if(breakout_bounce)
     {
      Print("---   ENTRY CONDITIONS (BREAKOUT MODE):");
      Print("---   • BUY: Ask > Daily High (Breakout upward)");
      Print("---   • SELL: Bid < Daily Low (Breakout downward)");
     }
   else
     {
      Print("---   ENTRY CONDITIONS (BOUNCE MODE):");
      Print("---   • BUY: Bid < Daily Low (Expect bounce up from level)");
      Print("---   • SELL: Ask > Daily High (Expect bounce down from level)");
     }
   Print("");

   return(INIT_SUCCEEDED);
  }
This function is responsible for preparing the system for operation and configuring all settings. It:
- configures the CTrade trading object with a magic number,
- creates unique names for graphical objects,
- displays a detailed banner with strategy settings,
- displays the entry conditions for the selected mode.
//+------------------------------------------------------------------+
//| Expert tick function                                             |
//+------------------------------------------------------------------+
void OnTick()
  {
//--- Check for a new bar (only one signal per bar)
   if(!IsNewBar())
      return;

//--- Update status
   currentStatus = "WAITING";

//--- Check the trading context
   if(!CheckTradeContext())
      return;

//--- Calculate daily levels
   if(!CalculateDailyLevels())
     {
      currentStatus = "CALC_ERROR";
      UpdateChartInfo();
      return;
     }

//--- Visualize levels (only in live trading)
   if(InpEnableVisuals && !MQLInfoInteger(MQL_TESTER))
      UpdateVisualLevels();

//--- Get current prices
   SymbolInfo.RefreshRates();
   double currentAsk = SymbolInfo.Ask();
   double currentBid = SymbolInfo.Bid();

//--- Get a trading signal
   int signal = GetTradingSignal(currentAsk, currentBid);

//--- Process signal
   switch(signal)
     {
      case 1:  // BUY signal
         ProcessBuySignal(currentAsk);
         break;

      case -1: // SELL signal
         ProcessSellSignal(currentBid);
         break;

      default: // No signal
         lastBuySignal = false;
         lastSellSignal = false;
         currentStatus = "NO_SIGNAL";
         break;
     }

//--- Update chart information
   UpdateChartInfo();
   return;
  }
This function:
- Works ONLY on a new "bar" (candlestick) — protection against multiple entries,
- checks whether trading is possible,
- calculates current levels,
- displays the levels on the chart,
- receives a signal based on the selected strategy,
- executes a trade when a signal is received,
- updates the information panel.
The CalculateDailyLevels() function — calculation of key levels
//+------------------------------------------------------------------+
//| Daily level calculation (key function)                           |
//+------------------------------------------------------------------+
bool CalculateDailyLevels()
  {
//--- Check: Have the levels already been calculated for today?
   datetime today = iTime(_Symbol, PERIOD_D1, 0);
   if(dayLevelsDate == today && dayHighLevel > 0 && dayLowLevel > 0)
      return(true); // The levels are current

//--- Copy high data for the specified number of days
   double highArray[];
   int copiedHigh = CopyHigh(_Symbol, PERIOD_D1, 1, InpDayPeriod, highArray);

//--- Copy the low data for the specified number of days
   double lowArray[];
   int copiedLow = CopyLow(_Symbol, PERIOD_D1, 1, InpDayPeriod, lowArray);

//--- Check whether the data was copied successfully
   if(copiedHigh <= 0 || copiedLow <= 0)
     {
      Print("Error: Insufficient data for level calculation");
      return(false);
     }

//--- Find the highest high and the lowest low over the period
   dayHighLevel = highArray[0];
   dayLowLevel  = lowArray[0];

   for(int i = 1; i < copiedHigh; i++)
     {
      if(highArray[i] > dayHighLevel)
         dayHighLevel = highArray[i];
     }

   for(int i = 1; i < copiedLow; i++)
     {
      if(lowArray[i] < dayLowLevel)
         dayLowLevel = lowArray[i];
     }

//--- Normalize to the correct number of digits
   dayHighLevel = NormalizeDouble(dayHighLevel, _Digits);
   dayLowLevel  = NormalizeDouble(dayLowLevel,  _Digits);
   dayLevelsDate = today;

//--- Log if enabled
   if(InpEnableLogging)
     {
      Print("--- Levels updated: High=" + DoubleToString(dayHighLevel, _Digits) +
            " Low=" + DoubleToString(dayLowLevel, _Digits) +
            " for " + IntegerToString(InpDayPeriod) + " days");
     }

   return(true);
  }
Function:
- checks whether the levels for the current day have already been calculated,
- copies the HIGH and LOW data for the specified number of days,
- finds the MAXIMUM High and the MINIMUM Low for the period,
- saves the levels and the calculation date.
GetTradingSignal() — the system's intelligence: signal generation
int GetTradingSignal(double ask, double bid)
{
   //--- BREAKOUT MODE
   if(breakout_bounce)
     {
      // BREAKOUT: Entry in the direction of the breakout
      bool buySignal = (ask > dayHighLevel);   // Breakout above the high on the daily timeframe
      bool sellSignal = (bid < dayLowLevel);   // A breakout below the low based on data from the daily timeframe

      return ProcessSignal(buySignal, sellSignal, ask, bid, "BREAKOUT");
     }
   else
   //--- BOUNCE MODE
     {
      // BOUNCE: Entry in the opposite direction
      bool buySignal = (bid < dayLowLevel);    // The price has fallen below the low (we expect an upward bounce)
      bool sellSignal = (ask > dayHighLevel);  // The price has risen above the high (we expect a downward bounce)

      return ProcessSignal(buySignal, sellSignal, ask, bid, "BOUNCE");
     }
}
Generates signals based on the selected strategy.
- Defines the selected strategy mode
- For BREAKOUT:
- BUY on a breakout above the high (Ask above the level)
- SELL on a breakout below the low (Bid below the level)
- For BOUNCE:
- BUY if the price falls below the low (expecting an upward bounce)
- SELL if the price rises above the high (expecting a downward bounce)
- Calls ProcessSignal to process the conditions
The ProcessSignal() function — signal processing
//+------------------------------------------------------------------+
//| Process signal                                                   |
//+------------------------------------------------------------------+
int ProcessSignal(bool buyCondition, bool sellCondition, double ask, double bid, string strategy)
  {
   if(buyCondition && sellCondition)
      return(0); // Signal conflict

//--- Process BUY signal
   if(buyCondition && !lastBuySignal)
     {
      totalSignals++;
      lastBuySignal  = true;
      lastSellSignal = false;

      if(InpEnableLogging)
         Print("--- SIGNAL: " + strategy + " BUY | Price: " + DoubleToString(ask, _Digits) +
               " | Level: " + DoubleToString(dayHighLevel, _Digits));

      return(1);
     }

//--- Process SELL signal
   if(sellCondition && !lastSellSignal)
     {
      totalSignals++;
      lastSellSignal = true;
      lastBuySignal  = false;

      if(InpEnableLogging)
         Print("--- SIGNAL: " + strategy + " SELL | Price: " + DoubleToString(bid, _Digits) +
               " | Level: " + DoubleToString(dayLowLevel, _Digits));

      return(-1);
     }

//--- Reset flags if the conditions no longer exist
   if(!buyCondition)
      lastBuySignal = false;
   if(!sellCondition)
      lastSellSignal = false;

   return(0);
  }
This function:
- checks for conflicting signals (simultaneous BUY and SELL),
- prevents duplicate signals via the lastBuySignal and lastSellSignal flags,
- increases the signal counter,
- logs the signal when logging is enabled,
- returns the signal code: 1 = BUY, -1 = SELL, 0 = no signal.
The ProcessBuySignal() function — executing a BUY trade
//+------------------------------------------------------------------+
//| Process BUY signal                                               |
//+------------------------------------------------------------------+
void ProcessBuySignal(double entryPrice)
  {
//--- Close opposite positions (SELL)
   ClosePositionsByType(POSITION_TYPE_SELL);

//--- Check for an existing BUY position
   if(CountPositionsByType(POSITION_TYPE_BUY) > 0)
      return;

//--- Calculate Stop Loss and Take Profit
   double sl = CalculateStopLoss(entryPrice, POSITION_TYPE_BUY);
   double tp = CalculateTakeProfit(entryPrice, POSITION_TYPE_BUY);

//--- Create a trade comment
   string strategyTag = breakout_bounce ? "BREAKOUT" : "BOUNCE";
   string comment = StringFormat("%s_B|D%d|S#%d", strategyTag, InpDayPeriod, totalSignals);

//--- Open position
   currentStatus = strategyTag + "_BUY_PROCESSING";

   if(Trade.Buy(InpLotSize, _Symbol, entryPrice, sl, tp, comment))
     {
      ulong ticket = Trade.ResultOrder();
      totalTrades++;
      currentStatus = strategyTag + "_BUY_OPENED";

      //--- Draw a blue BUY arrow (using the "_" prefix)
      if(InpEnableVisuals && !MQLInfoInteger(MQL_TESTER))
        {
         string arrowName = "_BUY_" + IntegerToString(ticket);

         if(ObjectCreate(0, arrowName, OBJ_ARROW_BUY, 0, TimeCurrent(), entryPrice))
           {
            ObjectSetInteger(0, arrowName, OBJPROP_COLOR, InpBuyArrowColor);
            ObjectSetInteger(0, arrowName, OBJPROP_WIDTH, 2);
            ObjectSetInteger(0, arrowName, OBJPROP_BACK, false);
            ObjectSetInteger(0, arrowName, OBJPROP_SELECTABLE, false);

            Print("--- BLUE BUY arrow drawn: " + arrowName);
           }
        }

      if(InpEnableLogging)
         Print("--- SUCCESS: " + strategyTag + " BUY #" + IntegerToString(ticket) +
               " | Price: " + DoubleToString(entryPrice, _Digits));
     }
   else
     {
      currentStatus = "BUY_ERROR";
      Print("--- Error opening BUY: " + Trade.ResultRetcodeDescription());
     }
   return;
  }
Function:
- closes any opposite positions (SELL), if present,
- checks whether a BUY position is already open,
- calculates the Stop Loss and Take Profit levels,
- generates an informative comment for the trade,
- opens a position using Trade.Buy(),
- draws a blue BUY arrow on the chart,
- logs a successful opening.
UpdateVisualLevels() — visual representation
//+------------------------------------------------------------------+
//| Visualize levels on the chart                                    |
//+------------------------------------------------------------------+
void UpdateVisualLevels()
  {
   if(!InpEnableVisuals)
      return;

//--- High line
   if(ObjectFind(0, highLineName) < 0 || dayHighLevel != ObjectGetDouble(0, highLineName, OBJPROP_PRICE))
     {
      ObjectDelete(0, highLineName);
      if(ObjectCreate(0, highLineName, OBJ_HLINE, 0, 0, dayHighLevel))
        {
         ObjectSetInteger(0, highLineName, OBJPROP_COLOR, InpHighLineColor);
         ObjectSetInteger(0, highLineName, OBJPROP_STYLE, STYLE_DASH);
         ObjectSetInteger(0, highLineName, OBJPROP_WIDTH, 2);
         ObjectSetString(0, highLineName, OBJPROP_TEXT, "Daily High (" + IntegerToString(InpDayPeriod) + "d)");
         ObjectSetInteger(0, highLineName, OBJPROP_BACK, true);
        }
     }

//--- Low line
   if(ObjectFind(0, lowLineName) < 0 || dayLowLevel != ObjectGetDouble(0, lowLineName, OBJPROP_PRICE))
     {
      ObjectDelete(0, lowLineName);
      if(ObjectCreate(0, lowLineName, OBJ_HLINE, 0, 0, dayLowLevel))
        {
         ObjectSetInteger(0, lowLineName, OBJPROP_COLOR, InpLowLineColor);
         ObjectSetInteger(0, lowLineName, OBJPROP_STYLE, STYLE_DASH);
         ObjectSetInteger(0, lowLineName, OBJPROP_WIDTH, 2);
         ObjectSetString(0, lowLineName, OBJPROP_TEXT, "Daily Low (" + IntegerToString(InpDayPeriod) + "d)");
         ObjectSetInteger(0, lowLineName, OBJPROP_BACK, true);
        }
     }
   return;
  }
This function:
- draws a horizontal line at the level of the daily high,
- draws a horizontal line at the daily low,
- automatically updates the lines when the levels change,
- adds labels to the lines.
Visual benefits:
- automatic updates — levels change every day
- good design — clear dotted lines
- informative labels — easy to understand even for beginners
- background rendering — does not interfere with chart analysis
ProcessBuySignal() / ProcessSellSignal() — trading decisions
//+------------------------------------------------------------------+
//| Process SELL signal                                              |
//+------------------------------------------------------------------+
void ProcessSellSignal(double entryPrice)
  {
//--- Close opposite positions (BUY)
   ClosePositionsByType(POSITION_TYPE_BUY);

//--- Check for an existing SELL position
   if(CountPositionsByType(POSITION_TYPE_SELL) > 0)
      return;

//--- Calculate SL and TP
   double sl = CalculateStopLoss(entryPrice, POSITION_TYPE_SELL);
   double tp = CalculateTakeProfit(entryPrice, POSITION_TYPE_SELL);

//--- Create a trade comment
   string strategyTag = breakout_bounce ? "BREAKOUT" : "BOUNCE";
   string comment = StringFormat("%s_S|D%d|S#%d", strategyTag, InpDayPeriod, totalSignals);

//--- Open position
   currentStatus = strategyTag + "_SELL_PROCESSING";

   if(Trade.Sell(InpLotSize, _Symbol, entryPrice, sl, tp, comment))
     {
      ulong ticket = Trade.ResultOrder();
      totalTrades++;
      currentStatus = strategyTag + "_SELL_OPENED";

      //--- Draw a red SELL arrow (using the "_" prefix)
      if(InpEnableVisuals && !MQLInfoInteger(MQL_TESTER))
        {
         string arrowName = "_SELL_" + IntegerToString(ticket);

         if(ObjectCreate(0, arrowName, OBJ_ARROW_SELL, 0, TimeCurrent(), entryPrice))
           {
            ObjectSetInteger(0, arrowName, OBJPROP_COLOR, InpSellArrowColor);
            ObjectSetInteger(0, arrowName, OBJPROP_WIDTH, 2);
            ObjectSetInteger(0, arrowName, OBJPROP_BACK, false);
            ObjectSetInteger(0, arrowName, OBJPROP_SELECTABLE, false);

            Print("--- RED SELL arrow drawn: " + arrowName);
           }
        }

      if(InpEnableLogging)
         Print("--- SUCCESS: " + strategyTag + " SELL #" + IntegerToString(ticket) +
               " | Price: " + DoubleToString(entryPrice, _Digits));
     }
   else
     {
      currentStatus = "SELL_ERROR";
      Print("--- Error opening SELL: " + Trade.ResultRetcodeDescription());
     }
   return;
  }
Smart features of the trading module:
- Automatic closing of opposite positions — risk hedging
- Protection against repeated entries — one position per signal
- Dynamic SL/TP — calculated in points, not prices
- Detailed comments — full history in one click
- Visual markers — arrows for manual verification
UpdateChartInfo() — visual display on the chart
//+------------------------------------------------------------------+
//| Update chart information                                         |
//+------------------------------------------------------------------+
void UpdateChartInfo()
  {
//--- Check and delete arrows for closed positions
   CheckAndDeleteArrows();

//--- Calculate current profit
   double currentProfit = CalculateCurrentProfit();

//--- Create an information panel
   string modeText = breakout_bounce ? "BREAKOUT" : "BOUNCE";
   string profitText = (currentProfit >= 0) ?
                       "Profit: +$" + DoubleToString(currentProfit, 2) :
                       "Loss: -$"  + DoubleToString(MathAbs(currentProfit), 2);

   string info =
      "╔═══════════ " + modeText + " v6.5 (PARDO) ═══════════╗\n" +
      "║ Status: " + currentStatus + "\n" +
      "║ Time: " + TimeToString(TimeCurrent(), TIME_SECONDS) + "\n" +
      "║ Magic: " + IntegerToString(InpMagicNumber) + "\n" +
      "╠═════════════════════════════════════════════════════╣\n" +
      "║ TRADING LEVELS (LAST " + IntegerToString(InpDayPeriod) + " DAYS):\n" +
      "║ • Daily High: " + DoubleToString(dayHighLevel, _Digits) + "\n" +
      "║ • Daily Low:  " + DoubleToString(dayLowLevel,  _Digits) + "\n" +
      "╠═════════════════════════════════════════════════════╣\n" +
      "║ STATISTICS:\n" +
      "║ • Signals: " + IntegerToString(totalSignals) + "\n" +
      "║ • Trades:  " + IntegerToString(totalTrades) + "\n" +
      "║ • Open:    " + IntegerToString(CountPositions()) + "\n" +
      "╠═════════════════════════════════════════════════════╣\n" +
      "║  " + profitText + "\n" +
      "╠═════════════════════════════════════════════════════╣\n" +
      "║ SIGNALS FOR " + modeText + " MODE:\n" +
      "║ • " + (breakout_bounce ? "BUY:  Ask > Daily High (BREAKOUT ↑)" : "BUY:  Bid < Daily Low (BOUNCE ↑)") + "\n" +
      "║ • " + (breakout_bounce ? "SELL: Bid < Daily Low (BREAKOUT ↓)" : "SELL: Ask > Daily High (BOUNCE ↓)") + "\n" +
      "║ • ARROWS: BLUE = BUY, RED = SELL\n" +
      "╚═════════════════════════════════════════════════════╝";

   Comment(info);
   return;
  }
It:
- calls CheckAndDeleteArrows() to clear the chart,
- calculates the current profit/loss for open positions,
- creates an attractive framed information panel,
- displays status, time, levels, statistics, and profit,
- displays the entry conditions for the current mode,
- updates the information on each bar.
Information panel:
- System mode — BREAKOUT or BOUNCE is visible at a glance
- Key Levels — Current DayHigh/DayLow
- Statistics — Signals, Trades, Open Positions
- Time and Magic Number — Full Control
- Beautiful Design — Pseudographic Symbols
The OnDeinit() function — complete cleanup
//+------------------------------------------------------------------+
//| Expert deinitialization function                                 |
//+------------------------------------------------------------------+
void OnDeinit(const int reason)
  {
//--- Remove main graphical objects (level lines)
   if(ObjectFind(0, highLineName) >= 0)
      ObjectDelete(0, highLineName);
   if(ObjectFind(0, lowLineName) >= 0)
      ObjectDelete(0, lowLineName);

//--- Remove ALL objects with the "_" prefix (arrows)
   DeleteAllObjectsWithUnderscore();

//--- Display final statistics
   PrintFinalStats(reason);
   return;
  }
Removes the horizontal level lines and also calls DeleteAllPardoObjects() to delete all arrows and displays detailed final performance statistics.
The DeleteAllObjectsWithUnderscore() function — bulk deletion
//+------------------------------------------------------------------+
//| Delete all objects with the "_" prefix                           |
//+------------------------------------------------------------------+
void DeleteAllObjectsWithUnderscore()
  {
   int totalObjects = ObjectsTotal(0);
   int deleted = 0;

   for(int i = totalObjects - 1; i >= 0; i--)
     {
      string objName = ObjectName(0, i);

      //--- Look for objects containing "_"
      if(StringFind(objName, "_") >= 0)
        {
         ObjectDelete(0, objName);
         deleted++;
        }
     }

   if(InpEnableLogging && deleted > 0)
      Print("--- Objects with '_' deleted: " + IntegerToString(deleted));
   return;
  }
The function iterates through all objects on the chart, finds objects with the "_" prefix and deletes them (arrows and lines), and logs the number of deleted objects.
Features and Benefits of the Expert Advisor (EA)
| Characteristic | Description |
|---|---|
| Two strategies in one | Switching a single variable between breakout and bounce |
| Level visualization | Automatic drawing of key levels on the chart |
| Colored arrows | Blue = BUY, Red = SELL, linked to tickets |
| Automatic arrow cleanup | Arrows are removed when positions are closed |
| Information panel | All trading data on the chart |
| Spam protection | Only one signal per bar |
| Works on any timeframe | From M1 upward |
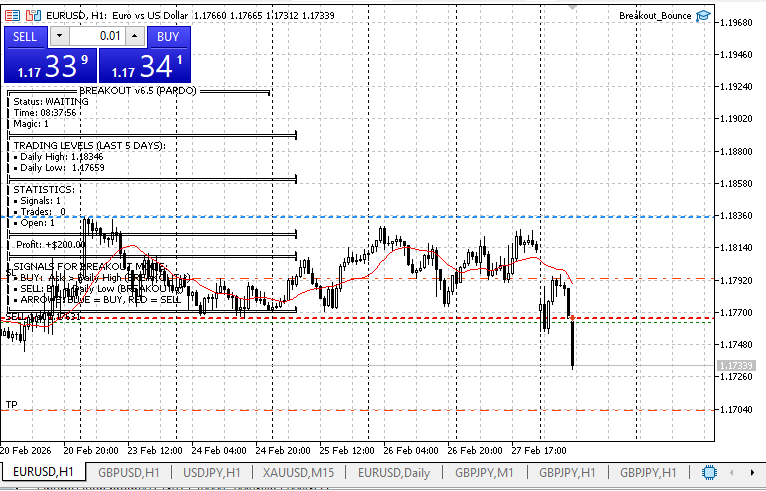
The operation of the Expert Advisor (EA), with detailed comments, is shown in the following figure (the blue and red horizontal levels are the price breakout levels for entering a position):
Testing and Optimizing a Trading System Using the Robert Pardo Method
The optimization technique is relatively simple, but it requires care. It includes five elements: selecting parameters, setting their ranges, determining the sample size, choosing the model evaluation method, and defining the final testing criterion.
Only relevant parameters should be used in optimization. If a parameter's effect is insignificant, it is best to fix it or exclude it. When the significance of a parameter is unknown, it is tested by scanning a range: significant changes in performance indicate importance, while minor changes indicate that the parameter is of secondary importance.
Optimization begins with selecting key variables and defining appropriate ranges. It is also important to select a sufficient amount of data to cover a range of market conditions and to use an appropriate method for assessing the model's stability.
To verify its generalizability, the model is tested across different markets: the broader the coverage, the greater its stability and statistical reliability. Models that operate in only one market raise doubts unless they were specifically designed for that market. Testing is also conducted across different timeframes.
Market conditions are constantly changing — trends, volatility, and liquidity. If the model performs inconsistently across different periods, this may indicate either unfavorable conditions or shortcomings in the model.
Forward Test
The forward test consists of two stages. First, optimization is performed, and the best parameters are selected. They are then tested on a new data segment, which simulates real trading.
Thus, the model is trained on one historical data segment and tested on another. This is out-of-sample testing that allows its effectiveness to be evaluated objectively.
The size of the optimization window is determined empirically. The model's validity period is influenced by volatility, the structure of trends, and the model's completeness. Typically, a model trained on two years of data remains effective for 3–6 months; one trained on one year of data remains effective for 1–2 months; and one trained on six months of data remains effective for 2–4 weeks.
The forward window is typically 10–20% of the optimization period.
Optimization in the Strategy Tester — From Chaos to Order
Next, a similarly rigorous test should be applied to the selected instruments from the test basket across various market sectors. After that, you can evaluate the overall results.
If the forward analysis across the entire set of tests proves unprofitable, you should check the testing structure for errors. If errors are found, they should be corrected and the analysis repeated. If there are no errors, however, the model should be discarded— its previous results were due to optimization, and the model itself is unstable.
If the forward analysis shows only barely acceptable profitability, you should also verify that the test was conducted correctly. If errors are found, they must be corrected and the analysis repeated. If there are no errors, poor results indicate that the model is of mediocre quality. Nevertheless, its characteristics can be useful as part of a diversified portfolio.
If a forward analysis of the entire basket of markets or part of it shows solid profitability, the model can be considered viable. It has passed one of the most rigorous verification stages and can be used in trading, while still exercising the necessary caution.
So, let's move on to the most interesting part of this process — optimizing the values of the trading parameters of external variables.
Recommendations for Optimization
| Parameter | Range | Step | Explanation |
|---|---|---|---|
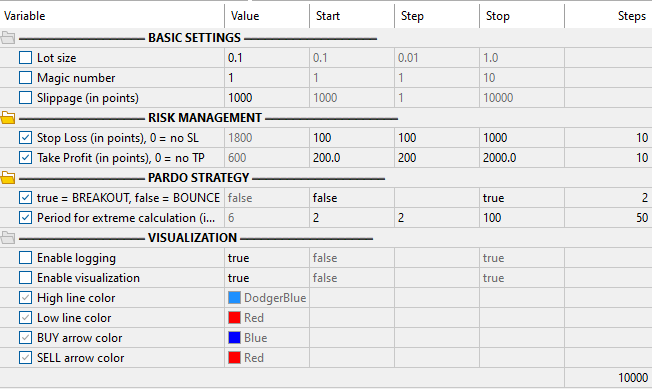
| InpDayPeriod | 2–60 | 2 | Number of days for searching for levels (step 2 to speed up optimization) |
| InpStopLoss | 100–1,000 | 100 | Stop Loss in points (for 5-digit quotes = 10–100 pips) |
| InpTakeProfit | 200–2,000 | 200 | Take Profit in points (1:2 ratio to SL) |
| breakout_bounce | true / false | - | We test the two modes separately |
Below are three testing periods with overlapping time windows. The goal is to practice optimization and forward validation, and to select the best optimization run. If necessary, the number of periods can be increased to 10. To work through this more thoroughly, this example uses 3 periods:
| Period | Optimization (In-Sample) | Forward (Out-of-Sample) |
|---|---|---|
| 1 | January 1, 2020 – December 31, 2023 (48 months) | January 1, 2024 – December 31, 2024 (25%) |
| 2 | January 1, 2021 – December 31, 2024 (48 months) | January 1, 2025 – December 31, 2025 (25%) |
| 3 | January 1, 2022 – December 31, 2025 (48 months) | January 1, 2026 – March 31, 2026 (through the current date, no more than 25%) |
Now that we have the variable map and the calendar, we will perform the actual optimization.
STEP 1: Preparation
- Make sure the Expert Advisor (EA) is compiled and located in the MQL5/Experts/Advisors folder; select the Expert Advisor (EA), trading symbol,
- Open the Strategy Tester (Ctrl+R)
- Select a symbol, timeframe, and date range
STEP 2: Configuring Testing
Mode: “Open prices only.” Timeframe: M15/H1. Range: the past 1–2 years. Deposit: 10,000 USD. Optimization criteria: profitability (total profit), profit factor (Profit Factor > 1.5), maximum drawdown (< 20%), number of trades (at least 100 for statistical purposes), average profit per trade.
Validation of Results. In-sample optimization: 70% of the data; out-of-sample test: up to 20–30% of recent data; forward testing: on current data; testing on different symbols: EURUSD, GBPUSD, XAUUSD; testing on different timeframes: M15, H1, H4.
Selecting a “plateau” variant of the variable values is a key step after optimizing a trading approach and is the optimization goal for further use in trading, as shown in the figure:
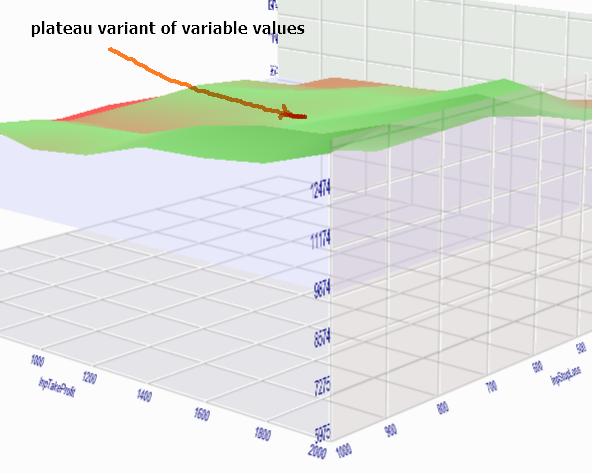
The optimization is as follows:
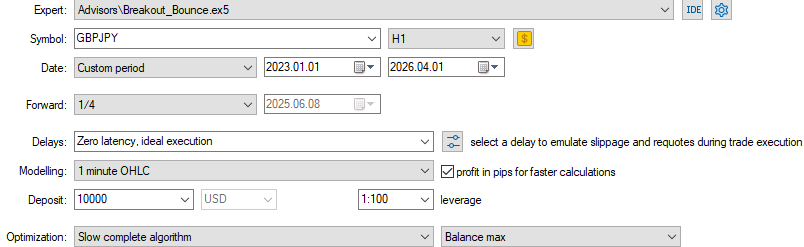
The optimization and testing reports are included in the attached archives.
The Strategy Tester in MetaTrader 5 provides a unique opportunity to perform forward testing using predefined portions of the total period. You can set asymmetric entry conditions. For example: for BUY, a breakout above the 25-day high; for SELL, a breakout below the 5-day low.
I performed the optimization using the following step sizes and settings:
Model shelf life
The size of the test window has a significant impact on the “lifespan” of a trading system. Systems that use optimization require periodic re-optimization to adapt to current market conditions. At the same time, models optimized over longer timeframes generally remain functional for longer. By contrast, systems with a short test window require more frequent re-optimization and are less robust.
Typically, the interval between re-optimizations is a fraction of the test window length. A rule of thumb is between 1/8 and 1/4. For example, with an optimization window of 24 months, the system can operate effectively for 3 to 6 months.
This is because the market is constantly changing. The farther away from the optimization point, the less reliable the forecasts are. If conditions remain stable, re-optimization may not be necessary, but in practice this almost never happens.
A short testing window covers a limited range of market conditions. This model works well only in a familiar environment and loses its effectiveness when market conditions change, so it requires frequent readjustment. A long window, on the other hand, incorporates a wider range of market conditions, allowing the model to adapt better to new conditions and remain relevant for longer.
In summary: short windows result in more sensitive but less stable systems; long windows result in more stable but less responsive systems. Optimization is the process of improving efficiency, and it is precisely a sound approach to optimization that distinguishes a successful trader from a casino gambler.
Conclusion
The algorithm for development, testing, and optimization described here is a practical guide, not a theoretical concept. The result should not be some abstract “improvement,” but rather specific artifacts and decisions:
- a set of working files (indicator + Expert Advisor(s)) with documented entry/exit and risk management rules;
- a test plan for the MetaTrader 5 Strategy Tester: a list of variables to be optimized and their ranges, rules for splitting the historical data (IS/OOS), selection criteria (e.g., Profit Factor, maximum drawdown, minimum number of trades), and the method for selecting a plateau;
- a forward validation procedure and decision table: when the model is considered valid, when it requires re-optimization, and how often to re-optimize (as a guideline — 1/8 to 1/4 of the optimization window length);
- practical recommendations for multi-symbol and multi-timeframe testing to improve statistical validity.
Key cautions: avoid over-optimization, do not rely on a single “best” run, test the model across different markets and in forward testing, and always test on demo or controlled accounts before moving to live trading. This methodology provides a structured path from an idea to a reproducible, measurable, and adaptable trading system.
The material and code are provided for educational purposes. Be sure to perform testing before using them on live accounts. Trading involves risks.
| File name | Description |
|---|---|
| Templates_sets_reports.zip | Strategy Tester reports and set files containing the Expert Advisor's parameter values |
| PardoSystem.mq5 | Indicator based on R. Pardo's trading method |
| Breakout_Bounce.mq5 | Expert Advisor (EA) for level breakout/bounce trading conditions |
| PardoEA.mq5 | Expert Advisor (EA) based on R. Pardo's Method |
Translated from Russian by MetaQuotes Ltd.
Original article: https://www.mql5.com/ru/articles/19520
Warning: All rights to these materials are reserved by MetaQuotes Ltd. Copying or reprinting of these materials in whole or in part is prohibited.
This article was written by a user of the site and reflects their personal views. MetaQuotes Ltd is not responsible for the accuracy of the information presented, nor for any consequences resulting from the use of the solutions, strategies or recommendations described.

 Practical Modules from Other Languages in MQL5 (Part 08): MATPLOTLIB
 Master the Z-Score: Building Mean-Reverting MQL5 Trading Systems
 Price Action Analysis Toolkit Development (Part 82): Annotating Historical Bookmarks with Reliable Timeframe Switching
 Larry Williams Market Secrets (Part 18): Automating the Greatest Swing Value Breakout Strategy in MQL5

- Free trading apps
- Over 8,000 signals for copying
- Economic news for exploring financial markets
You agree to website policy and terms of use
It says:
Существует два подхода к созданию торговой системы. Первый подход использует логику...
Where is the second attempt? I haven’t even seen a mention of it.
Written:
Where’s the second attempt? I haven’t even seen a mention of it.
So where’s the nice picture showing the result of the test run/tuning))?
) (that’s the key bit)
Let’s keep this in the discussions – it doesn’t fit the narrative, but these are positive findings for real trading!