
The Magic of Filtration

Introduction
Most of the developers of automated trading systems (ATS), one way or another, use some form of signals filtering. Although it isn't the only way to improve the system characteristics, it is considered most effective. Beginner "grail-builders" often fall to the magic of the filters. It's very simple to take some trading strategy, hang a dozen of filters on it, and here it is, - a profitable Expert Advisor.
However, there are opponents of the use of filters. Filters significantly (sometimes 2-3 times) reduce the number of deals, and there is no guarantee that in the future they will be as effective as in the past. Certainly, there are also some other compelling reasons.
So let us take a further look and consider all of this one step at a time.
The hypothesis of the meaninglessness of filtering
If the Expert Advisor is unprofitable ("drainer"), it is unlikely that some type of filtration will help,- the magic of filtering is powerless here.
Therefore, in this article, these Expert Advisors will not be considered. Although, we must know that there are studies of quantum-frequency filters, capable of turning virtually any "drainer" into a pseudo-Grail.
Hypothesis of the dangers of filtering
If the Expert Advisor in its characteristics is approaching an ideal Automated Trading System, then filtering will only worsen it.
We should clarify what is meant by an ideal automated trading system. By this is meant such a trading strategy, which generates only profitable transaction, ie does not bring any losses. In such a system, the number of unprofitable trades = 0.
What is a filter?
In its simplest form, a trading signal filter is a logical restriction such as: if A is not less than B (A> = B), then the signal is skipped, and if it is smaller (A <B) - then it is not.As a result a part of the signals is eliminated. The terms of filtration are established by the developer of the trading robot. In order to establish some types of trends, we need to analyze the influence of various factors on the characteristics of ATS. And there are a great variety of such factors. Therefore we must turn to out intuition in order to choose the most relevant and consistent ones.
An example.There may be a correlation between the results of ATS trading and atmospheric pressure in the village of Kukushkino, ie You can create an appropriate filter and improve the profitability of the Expert Advisor, which will take into account the weather in this small Russian town. However, it is unlikely that someone would appreciate such an innovative approach to filtering, in spite of the fact that it could raise the profitablity of the system.
Classification of filters
Although there is a great variety of filters used in ATS, they can still be divided into two main classes:
- bandpass filter (P-filter) - transmits a band of signals;
- discrete filter (D-filter) - selective transmission of signals by the mask (template).
Where to start?
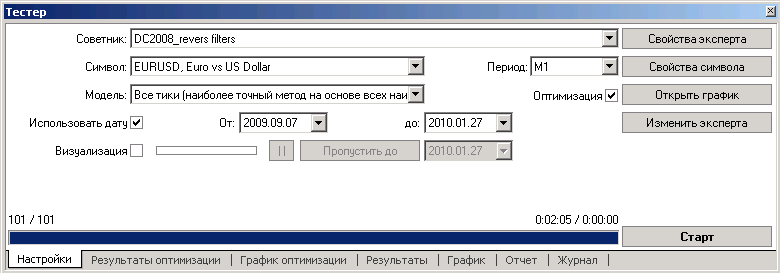
Let's consider the filtering mechanism by looking at an example. let's use the DC2008_revers Expert Advisor (see attached file), which was specially developed for this article, and explore its features (without using any filters). Here is the report obtained during testing.
Report
| Symbol | EURUSD (Euro vs US Dollar) | ||||
| Period | 1 Minute (M1) 2009.09.07 00:00 - 2010.01.26 23:59 (2009.09.07 - 2010.01.27) | ||||
| Model | All ticks (the most accurate method based on all of the least available timeframes) | ||||
| Parameters | Lots = 0.1; Symb.magic = 9001; nORD.Buy = 5; nORD.Sell = 5; | ||||
| Bars in the history | 133967 | Modeled ticks | 900848 | Quality of Modeling | 25.00% |
| Mismatched traffic errors | 0 | ||||
| Initial deposit | 10000.00 | ||||
| Net profit | 4408.91 | Gross profit | 32827.16 | Gross loss | -28418.25 |
| Profitability | 1.16 | Expected payoff | 1.34 | ||
| Absolute drawdown | 273.17 | Maximum drawdown | 3001.74 (20.36%) | Relative drawdown | 20.36% (3001.74) |
| Total transactions | 3284 | Short positions (won%) | 1699 (64.98%) | Long positions (won%) | 1585 (65.68%) |
| Profitable trades (% of total) | 2145 (65.32%) | Losing trades (% of total) | 1139 (34.68%) | ||
| Largest | profitable trade | 82.00 | losing trade | -211.00 | |
| Average | profitable trade | 15.30 | losing trade | -24.95 | |
| Maximum Number | consecutive wins (profit) | 29 (679.00) | consecutive losses (loss) | 16 (-290.34) | |
| Maximum | consecutive profit (count of wins) | 679.00 (29) | consecutive loss (count of losses) | -1011.00 (10) | |
| Average | consecutive win | 5 | consecutive loss | 3 | |

Figure 1. History Backtesting results. Initial Expert Advisor without filters
Result Analyses:
- The Expert Advisor is profitable and winning trades make up more than 60% - that's good.
- A maximum drawdown of 20% of the deposit and more than $ 3000 with a minimum lot size - is bad.
- Total number of transactions is sufficient enough for the use of filtering (> 3000).
Of course, these conclusions are relevant only for the currently given period of history. We don't know how the Expert Advisor will trade at a different location. However, this can not prevent us from making changes to its characteristics using filtering.
Therefore, for this Expert Advisor, we can try finding filters which will improve profitability and reduce drawdown.
Bandpass filter (P-filter)
This is one of the most common and simple filters, because the result can be evaluated immediately after testing and without any additional processing. Consider the possible options for using it in the tested Expert Advisor. As one of the parameters, let's use the skipping band, and compare the price of opening the bar to the closing price at different time periods.
H4 Period
   //+---------------------------------------------------------------------------------+
   //   BUY Signals
   //+---------------------------------------------------------------------------------+
   if(true
      && High[0]<iLow(NULL,PERIOD_H1,1)
      && ORD.Buy<nORD.Buy
   //.........................................Filters...................................
      && iOpen(NULL,PERIOD_H4,1)<iClose(NULL,PERIOD_H4,1)
      )
   {
   //----
      Signal.Buy=true;
   }
   //+---------------------------------------------------------------------------------+
   //   SELL Signals
   //+---------------------------------------------------------------------------------+
   if(true
      && Low[0]>iHigh(NULL,PERIOD_H1,1)
      && ORD.Sell<nORD.Sell
   //.........................................Filters...................................
      && iOpen(NULL,PERIOD_H4,1)>iClose(NULL,PERIOD_H4,1)
      )
   {
   //----
      Signal.Sell=true;
   }
")
Figure 2. History
Backtesting results. Expert Advisor with P-filter (H4 period)
Period H1
   //+---------------------------------------------------------------------------------+
   //   BUY Signal
   //+---------------------------------------------------------------------------------+
   if(true
      && High[0]<iLow(NULL,PERIOD_H1,1)
      && ORD.Buy<nORD.Buy
   //.........................................Filters...................................
      && iOpen(NULL,PERIOD_H1,1)>iClose(NULL,PERIOD_H1,1)
      )
   {
   //----
      Signal.Buy=true;
   }
   //+---------------------------------------------------------------------------------+
   //   SELL Signal
   //+---------------------------------------------------------------------------------+
   if(true
      && Low[0]>iHigh(NULL,PERIOD_H1,1)
      && ORD.Sell<nORD.Sell
   //.........................................Filters...................................
      && iOpen(NULL,PERIOD_H1,1)<iClose(NULL,PERIOD_H1,1)
      )
   {
   //----
      Signal.Sell=true;
   }
")
Figure 3. History
Backtesting results. Expert Advisor
with P-filter (H1 period)
M30 Period
   //+---------------------------------------------------------------------------------+
   //  BUY Signals
   //+---------------------------------------------------------------------------------+
   if(true
      && High[0]<iLow(NULL,PERIOD_H1,1)
      && ORD.Buy<nORD.Buy
   //.........................................Filters...................................
      && iOpen(NULL,PERIOD_M30,1)<iClose(NULL,PERIOD_M30,1)
      )
   {
   //----
      Signal.Buy=true;
   }
   //+---------------------------------------------------------------------------------+
   //   SELL Signals
   //+---------------------------------------------------------------------------------+
   if(true
      && Low[0]>iHigh(NULL,PERIOD_H1,1)
      && ORD.Sell<nORD.Sell
   //.........................................Filters...................................
      && iOpen(NULL,PERIOD_M30,1)>iClose(NULL,PERIOD_M30,1)
      )
   {
   //----
      Signal.Sell=true;
   }
")
Figure 4. History
Backtesting results. Expert Advisor
with P-filter (M30 period)
Period M5
   //+---------------------------------------------------------------------------------+
   //   BUY Signals
   //+---------------------------------------------------------------------------------+
   if(true
      && High[0]<iLow(NULL,PERIOD_H1,1)
      && ORD.Buy<nORD.Buy
   //.........................................Filters...................................
      && iOpen(NULL,PERIOD_M5,1)<iClose(NULL,PERIOD_M5,1)
      )
   {
   //----
      Signal.Buy=true;
   }
   //+---------------------------------------------------------------------------------+
   //   SELL Signals
   //+---------------------------------------------------------------------------------+
   if(true
      && Low[0]>iHigh(NULL,PERIOD_H1,1)
      && ORD.Sell<nORD.Sell
   //.........................................Filters...................................
      && iOpen(NULL,PERIOD_M5,1)>iClose(NULL,PERIOD_M5,1)
      )
   {
   //----
      Signal.Sell=true;
   }

Fig.5 Schedule of balance changes.P-filter for the M5 period
To make the analysis of the received reports easier, they are summarized in the following table.
| No filtering | PERIOD_H4 | PERIOD_H1 | PERIOD_M30 | PERIOD_M5 | |
|---|---|---|---|---|---|
| Initial deposit | 10000.00 | 10000.00 | 10000.00 | 10000.00 | 10000.00 |
| Net profit | 4408.91 | 4036.33 | 4829.05 | 3852.90 | 4104.30 |
| Gross profit | 32827.16 | 19138.74 | 27676.50 | 18133.77 | 23717.68 |
| Gross loss | -28418.25 | -15102.41 | -22847.45 | -14280.87 | -19613.38 |
| Profitability | 1.16 | 1.27 | 1.21 | 1.27 | 1.21 |
| Expected payoff | 1.34 | 2.92 | 2.20 | 3.59 | 2.02 |
| Absolute drawdown | 273.17 | 434.09 | 762.39 | 64.00 | 696.23 |
| Maximum drawdown | 3001.74 (20.36%) | 2162.61 (17.48%) | 2707.56 (17.22%) | 2121.78 (16.38%) | 1608.30 (12.46%) |
| Relative drawdown | 20.36% (3001.74) | 17.48% (2162.61) | 17.22% (2707.56) | 16.38% (2121.78) | 12.46% (1608.30) |
| Total transactions | 3284 | 1383 | 2195 | 1073 | 2035 |
| Short positions (won%) | 1699 (64.98%) | 674 (54.01%) | 1119 (60.59%) | 547 (60.51%) | 1046 (63.48%) |
| Long positions (won%) | 1585 (65.68%) | 709 (62.48%) | 1076 (64.96%) | 526 (64.64%) | 989 (66.63%) |
| Profit trades (% of total) | 2145 (65.32%) | 807 (58.35%) | 1377 (62.73%) | 671 (62.53%) | 1323 (65.01%) |
| Losing trades (% of total) | 1139 (34.68%) | 576 (41.65%) | 818 (37.27%) | 402 (37.47%) | 712 (34.99%) |
| Largest | |||||
| profitable trade | 82.00 | 201.00 | 157.00 | 204.00 | 97.00 |
| losing trade | -211.00 | -136.00 | -160.00 | -179.51 | -156.00 |
| Average | |||||
| profitable trade | 15.30 | 23.72 | 20.10 | 27.02 | 17.93 |
| losing trade | -24.95 | -26.22 | -27.93 | -35.52 | -27.55 |
| Maximum Number | |||||
| consecutive wins (profit) | 29 (679.00) | 27 (817.98) | 36 (1184.32) | 36 (1637.38) | 44 (912.03) |
| consecutive losses (loss) | 16 (-290.34) | 12 (-636.34) | 13 (-367.07) | 14 (-371.51) | 15 (-498.51) |
| Maximum | |||||
| consecutive profit (count of wins) | 679.00 (29) | 884.08 (16) | 1184.32 (36) | 1637.38 (36) | 912.03 (44) |
| consecutive loss (count of losses) | -1011.00 (10) | -686.00 (10) | -758.00 (7) | -894.85 (10) | -589.00 (5) |
| Average | |||||
| consecutive wins | 5 | 5 | 5 | 5 | 4 |
| consecutive losses | 3 | 3 | 3 | 3 | 2 |
Table 1. Comparison table of test reports for P-filter
Analysis of results:
- Net income increased only in the P-filter "PERIOD_H1" (4408.91 => 4829.05).
- The leader for Expected payoff was the P-filter "PERIOD_M30" (1.34 => 3.59).
- The maximum drawdown decreased in all filters. The minimum value of drawdown resulted in "PERIOD_M5" (3001.74 => 1608.30) filter.
- Filtering reduced the total number of transactions by 1,5-3 times.
CONCLUSIONS
- The P-filter can improve the ATS characteristics.
- For further analysis, we will choose the P-filter "PERIOD_H1", which demonstrated the best profit results.
Discrete filter (D-filter)
The simplest and most intuitively understood discrete filter is trading by the hour. It's reasonable to assume that during the day a trading Expert Advisor is unstable in trading. During certain hours it's more profitable, and during others can be the opposite, and bring only losses. For this purpose, let's study the influence of this filter on the results of trade. An additional external variable must be included into the expert code beforehand:
extern int        Filter.Hour=0;    // D-filter: trade by hour
//----
extern double     Lots=0.1;
extern int        Symb.magic=9001,
                  nORD.Buy = 5,     // max buy orders
                  nORD.Sell = 5;    // max sell orders
And the filter itself:
   //+---------------------------------------------------------------------------------+
   //   BUY Signals
   //+---------------------------------------------------------------------------------+
   if(true
      && High[0]<iLow(NULL,PERIOD_H1,1)
      && ORD.Buy<nORD.Buy
   //.........................................Filters...................................
      && Hour()==Filter.Hour
      )
   {
   //----
      Signal.Buy=true;
   }
   //+---------------------------------------------------------------------------------+
   //   SELL Signals
   //+---------------------------------------------------------------------------------+
   if(true
      && Low[0]>iHigh(NULL,PERIOD_H1,1)
      && ORD.Sell<nORD.Sell
   //.........................................Filters...................................
      && Hour()==Filter.Hour
      )
   {
   //----
      Signal.Sell=true;
   }
So, if the current hour coincides with the discrete value of the D-filter, then we generate (allow) the signal to buy or sell, otherwise - we do not.
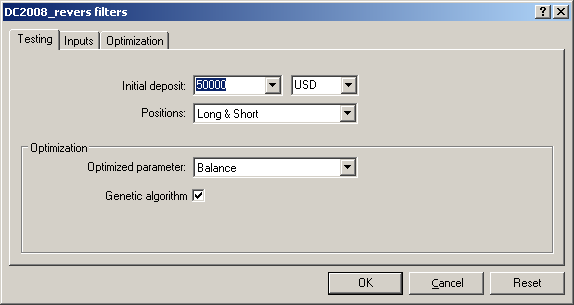
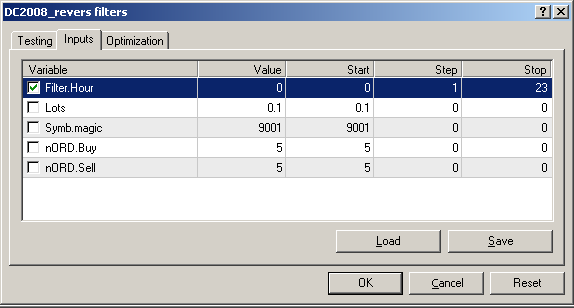
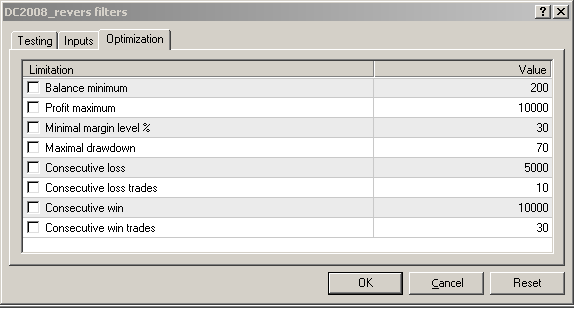
We launch the tester in the optimized mode (input parameters are indicated in the pictures). The deposit must be specified as a maximum to avoid the situation of - "not enough money to open a position" and not to lose part of a transactions.
Figure 6. Input parameters for the search of the D-filter characteristics
As a result we obtain the characteristic of the filter's response: profit, number of transactions and drawdown (axis Y) as a function of the time of the day (axis X).

Figure 7. Characteristics of the filter's response. D-filtering by the hour
So our assumption that the Expert Advisor brings different profit at different times has confirmed!
... And so it has confirmed, but what do we now do with this? The first thing that comes to mind is to disallow the Expert Advisor to trade during the hours when it brings only losses. This seems logical.Well, thenwe will alter the D-filter, by permitting it to trade only during profitable hours. In other words - we will create a filter mask. Now we can plug the finalized D-filter into the code and view the test report.
   //+---------------------------------------------------------------------------------+
   //   BUY Signals
   //+---------------------------------------------------------------------------------+
   if(true
      && High[0]<iLow(NULL,PERIOD_H1,1)
      && ORD.Buy<nORD.Buy
   //.........................................Filters...................................
      && (Hour()==0
         || Hour()==6
         || Hour()==9
         || Hour()==10
         || Hour()==11
         || Hour()==12
         || Hour()==18
         || Hour()==20
         || Hour()==22
         || Hour()==23
         )
      )
   {
   //----
      Signal.Buy=true;
   }
   //+---------------------------------------------------------------------------------+
   //   SELL Signals
   //+---------------------------------------------------------------------------------+
   if(true
      && Low[0]>iHigh(NULL,PERIOD_H1,1)
      && ORD.Sell<nORD.Sell
   //.........................................Filters...................................
      && (Hour()==0
         || Hour()==6
         || Hour()==9
         || Hour()==10
         || Hour()==11
         || Hour()==12
         || Hour()==18
         || Hour()==20
         || Hour()==22
         || Hour()==23
         )
      )
   {
   //----
      Signal.Sell=true;
   }
| Symbol | EURUSD (Euro vs US Dollar) | ||||
| Period | 1 Minute (M1) 2009.09.07 00:00 - 2010.01.26 23:59 (2009.09.07 - 2010.01.27) | ||||
| Model | Every tick (the most accurate method based on all available least timeframes) | ||||
| Parameters | Filter.Hour = 0; Lots = 0.1; Symb.magic = 9001; nORD.Buy = 5; nORD.Sell = 5; | ||||
| Bars in history | 133967 | Modeled ticks | 900848 | Modeling Quality | 25.00% |
| Mismatched graphs errors | 0 | ||||
| Initial deposit | 10000.00 | ||||
| Net profit | 6567.66 | Gross profit | 24285.30 | Gross loss | -17717.64 |
| Profitability | 1.37 | Expected payoff | 4.13 | ||
| Absolute drawdown | 711.86 | Maximum drawdown | 3016.21 (18.22%) | Relative drawdown | 18.22% (3016.21) |
| Total transactions | 1590 | Short positions (won%) | 832 (61.30%) | Long positions (won%) | 758 (63.85%) |
| Profit trades (% of total) | 994 (62.52%) | Losing trades (% of total) | 596 (37.48%) | ||
| Largest | profitable trade | 194.00 | losing trade | -161.00 | |
| Average | profitable trade | 24.43 | losing trade | -29.73 | |
| Maximum Number | consecutive wins (profit) | 40 (1096.16) | consecutive losses (loss) | 15 (-336.45) | |
| Maximum | consecutive profit (count of wins) | 1289.08 (20) | consecutive loss (count of losses) | -786.51 (8) | |
| Average | consecutive wins | 5 | consecutive losses | 3 | |

Figure 8. Balance chart. D-filter by the hour
Analysis of filtration results:
- Drawdown Reduction - not achieved. It did not diminished, but even slightly increased (3001.74 => 3016.21)!?
- Net income increased by approximately 50% (4408.91 => 6567.66). This is, but the number of transactions with decreased almost in 2 times (3284 => 1590).
- Expected profit of D-filter (4.13) is higher than the best value of all of the investigated P-filters (3.59).
- The number of profitable transactions declined (64.98% => 62.52%)., i.e. the filter eliminated not only unprofitable, but also a number of profitable transactions.
CONCLUSIONS
- Discrete filtering can be more effective than P-filtering, but it requires more fine tuning and a selection of optimum input conditions.
Filtering signals using two or more filters
It is not always possible to achieve significant performance improvement of ATS, using only one filter. It is more common to set up several filters instead. Thus we are faced with the question of how to merge these filters.
For the purpose of this study, we will take the above filters, and to simplify matters label them the following way: filter № 1 (P-filter "PERIOD_H1") and filter number 2 (D-filter). Initially we will merge them by simple addition. To do this we will change the Expert Advisor's code.
   //+---------------------------------------------------------------------------------+
   //   BUY Signals
   //+---------------------------------------------------------------------------------+
   if(true
      && High[0]<iLow(NULL,PERIOD_H1,1)
      && ORD.Buy<nORD.Buy
   //.........................................Filters...................................
      //---- filter №1
      && iOpen(NULL,PERIOD_H1,1)>iClose(NULL,PERIOD_H1,1)
      //---- filter №2
      && (Hour()==0
         || Hour()==6
         || Hour()==9
         || Hour()==10
         || Hour()==11
         || Hour()==12
         || Hour()==18
         || Hour()==20
         || Hour()==22
         || Hour()==23
         )
      )
   {
   //----
      Signal.Buy=true;
   }
   //+---------------------------------------------------------------------------------+
   //   SELL Signals
   //+---------------------------------------------------------------------------------+
   if(true
      && Low[0]>iHigh(NULL,PERIOD_H1,1)
      && ORD.Sell<nORD.Sell
   //.........................................Filters...................................
      //---- filter №1
      && iOpen(NULL,PERIOD_H1,1)<iClose(NULL,PERIOD_H1,1)
      //---- filter №2
      && (Hour()==0
         || Hour()==6
         || Hour()==9
         || Hour()==10
         || Hour()==11
         || Hour()==12
         || Hour()==18
         || Hour()==20
         || Hour()==22
         || Hour()==23
         )
      )
   {
   //----
      Signal.Sell=true;
   }
Then we test the created combination of filters and as a result we obtain the following report.
Balance
| Symbol | EURUSD (Euro vs US Dollar) | ||||
| Period | 1 Minute (M1) 2009.09.07 00:00 - 2010.01.26 23:59 (2009.09.07 - 2010.01.27) | ||||
| Model | All ticks (the most accurate method based on all of the least available timeframes) | ||||
| Parameters | Lots = 0.1; Symb.magic = 9001; nORD.Buy = 5; nORD.Sell = 5; | ||||
| Bars in history | 133967 | Modeled ticks | 900848 | Modeling Quality | 25.00% |
| Mismatched graphs errors | 0 | ||||
| Initial deposit | 10000.00 | ||||
| Net profit | 6221.18 | Gross profit | 20762.67 | Gross loss | -14541.49 |
| Profitability | 1.43 | Expected payoff | 5.47 | ||
| Absolute drawdown | 1095.86 | Maximum drawdown | 3332.67 (20.13%) | Relative drawdown | 20.13% (3332.67) |
| Total transactions | 1138 | Short positions (won%) | 584 (58.39%) | Long positions (won%) | 554 (61.19%) |
| Profit trades (% of total) | 680 (59.75%) | Loss trades (% of total) | 458 (40.25%) | ||
| Largest | profitable trades | 201.00 | losing trades | -159.00 | |
| Average | profitable trades | 30.53 | losing trades | -31.75 | |
| Maximum Number | consecutive wins (profit) | 28 (1240.15) | consecutive losses (loss) | 16 (-600.17) | |
| Maximum | consecutive profit (count of wins) | 1240.15 (28) | consecutive loss (count of losses) | -883.85 (10) | |
| Average | consecutive wins | 5 | consecutive losses | 3 | |
")
Figure 9. Graph of balance changes.Two filters: P-filter + D-filter (simple addition)
However, these two filters can be connected in another way. Assume that filter number 1 is configured better than filter number 2. Thus, we need to build a new D-filter. The Expert Advisor's code will look the follows way. We launch the tester in an optimized mode and obtain the characteristics of filter number 2 (trading by the hour).
   //+---------------------------------------------------------------------------------+
   //   BUY Signals
   //+---------------------------------------------------------------------------------+
   if(true
      && High[0]<iLow(NULL,PERIOD_H1,1)
      && ORD.Buy<nORD.Buy
   //.........................................Filters...................................
      //---- filter №1
      && iOpen(NULL,PERIOD_H1,1)>iClose(NULL,PERIOD_H1,1)
      //---- filter №2
      && Hour()==Filter.Hour
      )
   {
   //----
      Signal.Buy=true;
   }
   //+---------------------------------------------------------------------------------+
   //   SELL Signals
   //+---------------------------------------------------------------------------------+
   if(true
      && Low[0]>iHigh(NULL,PERIOD_H1,1)
      && ORD.Sell<nORD.Sell
   //.........................................Filters...................................
      //---- filter №1
      && iOpen(NULL,PERIOD_H1,1)<iClose(NULL,PERIOD_H1,1)
      //---- filter №2
      && Hour()==Filter.Hour
      )
   {
   //----
      Signal.Sell=true;
   }

Figure 10. The changes in profit according to time for the two D-filters. Comparative analysis
Indeed, the response characteristics of the filter have changed. And that's no wonder considering that by adding filter number 1 to the Expert Advisor, we have changed its properties. Consequently, it is necessary to change the mask for filter number 2.
")
Figure 11. Characteristics of the filter № 2 response. D-filtering by the hour (Optimized)
Final view of the Expert Advisor code.
   //+---------------------------------------------------------------------------------+
   //   BUY Signals
   //+---------------------------------------------------------------------------------+
   if(true
      && High[0]<iLow(NULL,PERIOD_H1,1)
      && ORD.Buy<nORD.Buy
   //.........................................Filters...................................
      //---- filter №1
      && iOpen(NULL,PERIOD_H1,1)>iClose(NULL,PERIOD_H1,1)
      //---- filter №2
      && (Hour()==0
         || Hour()==1
         || Hour()==6
         || Hour()==7
         || Hour()==9
         || Hour()==10
         || Hour()==12
         || Hour()==14
         || Hour()==15
         || Hour()==18
         || Hour()==20
         || Hour()==22
         || Hour()==23
         )
      )
   {
   //----
      Signal.Buy=true;
   }
   //+---------------------------------------------------------------------------------+
   //   SELL Signals
   //+---------------------------------------------------------------------------------+
   if(true
      && Low[0]>iHigh(NULL,PERIOD_H1,1)
      && ORD.Sell<nORD.Sell
   //.........................................Filters...................................
      //---- filter №1
      && iOpen(NULL,PERIOD_H1,1)<iClose(NULL,PERIOD_H1,1)
      //---- filter №2
      && (Hour()==0
         || Hour()==1
         || Hour()==6
         || Hour()==7
         || Hour()==9
         || Hour()==10
         || Hour()==12
         || Hour()==14
         || Hour()==15
         || Hour()==18
         || Hour()==20
         || Hour()==22
         || Hour()==23
         )
      )
   {
   //----
      Signal.Sell=true;
   }
Balance
| Symbol | EURUSD (Euro vs US Dollar) | ||||
| Period | 1 Minute (M1) 2009.09.07 00:00 - 2010.01.26 23:59 (2009.09.07 - 2010.01.27) | ||||
| Model | All ticks (the most accurate method based on all least available timeframes) | ||||
| Parameters | Lots = 0.1; Symb.magic = 9001; nORD.Buy = 5; nORD.Sell = 5; | ||||
| Bars in history | 133967 | Modeled ticks | 900848 | Modeling Quality | 25.00% |
| Mismatched graphs errors | 0 | ||||
| Initial deposit | 10000.00 | ||||
| Net profit | 5420.54 | Gross profit | 22069.48 | Gross loss | -16648.94 |
| Profitability | 1.33 | Expected payoff | 3.77 | ||
| Absolute drawdown | 826.86 | Maximum drawdown | 2141.24 (14.06%) | Relative drawdown | 14.06% (2141.24) |
| Total transactions | 1439 | Short positions (won%) | 758 (61.87%) | Long positions (won%) | 681 (64.46%) |
| Profit trades (% of total) | 908 (63.10%) | Loss trades (% of total) | 531 (36.90%) | ||
| Largest | profitable trade | 157.00 | losing trade | -154.00 | |
| Average | profitable trade | 24.31 | losing trade | -31.35 | |
| Maximum Number of Defects | consecutive wins (profit) | 30 (772.70) | consecutive losses (loss) | 16 (-562.17) | |
| Maximum | consecutive profit (count of wins) | 1091.32 (22) | consecutive loss (count of losses) | -926.15 (15) | |
| Average | consecutive wins | 5 | consecutive losses | 3 | |

Figure 12. Graph of balance changes as a result of optimizing the characteristics of the two filters
For make the analysis of reports easier, we create the following table.
| No filtering | Addition | Optimization | |
|---|---|---|---|
| Initial deposit | 10000.00 | 10000.00 | 10000.00 |
| Net profit | 4408.91 | 6221.18 | 5420.54 |
| Gross profit | 32827.16 | 20762.67 | 22069.48 |
| Gross loss | -28418.25 | -14541.49 | -16648.94 |
| Profitability | 1.16 | 1.43 | 1.33 |
| Expected payoff | 1.34 | 5.47 | 3.77 |
| Absolute drawdown | 273.17 | 1095.86 | 826.86 |
| Maximum drawdown | 3001.74 (20.36%) | 3332.67 (20.13%) | 2141.24 (14.06%) |
| Relative drawdown | 20.36% (3001.74) | 20.13% (3332.67) | 14.06% (2141.24) |
| Total transactions | 3284 | 1138 | 1439 |
| Short positions (won%) | 1699 (64.98%) | 584 (58.39%) | 758 (61.87%) |
| Long positions (won%) | 1585 (65.68%) | 554 (61.19%) | 681 (64.46%) |
| Profitable trades (% of total) | 2145 (65.32%) | 680 (59.75%) | 908 (63.10%) |
| Losing trades (% of total) | 1139 (34.68%) | 458 (40.25%) | 531 (36.90%) |
| Largest | |||
| profitable trade | 82.00 | 201.00 | 157.00 |
| losing trade | -211.00 | -159.00 | -154.00 |
| Average | |||
| profitable trade | 15.30 | 30.53 | 24.31 |
| losing trade | -24.95 | -31.75 | -31.35 |
| Maximum Number of | |||
| consecutive wins (profit) | 29 (679.00) | 28 (1240.15) | 30 (772.70) |
| consecutive losses (loss) | 16 (-290.34) | 16 (-600.17) | 16 (-562.17) |
| Maximum | |||
| consecutive profit (number of wins) | 679.00 (29) | 1240.15 (28) | 1091.32 (22) |
| consecutive loss (number of losses) | -1011.00 (10) | -883.85 (10) | -926.15 (15) |
| Average | |||
| consecutive win | 5 | 5 | 5 |
| consecutive loss | 3 | 3 | 3 |
Tab.2 Comparative table of testing reports of the combination of two filters: P-filter and D-filter
Analysis of results:
- If we make the comparison based on the criteria of revenue, profit, and expected profit, then the best results were obtained when we added the two filters.
- If we focus on the drawdown, then the winner is the filter optimization option.
- In any case, filtering improves the ATS characteristics.
Conclusion
- So what is the magic filter? The magic is in its simplicity and the ability to change the characteristics of any Expert Advisor.
- The proposed technology of filter creation is not designed for simple copying. It only shows how a P-filters and D-filters can be developed for a particular Expert Advisor. A filter, which is suitable for one Expert Advisor, may hinder another.
- And remember, an ideal ATS does not need a filter! ... You dream to create such a system don't you?
- I know that this code of the Expert Advisor and filters is not optimized and certainly not ideal. But for the purposes of this article we selected this particular style of programming. This was done so that any "dummie" would be able to repeat the above process, and create his own unique filters.
- ATTENTION! Do not use in real trading the Expert Advisor considered in this article!
Translated from Russian by MetaQuotes Ltd.
Original article: https://www.mql5.com/ru/articles/1577
Warning: All rights to these materials are reserved by MetaQuotes Ltd. Copying or reprinting of these materials in whole or in part is prohibited.
This article was written by a user of the site and reflects their personal views. MetaQuotes Ltd is not responsible for the accuracy of the information presented, nor for any consequences resulting from the use of the solutions, strategies or recommendations described.

 Connection of Expert Advisor with ICQ in MQL5
 New Opportunities with MetaTrader 5
 An Example of a Trading Strategy Based on Timezone Differences on Different Continents
 The Algorithm of Ticks' Generation within the Strategy Tester of the MetaTrader 5 Terminal
- Free trading apps
- Over 8,000 signals for copying
- Economic news for exploring financial markets
You agree to website policy and terms of use
The author of this article is abusing the terms "band-pass" and "discrete" filtering. Though what they are referring to technically reduces the number of trades one may take, and thus "filters" the trades it is not really a digital nor a discrete, nor a band-pass filter.
http://en.wikipedia.org/wiki/Filter_%28signal_processing%29
http://en.wikipedia.org/wiki/Band-pass_filter
http://en.wikipedia.org/wiki/Digital_filter
Yes, it seems having naming issue.
When we assume:
0 = PEROID_M1
1 = PEROID_M5
2 = PEROID_M15
3 = PEROID_M30
4 = PEROID_H1
5 = PEROID_H4
We can use the example P-filter as the so called D-filter.
While not a self explanatory, but still can get the meaning in context.
If you think this article worth reading, vote it for Sergey.
http://v4ex.com/node/13
It is remarkable, very much helpful information for because i Have just enter in the field of system developing.........
Thanks for the effort.
sure shot mcx tips !! Mcx Tips Free Trial
While this filtering has improved the performance of this example somewhat, it is not really anywhere near effective enough to be a long term, solid, robust and profitable performer.
My contention and focus is in regards to entrance strategy versus exit strategy. While one must have them both to have successful, robust and profitable EAs, if the EA is not getting into a significantly higher portion of profitable trades than losing trades, this is all for naught as Sergey himself states at the beginning of this article:
If the Expert Adviser is unprofitable ("drainer"), it is unlikely that some type of filtration will help,- the magic of filtering is powerless here.
Thus I believe that first and foremost, the challenge and the task is to find the entry conditions that results in the EA entering into significantly more winning trades than losing trades to start with. If one finds and applies an effective entrance strategy that has a very high accuracy rate of getting into profitable trades in the first place, preferably above 90%, and 80% at the very least; then subsequent filtering can improve the returns and the overall robustness and result in hopefully long term profitable EAs.
As Sergy himself notes: if the filtering out of losing trades significantly reduces the number of overall trades, then it may likewise be unproductive. If their is little or almost no trading going on, then there is no reasonable possibility of it being worthwhile. I am currently doing some filtering on such a mediocre EA that the recommended setting of the StopLoss is 20 TIMES what the TakeProfit is. This means that in order to just break even, it has to have an accuracy rate of 95%! At a 45% accuracy rate, this EA is no where near this accurate by far. This to pretty well amounts to 'guessing' at when to enter into trades as opposed to sound, solid parameters based on proven profitable results. Optimization that encompassed the recommended settings 24/5 over 3+ years of data on $3K produced only $195 ~ $160 profit with DrawDowns of between 20% ~ 35%. Filtering it by time has clearly shown that only trading it from 5 to 6 and from 23 to 24 are clearly the most profitable by far. A partial Optimization on ~ 5+ years of data starting with only $1K and trading only between 5 to 6 AM returned a maximum profit of $1,117 at a DD of ~ 22% == quite high. A more reasonable DD of ~ 14.6% returned a profit of ~ $663. // ~ 11.1% DD ~ = $141. // ~ 7.6% DD ~ = $306 and a DD of only ~ 5.7% yields $266. So filtration has clearly increased the profitability of this mediocre EA. The initial 24/5 optimized results had an accuracy of only ~ 42% of the trades being profitable. The results of a partial optimization of trading at only the most profitable period for 5AM to 6 Am for this EA still has an accuracy rate of less than 50%
The problem? Optimized trading 24/5 on $3K for 3+ years gives a maximum profit of only #193.50 on $3K made ONLY between 19 - 29 trades in over 3+ years! )< 8(
The partially Optimized results filtered to only trade between the most profitable hours of 5AM to 6AM on only $1K returned a maximum profit of $1,117 but with a DD of ~ 22% // ~ $306 with ~ 7.6% DD // $266 with ~ 5.7% DD Clearly improved ROI but with about the same accuracy rate. But only 18 - 23 trades in over 5+ years! This clearly indicates that having spent $50 on this loser, and the 2 other more 'advanced' versions of this EA that were more expensive but even less profitable; that any further time invested on this is clearly wasted and would only reduce my net ROI even more! Except for the very small number of trades, these are typical results for most commercial EAs that unfortunately I have to much personal experience with )< 8) Results indicate that making more trades with this EA would make it into an even bigger loser In fact this is one of the better performing ones! )< 8(
The problem? Trading during only the most profitable period of between 5Am to 6AM, it only makes 19 trades at the most over a period of 5+ years of optimization! Hardly enough to sustain one. One might put almost all of their account onto these few trades, but without an absolutely 100% accuracy rate, this can only lead to disaster.
I have such a VERY accurate commercial EA. However it trades so rarely: 5 ~ 6 time per month on 3 charts with the recommended exposure of only 0.1% of ones account, that only one losing trade, which was by far, far larger than the winning trades, wiped our several months of profitable trading at 100 % accuracy and left it at a net loss after all this time! )< 8(
Most EAs seem to rely VERY heavily on setting the Stop Loss many, many times higher than the Take Profit with the faulty logic that it is so high that one will never hit it and therefore never lose. One of the most successful commercial EA's primary trading pair and algorithm functions this way: the recommended SL is 25 TIMES higher than the TP! In my option this is not really a valid method to the point that it can not really be called and 'Expert' Adviser at all. It is really no significant and effective method at all. This EA went along making 10 ~ 20 pips occasionally with no great regularity and then with the recommended default setting with the Stop Loss set at 500, got 'married' to one such losing trade that got as much as 450 pips in the hole and that I finally manged to get out of manually when it was 'ONLY' a 300 pip loss! )< 8( This is with what likely is the most successful commercial EA to date! Clearly the bar is set VERY low in this market! I have seen MANY such (commercial) EAs that operate on this principle of the SL being MANY TIMES higher than the TP and everyone of them that does so are all losers. IMHO these are EAs that are cranked out one after another by people that while they may be excellent MQL programmers that can produce many 'working and functional' EAs in a short periods of time and have them mass marketed; but that they have no real knowledge, skill or proven ability to produce a profitable ForEx trading system, automated or otherwise. So they keep cranking out these losers that many people jump on and utilizing mass marketing appealing not to logic and 'Proof of Performance' but are sold by utilizing hype that grabs people by there emotions and greed by indicating that they will become very wealthy in very short periods of time with them that leads them to leave all common sense behind and act on emotions and the only ones making any money off of these are those unscrupulous reprobates that produce, market and sell them.
ForEx EAs have the dubious distinction of having the highest return rate of any and all digital download products world wide! With the aforementioned losing algorithms making up most of the EAs, and the very poor ROI, which is negative in most cases, on virtually all of them; it is no wonder. Like InterNet marketing products themselves, there are so many that utilize so many faulty and baseless claims that they have virtually no credibility at all, which is a very sad state of affairs and will not be beneficial to the retail ForEx market in the long run. Thus the often heard statement by those such as myself that have learned this unpalatable truth first hand: if the EAs were REALLY profitable, then the authors would just be trading on them to make very good money as opposed to the perhaps even more difficult and very time, energy and resources consuming task of successfully mass marketing them on the internet and then (hopefully) all that is entailed in supporting them. While this is not universally true, it is to the degree that for all intents and purposes, it is the reality of almost the entirety of the retail commercial market.
While this forum is dedicated primarily to learning to program EAs, the underlying premise and foundation has to be not just making EAs that work, but that work profitably. This article is an example of this. We are not here just to learn how to make EAs that automatically lose lots of money. We can all do that readily enough by ourselves. Automating these only makes them worse. Let us have more focus on the ways, technique and valid algorithms that are profitable and THEN work on automating them effectively. One has to have a profitable system to start with, otherwise it is going to be an unprofitable loser regardless of if it is automated successfully or not. We need to have more such focus and content as this article in effectiveness and successful outcomes, not just proficient MQL programming.
This illustrates that unless one has a trading system, automated or otherwise, that makes a great many trades with a VERY high degree of accuracy, then it cannot have a substantially higher Stop Loss than the Take Profit. I believe that to have a robust, long term successful trading strategy, that the SL should be no higher and preferably at least a couple of times lower than the SL. Alas these seem to be few and far in between and are in the minority by a very large degree. In most case I have found that those that are the reverse, and are so because their is no statistical basis for there validity as a profitable EA without this, and even this does not usually make then profitable.. So they just make it trade more often, set the SL several times higher than the TP so that they make more winning than losing trades to utilize this statistic to market and sell, but which by itself is misleading; even though it IS true and dazzle one with 'the very high accuracy rate of all the winning trades' they are making for us. But that end being unprofitable 'drainers', 'bleeders' and 'losers' regardless.
Bottom line: if we don't know how to trade the ForEx profitably, then all the programming skills in the world aren't going to make money for us using these EAs to trade with ourselves. Their are many in this category that having learned MQL end up producing many unprofitable EAs and sell them to others which is how they make their profits with them: not on the ForEx itself. After all, isn't that why we are all here? Not just to become adept at programming in MQL, but to be effective and competent enough to take our FX winning strategies and then automate them. Do we want to spend years or decades of our lives becoming very proficient at MQL, only to be STILL losing money? Albeit more adeptly, readily and efficiently and at an even higher rate!
Good MQL programming skills are a means to an end, and not the end goal itself.
I want to know how to program PROFITABLE ForEx EAs, not just get proficient and efficient at programming in MQL.
Hi Sergey Pavlov,
I am a trader and you taught me a good methodology to test an EA's profitability and drawdown factor. I am not so much worried about the strategies because most of them make money if you manage risk and profitability well.
But unfortunately I am unable to use your EAs on the existing MT4 platforms.
Can you please post updated EAs or provide me the link to buy it?
thank you.