The Magic of Filtration
Sergey Pavlov | 3 June, 2010
Introduction
Most of the developers of automated trading systems (ATS), one way or another, use some form of signals filtering. Although it isn't the only way to improve the system characteristics, it is considered most effective. Beginner "grail-builders" often fall to the magic of the filters. It's very simple to take some trading strategy, hang a dozen of filters on it, and here it is, - a profitable Expert Advisor.
However, there are opponents of the use of filters. Filters significantly (sometimes 2-3 times) reduce the number of deals, and there is no guarantee that in the future they will be as effective as in the past. Certainly, there are also some other compelling reasons.
So let us take a further look and consider all of this one step at a time.
The hypothesis of the meaninglessness of filtering
If the Expert Advisor is unprofitable ("drainer"), it is unlikely that some type of filtration will help,- the magic of filtering is powerless here.
Therefore, in this article, these Expert Advisors will not be considered. Although, we must know that there are studies of quantum-frequency filters, capable of turning virtually any "drainer" into a pseudo-Grail.
Hypothesis of the dangers of filtering
If the Expert Advisor in its characteristics is approaching an ideal Automated Trading System, then filtering will only worsen it.
We should clarify what is meant by an ideal automated trading system. By this is meant such a trading strategy, which generates only profitable transaction, ie does not bring any losses. In such a system, the number of unprofitable trades = 0.
What is a filter?
In its simplest form, a trading signal filter is a logical restriction such as: if A is not less than B (A> = B), then the signal is skipped, and if it is smaller (A <B) - then it is not.As a result a part of the signals is eliminated. The terms of filtration are established by the developer of the trading robot. In order to establish some types of trends, we need to analyze the influence of various factors on the characteristics of ATS. And there are a great variety of such factors. Therefore we must turn to out intuition in order to choose the most relevant and consistent ones.
An example.There may be a correlation between the results of ATS trading and atmospheric pressure in the village of Kukushkino, ie You can create an appropriate filter and improve the profitability of the Expert Advisor, which will take into account the weather in this small Russian town. However, it is unlikely that someone would appreciate such an innovative approach to filtering, in spite of the fact that it could raise the profitablity of the system.
Classification of filters
Although there is a great variety of filters used in ATS, they can still be divided into two main classes:
- bandpass filter (P-filter) - transmits a band of signals;
- discrete filter (D-filter) - selective transmission of signals by the mask (template).
Where to start?
Let's consider the filtering mechanism by looking at an example. let's use the DC2008_revers Expert Advisor (see attached file), which was specially developed for this article, and explore its features (without using any filters). Here is the report obtained during testing.
Report
| Symbol | EURUSD (Euro vs US Dollar) | ||||
| Period | 1 Minute (M1) 2009.09.07 00:00 - 2010.01.26 23:59 (2009.09.07 - 2010.01.27) | ||||
| Model | All ticks (the most accurate method based on all of the least available timeframes) | ||||
| Parameters | Lots = 0.1; Symb.magic = 9001; nORD.Buy = 5; nORD.Sell = 5; | ||||
| Bars in the history | 133967 | Modeled ticks | 900848 | Quality of Modeling | 25.00% |
| Mismatched traffic errors | 0 | ||||
| Initial deposit | 10000.00 | ||||
| Net profit | 4408.91 | Gross profit | 32827.16 | Gross loss | -28418.25 |
| Profitability | 1.16 | Expected payoff | 1.34 | ||
| Absolute drawdown | 273.17 | Maximum drawdown | 3001.74 (20.36%) | Relative drawdown | 20.36% (3001.74) |
| Total transactions | 3284 | Short positions (won%) | 1699 (64.98%) | Long positions (won%) | 1585 (65.68%) |
| Profitable trades (% of total) | 2145 (65.32%) | Losing trades (% of total) | 1139 (34.68%) | ||
| Largest | profitable trade | 82.00 | losing trade | -211.00 | |
| Average | profitable trade | 15.30 | losing trade | -24.95 | |
| Maximum Number | consecutive wins (profit) | 29 (679.00) | consecutive losses (loss) | 16 (-290.34) | |
| Maximum | consecutive profit (count of wins) | 679.00 (29) | consecutive loss (count of losses) | -1011.00 (10) | |
| Average | consecutive win | 5 | consecutive loss | 3 | |

Figure 1. History Backtesting results. Initial Expert Advisor without filters
Result Analyses:
- The Expert Advisor is profitable and winning trades make up more than 60% - that's good.
- A maximum drawdown of 20% of the deposit and more than $ 3000 with a minimum lot size - is bad.
- Total number of transactions is sufficient enough for the use of filtering (> 3000).
Of course, these conclusions are relevant only for the currently given period of history. We don't know how the Expert Advisor will trade at a different location. However, this can not prevent us from making changes to its characteristics using filtering.
Therefore, for this Expert Advisor, we can try finding filters which will improve profitability and reduce drawdown.
Bandpass filter (P-filter)
This is one of the most common and simple filters, because the result can be evaluated immediately after testing and without any additional processing. Consider the possible options for using it in the tested Expert Advisor. As one of the parameters, let's use the skipping band, and compare the price of opening the bar to the closing price at different time periods.
H4 Period
   //+---------------------------------------------------------------------------------+
   //   BUY Signals
   //+---------------------------------------------------------------------------------+
   if(true
      && High[0]<iLow(NULL,PERIOD_H1,1)
      && ORD.Buy<nORD.Buy
   //.........................................Filters...................................
      && iOpen(NULL,PERIOD_H4,1)<iClose(NULL,PERIOD_H4,1)
      )
   {
   //----
      Signal.Buy=true;
   }
   //+---------------------------------------------------------------------------------+
   //   SELL Signals
   //+---------------------------------------------------------------------------------+
   if(true
      && Low[0]>iHigh(NULL,PERIOD_H1,1)
      && ORD.Sell<nORD.Sell
   //.........................................Filters...................................
      && iOpen(NULL,PERIOD_H4,1)>iClose(NULL,PERIOD_H4,1)
      )
   {
   //----
      Signal.Sell=true;
   }
")
Figure 2. History
Backtesting results. Expert Advisor with P-filter (H4 period)
Period H1
   //+---------------------------------------------------------------------------------+
   //   BUY Signal
   //+---------------------------------------------------------------------------------+
   if(true
      && High[0]<iLow(NULL,PERIOD_H1,1)
      && ORD.Buy<nORD.Buy
   //.........................................Filters...................................
      && iOpen(NULL,PERIOD_H1,1)>iClose(NULL,PERIOD_H1,1)
      )
   {
   //----
      Signal.Buy=true;
   }
   //+---------------------------------------------------------------------------------+
   //   SELL Signal
   //+---------------------------------------------------------------------------------+
   if(true
      && Low[0]>iHigh(NULL,PERIOD_H1,1)
      && ORD.Sell<nORD.Sell
   //.........................................Filters...................................
      && iOpen(NULL,PERIOD_H1,1)<iClose(NULL,PERIOD_H1,1)
      )
   {
   //----
      Signal.Sell=true;
   }
")
Figure 3. History
Backtesting results. Expert Advisor
with P-filter (H1 period)
M30 Period
   //+---------------------------------------------------------------------------------+
   //  BUY Signals
   //+---------------------------------------------------------------------------------+
   if(true
      && High[0]<iLow(NULL,PERIOD_H1,1)
      && ORD.Buy<nORD.Buy
   //.........................................Filters...................................
      && iOpen(NULL,PERIOD_M30,1)<iClose(NULL,PERIOD_M30,1)
      )
   {
   //----
      Signal.Buy=true;
   }
   //+---------------------------------------------------------------------------------+
   //   SELL Signals
   //+---------------------------------------------------------------------------------+
   if(true
      && Low[0]>iHigh(NULL,PERIOD_H1,1)
      && ORD.Sell<nORD.Sell
   //.........................................Filters...................................
      && iOpen(NULL,PERIOD_M30,1)>iClose(NULL,PERIOD_M30,1)
      )
   {
   //----
      Signal.Sell=true;
   }
")
Figure 4. History
Backtesting results. Expert Advisor
with P-filter (M30 period)
Period M5
   //+---------------------------------------------------------------------------------+
   //   BUY Signals
   //+---------------------------------------------------------------------------------+
   if(true
      && High[0]<iLow(NULL,PERIOD_H1,1)
      && ORD.Buy<nORD.Buy
   //.........................................Filters...................................
      && iOpen(NULL,PERIOD_M5,1)<iClose(NULL,PERIOD_M5,1)
      )
   {
   //----
      Signal.Buy=true;
   }
   //+---------------------------------------------------------------------------------+
   //   SELL Signals
   //+---------------------------------------------------------------------------------+
   if(true
      && Low[0]>iHigh(NULL,PERIOD_H1,1)
      && ORD.Sell<nORD.Sell
   //.........................................Filters...................................
      && iOpen(NULL,PERIOD_M5,1)>iClose(NULL,PERIOD_M5,1)
      )
   {
   //----
      Signal.Sell=true;
   }

Fig.5 Schedule of balance changes.P-filter for the M5 period
To make the analysis of the received reports easier, they are summarized in the following table.
| No filtering | PERIOD_H4 | PERIOD_H1 | PERIOD_M30 | PERIOD_M5 | |
|---|---|---|---|---|---|
| Initial deposit | 10000.00 | 10000.00 | 10000.00 | 10000.00 | 10000.00 |
| Net profit | 4408.91 | 4036.33 | 4829.05 | 3852.90 | 4104.30 |
| Gross profit | 32827.16 | 19138.74 | 27676.50 | 18133.77 | 23717.68 |
| Gross loss | -28418.25 | -15102.41 | -22847.45 | -14280.87 | -19613.38 |
| Profitability | 1.16 | 1.27 | 1.21 | 1.27 | 1.21 |
| Expected payoff | 1.34 | 2.92 | 2.20 | 3.59 | 2.02 |
| Absolute drawdown | 273.17 | 434.09 | 762.39 | 64.00 | 696.23 |
| Maximum drawdown | 3001.74 (20.36%) | 2162.61 (17.48%) | 2707.56 (17.22%) | 2121.78 (16.38%) | 1608.30 (12.46%) |
| Relative drawdown | 20.36% (3001.74) | 17.48% (2162.61) | 17.22% (2707.56) | 16.38% (2121.78) | 12.46% (1608.30) |
| Total transactions | 3284 | 1383 | 2195 | 1073 | 2035 |
| Short positions (won%) | 1699 (64.98%) | 674 (54.01%) | 1119 (60.59%) | 547 (60.51%) | 1046 (63.48%) |
| Long positions (won%) | 1585 (65.68%) | 709 (62.48%) | 1076 (64.96%) | 526 (64.64%) | 989 (66.63%) |
| Profit trades (% of total) | 2145 (65.32%) | 807 (58.35%) | 1377 (62.73%) | 671 (62.53%) | 1323 (65.01%) |
| Losing trades (% of total) | 1139 (34.68%) | 576 (41.65%) | 818 (37.27%) | 402 (37.47%) | 712 (34.99%) |
| Largest | |||||
| profitable trade | 82.00 | 201.00 | 157.00 | 204.00 | 97.00 |
| losing trade | -211.00 | -136.00 | -160.00 | -179.51 | -156.00 |
| Average | |||||
| profitable trade | 15.30 | 23.72 | 20.10 | 27.02 | 17.93 |
| losing trade | -24.95 | -26.22 | -27.93 | -35.52 | -27.55 |
| Maximum Number | |||||
| consecutive wins (profit) | 29 (679.00) | 27 (817.98) | 36 (1184.32) | 36 (1637.38) | 44 (912.03) |
| consecutive losses (loss) | 16 (-290.34) | 12 (-636.34) | 13 (-367.07) | 14 (-371.51) | 15 (-498.51) |
| Maximum | |||||
| consecutive profit (count of wins) | 679.00 (29) | 884.08 (16) | 1184.32 (36) | 1637.38 (36) | 912.03 (44) |
| consecutive loss (count of losses) | -1011.00 (10) | -686.00 (10) | -758.00 (7) | -894.85 (10) | -589.00 (5) |
| Average | |||||
| consecutive wins | 5 | 5 | 5 | 5 | 4 |
| consecutive losses | 3 | 3 | 3 | 3 | 2 |
Table 1. Comparison table of test reports for P-filter
Analysis of results:
- Net income increased only in the P-filter "PERIOD_H1" (4408.91 => 4829.05).
- The leader for Expected payoff was the P-filter "PERIOD_M30" (1.34 => 3.59).
- The maximum drawdown decreased in all filters. The minimum value of drawdown resulted in "PERIOD_M5" (3001.74 => 1608.30) filter.
- Filtering reduced the total number of transactions by 1,5-3 times.
CONCLUSIONS
- The P-filter can improve the ATS characteristics.
- For further analysis, we will choose the P-filter "PERIOD_H1", which demonstrated the best profit results.
Discrete filter (D-filter)
The simplest and most intuitively understood discrete filter is trading by the hour. It's reasonable to assume that during the day a trading Expert Advisor is unstable in trading. During certain hours it's more profitable, and during others can be the opposite, and bring only losses. For this purpose, let's study the influence of this filter on the results of trade. An additional external variable must be included into the expert code beforehand:
extern int        Filter.Hour=0;    // D-filter: trade by hour
//----
extern double     Lots=0.1;
extern int        Symb.magic=9001,
                  nORD.Buy = 5,     // max buy orders
                  nORD.Sell = 5;    // max sell orders
And the filter itself:
   //+---------------------------------------------------------------------------------+
   //   BUY Signals
   //+---------------------------------------------------------------------------------+
   if(true
      && High[0]<iLow(NULL,PERIOD_H1,1)
      && ORD.Buy<nORD.Buy
   //.........................................Filters...................................
      && Hour()==Filter.Hour
      )
   {
   //----
      Signal.Buy=true;
   }
   //+---------------------------------------------------------------------------------+
   //   SELL Signals
   //+---------------------------------------------------------------------------------+
   if(true
      && Low[0]>iHigh(NULL,PERIOD_H1,1)
      && ORD.Sell<nORD.Sell
   //.........................................Filters...................................
      && Hour()==Filter.Hour
      )
   {
   //----
      Signal.Sell=true;
   }
So, if the current hour coincides with the discrete value of the D-filter, then we generate (allow) the signal to buy or sell, otherwise - we do not.
We launch the tester in the optimized mode (input parameters are indicated in the pictures). The deposit must be specified as a maximum to avoid the situation of - "not enough money to open a position" and not to lose part of a transactions.
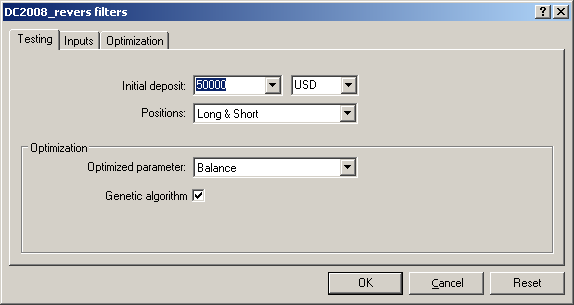
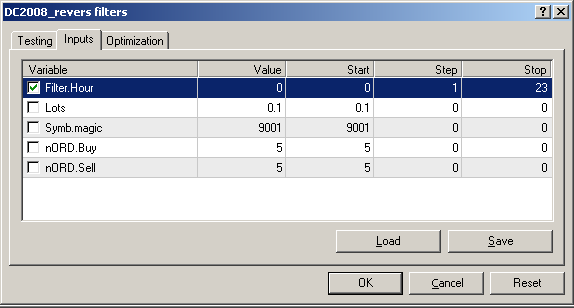
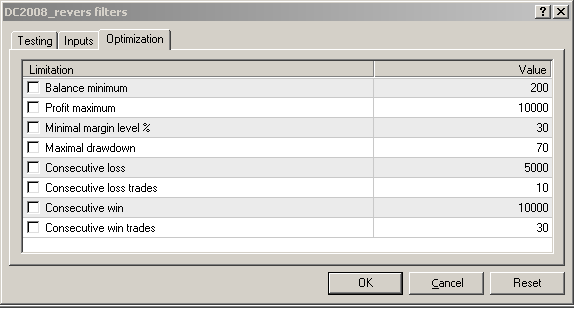
Figure 6. Input parameters for the search of the D-filter characteristics
As a result we obtain the characteristic of the filter's response: profit, number of transactions and drawdown (axis Y) as a function of the time of the day (axis X).

Figure 7. Characteristics of the filter's response. D-filtering by the hour
So our assumption that the Expert Advisor brings different profit at different times has confirmed!
... And so it has confirmed, but what do we now do with this? The first thing that comes to mind is to disallow the Expert Advisor to trade during the hours when it brings only losses. This seems logical.Well, thenwe will alter the D-filter, by permitting it to trade only during profitable hours. In other words - we will create a filter mask. Now we can plug the finalized D-filter into the code and view the test report.
   //+---------------------------------------------------------------------------------+
   //   BUY Signals
   //+---------------------------------------------------------------------------------+
   if(true
      && High[0]<iLow(NULL,PERIOD_H1,1)
      && ORD.Buy<nORD.Buy
   //.........................................Filters...................................
      && (Hour()==0
         || Hour()==6
         || Hour()==9
         || Hour()==10
         || Hour()==11
         || Hour()==12
         || Hour()==18
         || Hour()==20
         || Hour()==22
         || Hour()==23
         )
      )
   {
   //----
      Signal.Buy=true;
   }
   //+---------------------------------------------------------------------------------+
   //   SELL Signals
   //+---------------------------------------------------------------------------------+
   if(true
      && Low[0]>iHigh(NULL,PERIOD_H1,1)
      && ORD.Sell<nORD.Sell
   //.........................................Filters...................................
      && (Hour()==0
         || Hour()==6
         || Hour()==9
         || Hour()==10
         || Hour()==11
         || Hour()==12
         || Hour()==18
         || Hour()==20
         || Hour()==22
         || Hour()==23
         )
      )
   {
   //----
      Signal.Sell=true;
   }
| Symbol | EURUSD (Euro vs US Dollar) | ||||
| Period | 1 Minute (M1) 2009.09.07 00:00 - 2010.01.26 23:59 (2009.09.07 - 2010.01.27) | ||||
| Model | Every tick (the most accurate method based on all available least timeframes) | ||||
| Parameters | Filter.Hour = 0; Lots = 0.1; Symb.magic = 9001; nORD.Buy = 5; nORD.Sell = 5; | ||||
| Bars in history | 133967 | Modeled ticks | 900848 | Modeling Quality | 25.00% |
| Mismatched graphs errors | 0 | ||||
| Initial deposit | 10000.00 | ||||
| Net profit | 6567.66 | Gross profit | 24285.30 | Gross loss | -17717.64 |
| Profitability | 1.37 | Expected payoff | 4.13 | ||
| Absolute drawdown | 711.86 | Maximum drawdown | 3016.21 (18.22%) | Relative drawdown | 18.22% (3016.21) |
| Total transactions | 1590 | Short positions (won%) | 832 (61.30%) | Long positions (won%) | 758 (63.85%) |
| Profit trades (% of total) | 994 (62.52%) | Losing trades (% of total) | 596 (37.48%) | ||
| Largest | profitable trade | 194.00 | losing trade | -161.00 | |
| Average | profitable trade | 24.43 | losing trade | -29.73 | |
| Maximum Number | consecutive wins (profit) | 40 (1096.16) | consecutive losses (loss) | 15 (-336.45) | |
| Maximum | consecutive profit (count of wins) | 1289.08 (20) | consecutive loss (count of losses) | -786.51 (8) | |
| Average | consecutive wins | 5 | consecutive losses | 3 | |

Figure 8. Balance chart. D-filter by the hour
Analysis of filtration results:
- Drawdown Reduction - not achieved. It did not diminished, but even slightly increased (3001.74 => 3016.21)!?
- Net income increased by approximately 50% (4408.91 => 6567.66). This is, but the number of transactions with decreased almost in 2 times (3284 => 1590).
- Expected profit of D-filter (4.13) is higher than the best value of all of the investigated P-filters (3.59).
- The number of profitable transactions declined (64.98% => 62.52%)., i.e. the filter eliminated not only unprofitable, but also a number of profitable transactions.
CONCLUSIONS
- Discrete filtering can be more effective than P-filtering, but it requires more fine tuning and a selection of optimum input conditions.
Filtering signals using two or more filters
It is not always possible to achieve significant performance improvement of ATS, using only one filter. It is more common to set up several filters instead. Thus we are faced with the question of how to merge these filters.
For the purpose of this study, we will take the above filters, and to simplify matters label them the following way: filter № 1 (P-filter "PERIOD_H1") and filter number 2 (D-filter). Initially we will merge them by simple addition. To do this we will change the Expert Advisor's code.
   //+---------------------------------------------------------------------------------+
   //   BUY Signals
   //+---------------------------------------------------------------------------------+
   if(true
      && High[0]<iLow(NULL,PERIOD_H1,1)
      && ORD.Buy<nORD.Buy
   //.........................................Filters...................................
      //---- filter №1
      && iOpen(NULL,PERIOD_H1,1)>iClose(NULL,PERIOD_H1,1)
      //---- filter №2
      && (Hour()==0
         || Hour()==6
         || Hour()==9
         || Hour()==10
         || Hour()==11
         || Hour()==12
         || Hour()==18
         || Hour()==20
         || Hour()==22
         || Hour()==23
         )
      )
   {
   //----
      Signal.Buy=true;
   }
   //+---------------------------------------------------------------------------------+
   //   SELL Signals
   //+---------------------------------------------------------------------------------+
   if(true
      && Low[0]>iHigh(NULL,PERIOD_H1,1)
      && ORD.Sell<nORD.Sell
   //.........................................Filters...................................
      //---- filter №1
      && iOpen(NULL,PERIOD_H1,1)<iClose(NULL,PERIOD_H1,1)
      //---- filter №2
      && (Hour()==0
         || Hour()==6
         || Hour()==9
         || Hour()==10
         || Hour()==11
         || Hour()==12
         || Hour()==18
         || Hour()==20
         || Hour()==22
         || Hour()==23
         )
      )
   {
   //----
      Signal.Sell=true;
   }
Then we test the created combination of filters and as a result we obtain the following report.
Balance
| Symbol | EURUSD (Euro vs US Dollar) | ||||
| Period | 1 Minute (M1) 2009.09.07 00:00 - 2010.01.26 23:59 (2009.09.07 - 2010.01.27) | ||||
| Model | All ticks (the most accurate method based on all of the least available timeframes) | ||||
| Parameters | Lots = 0.1; Symb.magic = 9001; nORD.Buy = 5; nORD.Sell = 5; | ||||
| Bars in history | 133967 | Modeled ticks | 900848 | Modeling Quality | 25.00% |
| Mismatched graphs errors | 0 | ||||
| Initial deposit | 10000.00 | ||||
| Net profit | 6221.18 | Gross profit | 20762.67 | Gross loss | -14541.49 |
| Profitability | 1.43 | Expected payoff | 5.47 | ||
| Absolute drawdown | 1095.86 | Maximum drawdown | 3332.67 (20.13%) | Relative drawdown | 20.13% (3332.67) |
| Total transactions | 1138 | Short positions (won%) | 584 (58.39%) | Long positions (won%) | 554 (61.19%) |
| Profit trades (% of total) | 680 (59.75%) | Loss trades (% of total) | 458 (40.25%) | ||
| Largest | profitable trades | 201.00 | losing trades | -159.00 | |
| Average | profitable trades | 30.53 | losing trades | -31.75 | |
| Maximum Number | consecutive wins (profit) | 28 (1240.15) | consecutive losses (loss) | 16 (-600.17) | |
| Maximum | consecutive profit (count of wins) | 1240.15 (28) | consecutive loss (count of losses) | -883.85 (10) | |
| Average | consecutive wins | 5 | consecutive losses | 3 | |
")
Figure 9. Graph of balance changes.Two filters: P-filter + D-filter (simple addition)
However, these two filters can be connected in another way. Assume that filter number 1 is configured better than filter number 2. Thus, we need to build a new D-filter. The Expert Advisor's code will look the follows way. We launch the tester in an optimized mode and obtain the characteristics of filter number 2 (trading by the hour).
   //+---------------------------------------------------------------------------------+
   //   BUY Signals
   //+---------------------------------------------------------------------------------+
   if(true
      && High[0]<iLow(NULL,PERIOD_H1,1)
      && ORD.Buy<nORD.Buy
   //.........................................Filters...................................
      //---- filter №1
      && iOpen(NULL,PERIOD_H1,1)>iClose(NULL,PERIOD_H1,1)
      //---- filter №2
      && Hour()==Filter.Hour
      )
   {
   //----
      Signal.Buy=true;
   }
   //+---------------------------------------------------------------------------------+
   //   SELL Signals
   //+---------------------------------------------------------------------------------+
   if(true
      && Low[0]>iHigh(NULL,PERIOD_H1,1)
      && ORD.Sell<nORD.Sell
   //.........................................Filters...................................
      //---- filter №1
      && iOpen(NULL,PERIOD_H1,1)<iClose(NULL,PERIOD_H1,1)
      //---- filter №2
      && Hour()==Filter.Hour
      )
   {
   //----
      Signal.Sell=true;
   }

Figure 10. The changes in profit according to time for the two D-filters. Comparative analysis
Indeed, the response characteristics of the filter have changed. And that's no wonder considering that by adding filter number 1 to the Expert Advisor, we have changed its properties. Consequently, it is necessary to change the mask for filter number 2.
")
Figure 11. Characteristics of the filter № 2 response. D-filtering by the hour (Optimized)
Final view of the Expert Advisor code.
   //+---------------------------------------------------------------------------------+
   //   BUY Signals
   //+---------------------------------------------------------------------------------+
   if(true
      && High[0]<iLow(NULL,PERIOD_H1,1)
      && ORD.Buy<nORD.Buy
   //.........................................Filters...................................
      //---- filter №1
      && iOpen(NULL,PERIOD_H1,1)>iClose(NULL,PERIOD_H1,1)
      //---- filter №2
      && (Hour()==0
         || Hour()==1
         || Hour()==6
         || Hour()==7
         || Hour()==9
         || Hour()==10
         || Hour()==12
         || Hour()==14
         || Hour()==15
         || Hour()==18
         || Hour()==20
         || Hour()==22
         || Hour()==23
         )
      )
   {
   //----
      Signal.Buy=true;
   }
   //+---------------------------------------------------------------------------------+
   //   SELL Signals
   //+---------------------------------------------------------------------------------+
   if(true
      && Low[0]>iHigh(NULL,PERIOD_H1,1)
      && ORD.Sell<nORD.Sell
   //.........................................Filters...................................
      //---- filter №1
      && iOpen(NULL,PERIOD_H1,1)<iClose(NULL,PERIOD_H1,1)
      //---- filter №2
      && (Hour()==0
         || Hour()==1
         || Hour()==6
         || Hour()==7
         || Hour()==9
         || Hour()==10
         || Hour()==12
         || Hour()==14
         || Hour()==15
         || Hour()==18
         || Hour()==20
         || Hour()==22
         || Hour()==23
         )
      )
   {
   //----
      Signal.Sell=true;
   }
Balance
| Symbol | EURUSD (Euro vs US Dollar) | ||||
| Period | 1 Minute (M1) 2009.09.07 00:00 - 2010.01.26 23:59 (2009.09.07 - 2010.01.27) | ||||
| Model | All ticks (the most accurate method based on all least available timeframes) | ||||
| Parameters | Lots = 0.1; Symb.magic = 9001; nORD.Buy = 5; nORD.Sell = 5; | ||||
| Bars in history | 133967 | Modeled ticks | 900848 | Modeling Quality | 25.00% |
| Mismatched graphs errors | 0 | ||||
| Initial deposit | 10000.00 | ||||
| Net profit | 5420.54 | Gross profit | 22069.48 | Gross loss | -16648.94 |
| Profitability | 1.33 | Expected payoff | 3.77 | ||
| Absolute drawdown | 826.86 | Maximum drawdown | 2141.24 (14.06%) | Relative drawdown | 14.06% (2141.24) |
| Total transactions | 1439 | Short positions (won%) | 758 (61.87%) | Long positions (won%) | 681 (64.46%) |
| Profit trades (% of total) | 908 (63.10%) | Loss trades (% of total) | 531 (36.90%) | ||
| Largest | profitable trade | 157.00 | losing trade | -154.00 | |
| Average | profitable trade | 24.31 | losing trade | -31.35 | |
| Maximum Number of Defects | consecutive wins (profit) | 30 (772.70) | consecutive losses (loss) | 16 (-562.17) | |
| Maximum | consecutive profit (count of wins) | 1091.32 (22) | consecutive loss (count of losses) | -926.15 (15) | |
| Average | consecutive wins | 5 | consecutive losses | 3 | |

Figure 12. Graph of balance changes as a result of optimizing the characteristics of the two filters
For make the analysis of reports easier, we create the following table.
| No filtering | Addition | Optimization | |
|---|---|---|---|
| Initial deposit | 10000.00 | 10000.00 | 10000.00 |
| Net profit | 4408.91 | 6221.18 | 5420.54 |
| Gross profit | 32827.16 | 20762.67 | 22069.48 |
| Gross loss | -28418.25 | -14541.49 | -16648.94 |
| Profitability | 1.16 | 1.43 | 1.33 |
| Expected payoff | 1.34 | 5.47 | 3.77 |
| Absolute drawdown | 273.17 | 1095.86 | 826.86 |
| Maximum drawdown | 3001.74 (20.36%) | 3332.67 (20.13%) | 2141.24 (14.06%) |
| Relative drawdown | 20.36% (3001.74) | 20.13% (3332.67) | 14.06% (2141.24) |
| Total transactions | 3284 | 1138 | 1439 |
| Short positions (won%) | 1699 (64.98%) | 584 (58.39%) | 758 (61.87%) |
| Long positions (won%) | 1585 (65.68%) | 554 (61.19%) | 681 (64.46%) |
| Profitable trades (% of total) | 2145 (65.32%) | 680 (59.75%) | 908 (63.10%) |
| Losing trades (% of total) | 1139 (34.68%) | 458 (40.25%) | 531 (36.90%) |
| Largest | |||
| profitable trade | 82.00 | 201.00 | 157.00 |
| losing trade | -211.00 | -159.00 | -154.00 |
| Average | |||
| profitable trade | 15.30 | 30.53 | 24.31 |
| losing trade | -24.95 | -31.75 | -31.35 |
| Maximum Number of | |||
| consecutive wins (profit) | 29 (679.00) | 28 (1240.15) | 30 (772.70) |
| consecutive losses (loss) | 16 (-290.34) | 16 (-600.17) | 16 (-562.17) |
| Maximum | |||
| consecutive profit (number of wins) | 679.00 (29) | 1240.15 (28) | 1091.32 (22) |
| consecutive loss (number of losses) | -1011.00 (10) | -883.85 (10) | -926.15 (15) |
| Average | |||
| consecutive win | 5 | 5 | 5 |
| consecutive loss | 3 | 3 | 3 |
Tab.2 Comparative table of testing reports of the combination of two filters: P-filter and D-filter
Analysis of results:
- If we make the comparison based on the criteria of revenue, profit, and expected profit, then the best results were obtained when we added the two filters.
- If we focus on the drawdown, then the winner is the filter optimization option.
- In any case, filtering improves the ATS characteristics.
Conclusion
- So what is the magic filter? The magic is in its simplicity and the ability to change the characteristics of any Expert Advisor.
- The proposed technology of filter creation is not designed for simple copying. It only shows how a P-filters and D-filters can be developed for a particular Expert Advisor. A filter, which is suitable for one Expert Advisor, may hinder another.
- And remember, an ideal ATS does not need a filter! ... You dream to create such a system don't you?
- I know that this code of the Expert Advisor and filters is not optimized and certainly not ideal. But for the purposes of this article we selected this particular style of programming. This was done so that any "dummie" would be able to repeat the above process, and create his own unique filters.
- ATTENTION! Do not use in real trading the Expert Advisor considered in this article!