
Indicator Alternative Ichimoku – Setup, Examples of Usage

Introduction
Why did Alternative Ichimoku appear? Because there is no limit of perfection. Of course, at first the author thought that he developed an indicator even better than the famous Ichimoku Kinko Hyo. Then, selecting indicators' parameters and comparing them together it became clear that the popularity of Ichimoku Kinko Hyo is deserved and this indicator works much better if an analyst or trader clearly understands how to attach an indicator to a chart, what parameters to choose.
The author had to occupy himself with graphical indicators mathematics. And the thorough analysis of construction mathematics of both indicators showed that both have their own advantages. And their disadvantages are determined first of all by the incomprehension of the way these indicators should be used or attached to a necessary chart. This article will help you understand this and give you the main methods of a correct indicator application on a chart.
Graphical analysis is widely used by traders. After the appearance of user-friendly client terminals, allowing to develop one's own indicator, the number of graphical tools increased greatly. The practice of using graphical indicators in technical analysis reflects the convenience of usage and graphical visualization. And some indicators of graphical analysis give a rather true forecast.
However, the rate of true forecasting for currencies is by far lower, than that
for stock. With stock everything is more or less clear: uptrend or downtrend. Intermediary
temporary intervals are very rare. In forecasting currencies curves such situations
(no trend) appear constantly. What decision should be made in such cases? The indicator
Alternative Ichimoku will help in such difficult cases to estimate the situation
and make a right decision.
Indicator Ichimoku Kinko Hyo
The technical indicator Ichimoku Kinko Hyo is used for determining support and resistance
levels as well as the time for entering the market when the lines are broken through.
Mathematics of the Indicator Ichimoku Kinko Hyo
The indicator uses four time intervals, which are determined by three parameters of the indicator.
Time intervals:
- Tenkan-sen shows the average price value during the first time interval defined as the sum of maximum and minimum within this time, divided by two;
- Kijun-sen shows the average price value during the second time interval;
- Senkou Span A shows the middle of the distance between two previous lines shifted forwards by the value of the second time interval;
- Senkou Span B shows the average price value during the third time interval shifted forwards by the value of the second time interval.
The distance between Senkou lines is hatched by another color and is called "Cloud". Chinkou Span shows the closing price of the current candlestick, shifted to the past by the value of the second time interval.
Well-Known Rules of Operation with the Indicator Ichimoku Kinko Hyo
Cloud:
- If a price is between Senkou Span A and Senkou Span В (inside the cloud), the market is considered non-trendous and the cloud edges form support and resistance levels.
- If a price is above the cloud, the upper line makes up its first support level, the lower one - the second support level.
- If a price is below the cloud, the lower line makes up its first resistance level, the upper one - the second resistance level.
Kijun:
- Kijun-sen is used as a sign of market movement. If a price is higher than this line, prices are likely to continue rising. When the prices cross this line, the trend is more likely to change. Another variant of using Kijun-sen is generating signals. The signal to buy is generated, when the line Tenkan-sen crosses Kijun-sen bottom-upwards. Downwards - signal to sell.
Tenkan:
- Tenkan-sen is used as an indicator of the market trend. If this line rises or falls, the trend exists. When it is horizontal, the market has entered a channel.
Chinkou Span:
- Many sources refer to this line as the main line in the indicator. The signal to buy is generated, when the line Chinkou Span crosses the price bottom-upwards. Downwards - signal to sell.
Rules of Setting the Parameters of the Indicator Ichimoku Kinko Hyo
This indicator has three parameters:
- The first parameter influences Tenkan-sen and Senkou Span А.
- The second parameter influences all time intervals, except Tenkan-sen.
- The third parameter influences only Senkou Span B.
In such positions consequence it is natural to start setting up the indicator from the first parameter, analyzing the position of the line Tenkan-sen, disregarding all other lines. What should we get when setting up the parameter?
First, what we should see, is that the set line can be placed below, above or near bars on the current currency pair chart. And this line will be either a support line or a resistance line. It is not recommended to place the line so, that it crosses any candlestick shadows. Let the line be maximally close to the envelope that joins the shadow ends, but without crossing it.
Of course, it is impossible to place the line so, that it does not cross the bars at all. But it can be placed with minimal crossing. The second setup stage consists in checking its touching the shadows, in both cases - when the line is above the bars, and when it is below the line. For Tenkan-sen this setup rule consists in the selecting the first indicator parameter for touching the candlestick shadows on the downtrend and on the uptrend.
The Main Parameters of the Indicator Alternative Ichimoku
For setting the indicator Alternative Ichimoku two calculation values are used.
The value SSP denotes the shift (delay) of the first ("priority") line
of the cloud. The position of the currency outside the cloud is a certain sign
of a trend existence.
The value SSK determines the shift (delay) of the second ("overdue") line of the cloud. The exit of currencies from the cloud signals about a trend change. The second value of this line is a stop-order of the second level. A line inside the cloud (stop-order line) is calculated by some coefficient from the value SSP. The coefficient was formed in practice and that is why levels of this line correspond with their names. When the stop-order line is broken through, the probability of trend turn is very high.
Setting up SSP
When setting up this parameter, we need to choose such position of the cloud, in which Close levels do not cross the stop-order line inside the cloud. Another way: candlestick extremums (High or Low) do not cross the stop-order line. One more SSP setup variant: extremums do not cross the forward line.
It is more convenient to choose SSP values for graph intervals with a sharp trend pivot. The parameter should be set up so, that maximums and minimums of candlesticks or their shadows touch the stop-order line (or priority line). If such touches exist both in uptrend and downtrend, we can say that SSP parameter is set up correctly.
Example 01: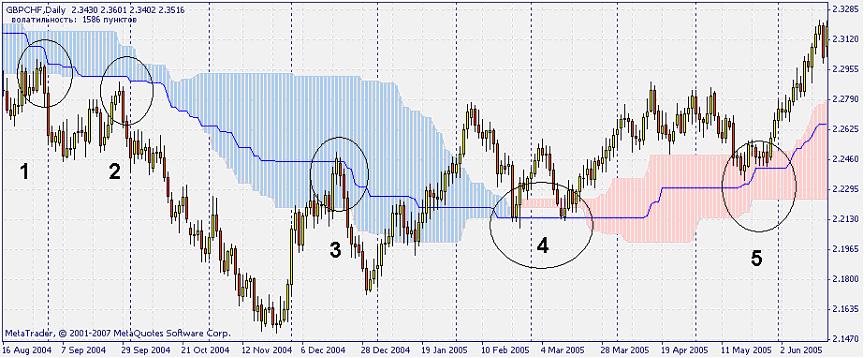
- Stop-order line limits the price from above.
- Stop-order line limits the price from above.
- Stop-order line limits the price from above. False break through upon Close. The next candlestick is closed below the line.
- Stop-order line limits the price from below. Though Low broke through the line, Close almost precisely corresponds to stop-order line in both cases.
- Stop-order line limits the price from below.
I will say it once again: in a correct setup, stop-order line limits the price both as a support level and a resistance level.
Example 02:
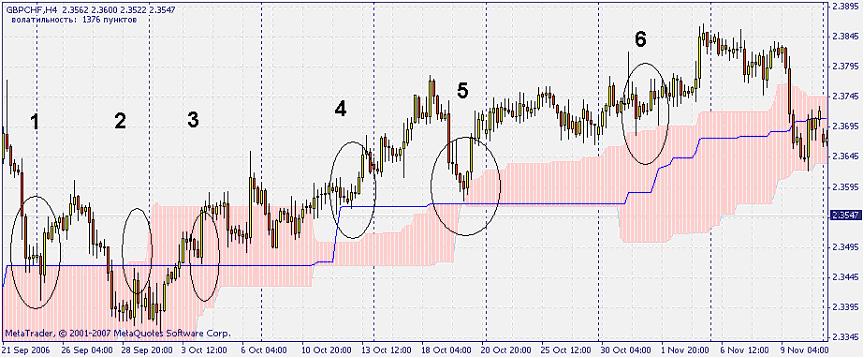
For this example it is extremely difficult to choose SSP parameters. That is why
in such difficult cases we should use both the priority cloud line and stop-order
line for a correct setup of SSP parameter:
- Stop-order line limits the price from below. False break through upon Close.
- Stop-order line limits the price from above.
- Stop-order line limits the price from below.
- Stop-order line limits the price from below.
- Stop-order line limits the price from below. Here the price does not cross the priority indicator line. In such a slow uptrend the priority indicator line can be confused with a resistance line or a support line.
- The forward indicator line limits the price from below. Accordingly, the further
break through of the priority line will be a sign of the uptrend end.
Example 03:
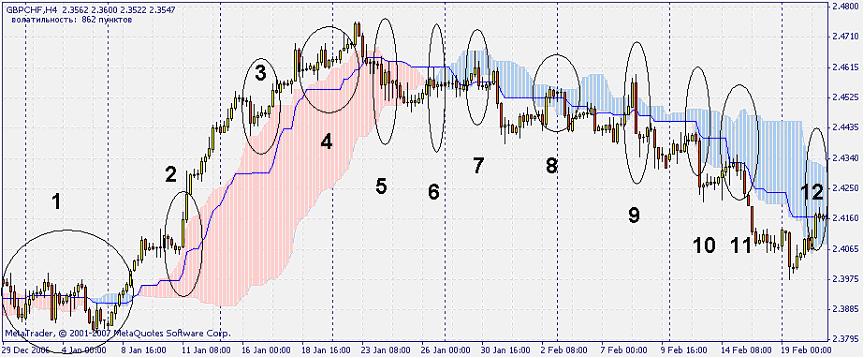
- There are intervals, when any indicator is helpless - this is the case.
- The decision was made to orient in a quick market upon the priority cloud line - the priority line limits the price from below.
- Orient upon the forward cloud line - the priority line limits the price from below.
- Orient upon the forward cloud line - the priority line limits the price from below.
- Stop-order line limits the price from above.
- Stop-order line limits the price from above.
- Such a break through of the stop-order line and the fact, that High touches the overdue line, is just a coincidence. Forecasting here cannot be made.
- And this place and the continuing non-exit above the stop-order line is a sign of a possible movement downwards.
- Typical false break through with 2 long candlesticks. No one is insured against it.
- Stop-order line limits the price from above.
- Stop-order line limits the price from above.
- Stop-order line limits the price from above.
Setting up SSK
The overdue indicator line is behind the priority one in SSK bars. Exactly this line can tell us about a trend rise or fall. Its meaning is not very large - to show rise or fall. The overdue line can be used as an additional level of support and resistance lines. It is used in quite difficult cases, for example when there is neither clear trend nor clear flat. These levels are located at the very end of the cloud.
Example 04:
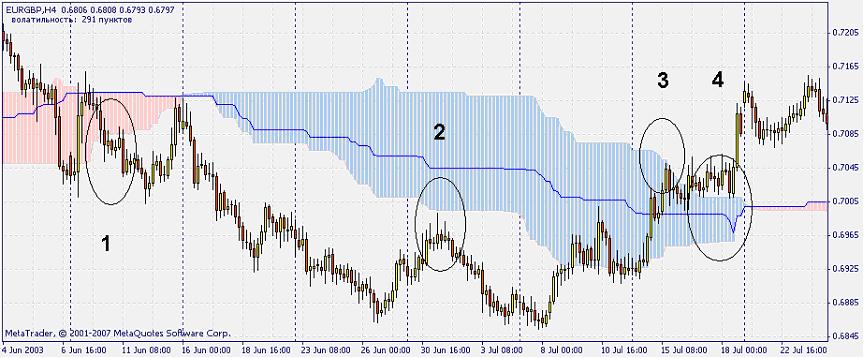
- Choosing the value of the parameter SSK allows seeing the overdue line as a resistance line.
- Here is the moment, connected with SSP parameter setting, i.e. the priority line is setup as a support-resistance line.
- Choosing the value of the parameter SSK allows seeing the overdue line as a resistance line. If SSK is set up correctly, such a retreat from the overdue line will be repeated several times on this chart.
- Choosing the value of the parameter SSK allows seeing the overdue line as a support
line.
Conclusion
The author tried to explain the main principles of choosing the indicator parameters applicable to the current currency pair chart. The small number of the indicator parameters allows easy setting up of parameters based on the given description. Except Alternative Ichimoku setup, the article gives the principles of setting up, suitable also for the indicator Ichimoku Kinko Hyo. This allows a reader using both indicators with better efficiency.
The source code of the indicator Alternative Ichimoku is located at: https://www.mql5.com/en/code/7070
Translated from Russian by MetaQuotes Ltd.
Original article: https://www.mql5.com/ru/articles/1469
Warning: All rights to these materials are reserved by MetaQuotes Ltd. Copying or reprinting of these materials in whole or in part is prohibited.
This article was written by a user of the site and reflects their personal views. MetaQuotes Ltd is not responsible for the accuracy of the information presented, nor for any consequences resulting from the use of the solutions, strategies or recommendations described.

 MetaTrader 4 Working under Antiviruses and Firewalls
 How to Make the Detection and Recovery of Errors in an Expert Advisor Code Easier
 Transferring an Indicator Code into an Expert Advisor Code. Indicator Structure
 Three-Dimensional Graphs - a Professional Tool of Market Analyzing
- Free trading apps
- Over 8,000 signals for copying
- Economic news for exploring financial markets
You agree to website policy and terms of use
Very interesting study. I have read quite a bit about Ichy, but I fail to see how it can be translated into an Expert Advisor. Has anyone attempted this?
I have also discovered that all the essential components (TS, KS, SSA, SSB) can be easily approximated by . Could this combination of moving averages be used to produce a workable Expert Advisor version of Ichy? Thanks for your comments.
This is realy the most easy way to follow the trend !
I use you indicator with only the Tenkan Sen line (red one) from the original Ichi-indicator.
But as price indicator, i use Renko bars, set @ 3 pips, so i'm not affected by time but only trade on pure PRICE ACTION.
Thank you again for this wonderful indicator, you don't need anything else if one want to trade the trend.
Gilbert
(Belgium)