
Three-Dimensional Graphs - a Professional Tool of Market Analyzing
Introduction
All traders operate with constantly changing prices and quotes. Everyone searches correspondences and regularities. We analyze volumes, values of different indicators and many other parameters. I don't think it necessary to persuade you of MQL4 benefits in terms of market analysis. You simply write a script and make conclusions based on results. Usually analysis is conducted upon charts or graphs that reflect a certain correspondences of two variables. All this is fine, of course, but sometimes we need to find the correspondences of three variables and visualize them. For this purpose 3D graphs and their analysis are used all over the world. Such approach saves your time and money.
In this article we will write a simple library for the construction of 3D graphs and their further viewing in Microsoft Excel. We will use standard MQL4 options to prepare and export data into *.csv file
What Is the File Format *.csv?
It is a text file, which stores the succession of values, separated by a preset separator, in our case it is a semicolon - ";". For drawing a table we simply need to write several code strings. The advantage of this format is that it is easily recognized and interpreted in the form of a table by Microsoft Excel. And in this program we can easily create a 3D graph based on the acquired data and analyze it.
Library generateCsv
For quick and easy data entering we will create a library. So, create a new library and insert the code below, save it under the name generateCsv.mq4 in the folder "...MetaTrader\experts\libraries". After that compile the library.
//+------------------------------------------------------------------+
//|                                                  generateCsv.mq4 |
//|         Copyright © 2006, Antonio Banderass. All rights reserved |
//|                                               banderassa@ukr.net |
//+------------------------------------------------------------------+
#property copyright "Copyright © 2006, Antonio Banderass. All rights reserved"
#property link      "banderassa@ukr.net"
#property library

//+------------------------------------------------------------------+
//| PrepareString                                                    |
//+------------------------------------------------------------------+

string PrepareString(string s)
  {
   bool exit = false;
   int index = 0;
   string str = s;

   while(!exit)
     {
       index = StringFind(str, ".", index);

       if(index > -1)
           str = StringSetChar(str, index, ',');
       else
           exit = true;
     }
   return(str);
  }


//+------------------------------------------------------------------+
//| GenerateCsv                                                      |
//+------------------------------------------------------------------+
int GenerateCsv(string fileName, int arraySizeX, int arraySizeY,
                double arrayIndexX[], double arrayIndexY[], double arrayZ[][])
  {
   int handle = FileOpen(fileName, FILE_CSV|FILE_WRITE, ' '), x, y;
   string str;

   if(handle1)
     {
       Print("Error:", GetLastError());
       return(handle);
     }
   else
     {
       str = ";";
       for(x = 0; x < arraySizeX; x++)
         {
           str = str + arrayIndexX[x];
           str = str + ";";
         }
       FileWrite(handle,PrepareString(str));

       for(y = 0; y < arraySizeY; y++)
         {
           str = "";
           str = str + arrayIndexY[y] + ";";

           for(x = 0; x < arraySizeX; x++)
             {
               str = str + arrayZ[x,y];
               str = str + ";";
             }
           FileWrite(handle, PrepareString(str));
         }
     }

   FileClose(handle);
   return(handle);
  }
Now create a new header file for the access to the library functions, named generateCsv. mqh, insert the below code and save in the folder "...MetaTrader\experts\include".
//+------------------------------------------------------------------+
//|                                                  generateCsv.mqh |
//|         Copyright © 2006, Antonio Banderass. All rights reserved |
//|                                               banderassa@ukr.net |
//+------------------------------------------------------------------+
#property copyright "Copyright © 2006, Antonio Banderass. All rights reserved"
#property link "banderassa@ukr.net"

#import "generateCsv.ex4"

string PrepareString(string s);
int GenerateCsv(string fileName, int arraySizeX, int arraySizeY,
double arrayIndexX[], double arrayIndexY[],double arrayZ[][]);
This simple library consists of two functions. Let us view the meaning of each function. The first function PrepareString is intended for substituting points in a string by commas. The fact is, when writing data into a file using the standard function FileWrite the integer and the fractional parts are separated by a point. And this is unacceptable for us, because Microsoft Excel recognizes decimals only if the parts are separated by a comma. That is why when placing data into the file *.csv we call this function in the body of the function GenerateCsv. The only one parameter of the function is a string, where we need to replace points by commas. Return the value - a new string without points. Please note, that you do not need to call this function, it is done by the second function automatically, when needed.
The function GenerateCsv is used for writing data in *.csv format into a file. Here are its parameters:
int GenerateCsv(string fileName, int arraySizeX, int arraySizeY,
                double arrayIndexX[], double arrayIndexY[], double arrayZ[][]);
- string fileName - name of a file for writing, do not forget to indicate the format *.csv;
- int arraySizeX - width of the array with data;
- int arraySizeY - height of the array with data;
- double arrayIndexX[] - array of the first variable values;
- double arrayIndexY[] - array of the second variable values;
- double arrayZ[][] - two-dimensional array of the third variable values;
In order to understand the purpose of each parameter, look at the picture:

So all you need for writing this data is three value arrays for each variable. Now let us see how it works.
Using the Library generateCsv
Create a new script named 3dGraphicOut and insert the below code in it.
//+------------------------------------------------------------------+
//|                                                 3dGraphicOut.mq4 |
//|         Copyright © 2006, Antonio Banderass. All rights reserved |
//|                                               banderassa@ukr.net |
//+------------------------------------------------------------------+
#property copyright "Copyright © 2006, Antonio Banderass. All rights reserved"
#property link      "banderassa@ukr.net"

#include <generateCsv.mqh>

#define ARRAY_SIZE_X 16
#define ARRAY_SIZE_Y 16

//+------------------------------------------------------------------+
//| start                                                            |
//+------------------------------------------------------------------+
int start()
  {

   int x,y;

   double arrayIndexX[ARRAY_SIZE_X];
   double arrayIndexY[ARRAY_SIZE_Y];
   double arrayZ[ARRAY_SIZE_X,ARRAY_SIZE_Y];


   for(x=0;x<ARRAY_SIZE_X;x++)
      arrayIndexX[x]=x/10.0;

   for(y=0;y<ARRAY_SIZE_Y;y++)
      arrayIndexY[y]=y/10.0;

   for(x=0;x<ARRAY_SIZE_X;x++)
      for(y=0;y<ARRAY_SIZE_Y;y++)
         arrayZ[x,y]=MathSin(arrayIndexX[x]+arrayIndexY[y]);

   GenerateCsv("test.csv",ARRAY_SIZE_X,ARRAY_SIZE_Y,arrayIndexX,arrayIndexY,arrayZ);
   return(0);
  }
This is a standard template, from which every 3D graph should start. Let us view each line separately:
#include <generateCsv.mqh>
Start the library generateCsv.
#define ARRAY_SIZE_X 16
#define ARRAY_SIZE_Y 16
Here we define the dimensions of the table: ARRAY_SIZE_X - width of the table, ARRAY_SIZE_Y - height.
int x,y;
These are two array indexes. As they are used many times, I placed them outside the cycle body.
double arrayIndexX[ARRAY_SIZE_X];
This is an array of values of the first variable. Suppose you analyze the influence of two indicators upon profit. In this case the values of the first indicator will be located in this array. Please note that you should start with some start value, for example from zero, and then increase it with a certain step, for example 0. 5.
double arrayIndexY[ARRAY_SIZE_Y];
The values of the second indicator are placed in this array. Also choose the appropriate start value and step.
double arrayZ[ARRAY_SIZE_X,ARRAY_SIZE_Y];
And this one should contain the profit value, depending on the indicator values. Once again look at the above picture to understand the values.
Pay attention, that the array type is double. This makes them universal. If you use integers (int) as the elements of the arrays, it is also ok, because MQL4 has an implicit type transformation.
for(x = 0; xARRAY_SIZE_X; x++)
  {
    // arrayIndexX[x]= ... ;
  }
In this block we fill in the first variable array with values. Do not forget, they should be increased with a certain step.
for(y = 0; y < ARRAY_SIZE_Y; y++)
   {
      // arrayIndexY[y]= ... ;
   }
The same is for the second variable.
for(x = 0; x < ARRAY_SIZE_X; x++)
   {
     for(y = 0; y < ARRAY_SIZE_Y; y++)
       {
         // arrayZ[x,y]= ... ;
       }
   }
And here is the most interesting part of the template: we fill in the two-dimensional array with values depending on two other variables.
GenerateCsv("test.csv",ARRAY_SIZE_X,ARRAY_SIZE_Y,arrayIndexX,arrayIndexY,arrayZ);
And finally we write the data into the file for further analysis in Microsoft Excel. Now save this template for further usage.
A Simple Example
Let us view a very simple example of using the library. I intentionally did not write the example, connected with trading, to make the code maximally simple and available.
//+------------------------------------------------------------------+
//|                                                 3dGraphicOut.mq4 |
//|         Copyright © 2006, Antonio Banderass. All rights reserved |
//|                                               banderassa@ukr.net |
//+------------------------------------------------------------------+
#property copyright "Copyright © 2006, Antonio Banderass. All rights reserved"
#property link      "banderassa@ukr.net"

#include <generateCsv.mqh>

#define ARRAY_SIZE_X 16
#define ARRAY_SIZE_Y 16

//+------------------------------------------------------------------+
//| start                                                            |
//+------------------------------------------------------------------+
int start()
  {
   int x,y;

   double arrayIndexX[ARRAY_SIZE_X];
   double arrayIndexY[ARRAY_SIZE_Y];
   double arrayZ[ARRAY_SIZE_X,ARRAY_SIZE_Y];


   for(x=0;x<ARRAY_SIZE_X;x++)
      arrayIndexX[x]=x/10.0;

   for(y=0;y<ARRAY_SIZE_Y;y++)
      arrayIndexY[y]=y/10.0;

   for(x=0;x<ARRAY_SIZE_X;x++)
      for(y=0;y<ARRAY_SIZE_Y;y++)
         arrayZ[x,y]=MathSin(arrayIndexX[x]+arrayIndexY[y]);

   GenerateCsv("test.csv",ARRAY_SIZE_X,ARRAY_SIZE_Y,arrayIndexX,arrayIndexY,arrayZ);

   return(0);
  }
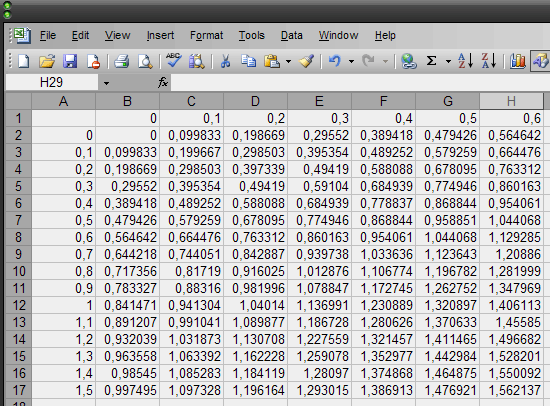
Save the text script, compile it and start in the terminal. Now open the folder "...MetaTraider\experts\files\", a new file "test.csv" appeared there. Open it using Microsoft Excel. The file will be transformed into a two-dimensional table, as shown below:
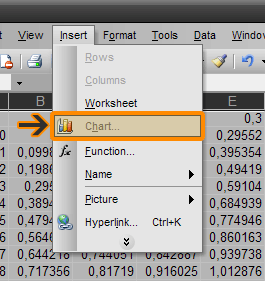
Now select all cells (CTRL+A) and enter Insert -> Chart (ALT+I,H):
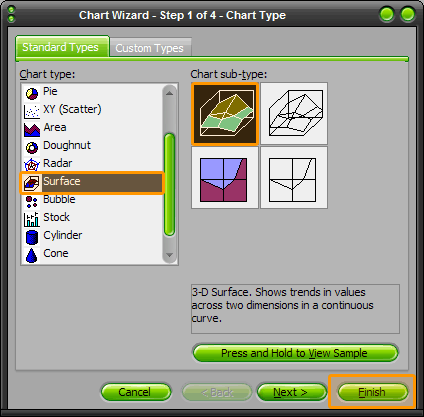
Then choose Chart Type -> Surface, Chart sub-type -> 3D-Surface and click Finish:
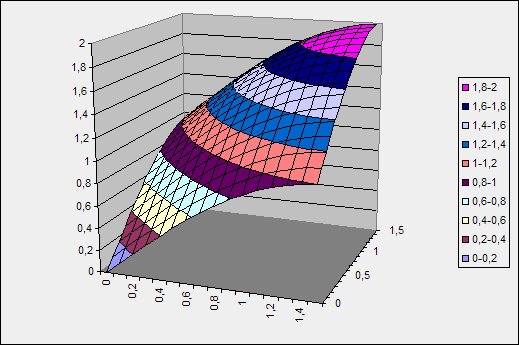
After that a 3D graph will appear:
Conclusion
Now available for you is a convenient tool for a quick data export from the trading terminal MetaTrader into the program Microsoft Excel for a quick construction of 3D graphs and their further analysis. Now you can analyze Forex correspondences and regularities between three variables simultaneously. Try to analyze 3D histograms of profit dependence on such parameters as TakeProfit and StopLoss or see, how a chart of volumes' dependence on the current weekday and hour looks like. I think you will find a lot of interesting and useful correspondences.
Warning: All rights to these materials are reserved by MetaQuotes Ltd. Copying or reprinting of these materials in whole or in part is prohibited.
This article was written by a user of the site and reflects their personal views. MetaQuotes Ltd is not responsible for the accuracy of the information presented, nor for any consequences resulting from the use of the solutions, strategies or recommendations described.
 How to Make the Detection and Recovery of Errors in an Expert Advisor Code Easier
 Practical Application of Cluster Indicators in FOREX
 Indicator Alternative Ichimoku – Setup, Examples of Usage
 Break Through The Strategy Tester Limit On Testing Hedge EA
- Free trading apps
- Over 8,000 signals for copying
- Economic news for exploring financial markets
You agree to website policy and terms of use
Sorry for simple questions I'm very new to coding.
Just a little bug.
At the line
the code must be:
if you see the results of the Z array there are greater than 1 and it's not possible in a Sinus, but in fact they approach to 2, the sum of the x and y sinus...
Hello,
I would like to ask for support.
When I drag&drop the script into a price chart no new file "test.csv" appeared there.
I've also corrected the line as specified in the comment by "moneymakers", had no compiling errors and seemingly everything is placed where it should be.
Kind regards,
serendippo