
DRAKON visual programming language — communication tool for MQL developers and customers
Introduction
The DRAKON language was developed jointly by the Federal Space Agency (Academician Pilyugin Center, Moscow) and the Russian Academy of Sciences (Keldysh Institute of Applied Mathematics, Moscow) as a result of experience gained when working on the Buran spacecraft project.
Parondzhanov V. D.
Once upon a time, glasnost came to USSR making the previously classified DRAKON (literally meaning Friendly Russian Algorithmic Language Which Provides Clarity) language available to the wider public. Currently, the main popularizer of this language is Parondzhanov V. D. He created a website dedicated to this language in addition to participating in workshops and writing books. Thanks to his dedication, DRAKON is now used by chemists and doctors.
Other enthusiasts started developing translators from this language to more widely used programming languages, such as C, C++, TCL/TK, Java, JavaScript, etc. In fact, the list is much longer. If necessary, it can be expanded, since all the editors I know generate easily readable files (plain text - *.csv, *.xml; databases - SQLight...). Many of these programs have open source code for the rules of translation to other algorithmic languages.
Unlike many other programming languages of today, DRAKON is not "symbolic", but graphical. Any algorithms in it are literally drawn on the screen using special icons. These icons are combined into algorithms according to intuitive rules. The resulting diagrams are so simple and understandable that even a non-programmer can understand them. Then these diagrams can be converted into working programs with one click...
Let's recall the concept of an algorithm.
Algorithm is a clear and understandable description guiding the performer through certain processes to solve a specific task.
There may be better definitions but I will stick to this one.
According to this definition, an algorithm is a way of solving a problem using the efforts of a performer. Ideally, a ready-made algorithm should be comprehensible for someone (or something) else as well.
Suppose that I have created an algorithm for an extremely profitable EA that trades using a complex sinusoidal martingale. The signal changes depending on the length of the candle, which is an exponential fraction of the day of the week from the current one, and the phase of the previous formation of 10 peaks. Pretty easy, right? No??? Well, but I have explained everything!!!
If you are a developer, then what should I do to let you understand? Most likely, I should draw a diagram so that you can understand what to do in terms of coding. After the diagram is ready, it can be signed as an ordinary requirements specification. Now you are ready to convert it into code...
This is what a drawing in DRAKON format looks like.
If you are a programmer and have drawn this diagram yourself, then it is often enough to press a few keys to get operational code from it or at least create a reliable framework, which can then be adjusted using a series of auto corrects.
If you are a customer, then it will be much easier for you to explain to the programmer what you want if you show a diagram that clearly describes what to do in certain cases.
For example, when two MAs cross, we only need to remember the signal and trade at the moment when the price rebounds from the "junior" average, but no later than 19:00 local time.
Of course, you can describe all this in words.
But you can also draw a diagram where you ask the computer (or, more precisely, the abstract performer) simple questions like: "Does the current exceed 19?" or "Have the averages crossed?" and describe what to do if the answer is "yes" and what to do if the answer is "no".
This will not decrease the load of the programmer’s technical work, but at least they will understand your thoughts much better, and there is less chance that they will make mistakes in the first versions. These errors will have eventually to be corrected, which may require additional time (and/or money).
In general, DRAKON diagrams are beneficial both for programmers and customers who are unfamiliar with programming but have a very good understanding of how exactly they want their EAs to work.
To put it simply:
- The language is structured in such a way that it really helps you think. When I see an algorithm in the form of a diagram, it is much easier for me to understand the relationships between parts in the modules, as well as between the modules themselves, find errors and use solutions that might not seem obvious without a diagram.
- DRAKON helps to better understand the customer.
- It is easier to convey my proposals to the customer if any arise.
- It is easier for the customer to criticize my mistakes.
- If the customer has drawn a DRAKON diagram, it can be transferred into the code and the requirements specification can be considered completed. This is much easier than dealing with questions and issues arising during the coding itself. There may be some features that are obvious to the customer, but not for the developer. The diagram eliminates potential misunderstandings.
For me, graphics in the algorithms is an indispensable communication tool. When two people are interested in the result and are engaged in a dialog, it is better for them to speak the same language. The language of DRAKON diagrams is universal for specialists in any branch of knowledge if you understand it once.
Basic development environments in DRAKON
In preparing this article, I used three main tools.
- First, we have Drakonhub. This is an online editor that allows drawing all types of DRAKON diagrams, has a very convenient interface but does not export diagrams to code. There is also a separate project for programmers - drakon.tech. But it works only with JavaScript (at least according to what I managed to find)... Besides, the number of diagrams available to non-programmers seems to be much less than at Drakonhub. In general, it is perfect for customers and normal for developers if they are eager to, say, implement typing for variables manually after generation... There are Russian, English and Norwegian interfaces.
- There is also Fabula (download link). The program is free and has Russian and English interface, as well as an offline application for Windows (while it is written using the QT library, it is closed source). The interface is almost perfect for me. The data is saved in XML packed with a zip archiver (this means that you can write an XSLT and broadcast your programs directly if necessary). It can trace algorithms, which can be used for presentations or creating a pseudocode. A pseudocode, in turn, can be turned into a completely working program using a series of autocorrects... Most diagrams in this article will be created using Fabula.
- Third, we have DRAKON Editor. Its interface is little less convenient, since icons should be placed manually. Besides, some icons are absent, while some captions are not implemented in the best way. On the other hand, I can convert diagrams into my MQL5 code without much preparatory work. In addition, it can highlight some keywords. Also, it is written in TCL/TK, which means it is cross-platform and, therefore, runs on Linux naturally, without Wine. The main advantage of this editor is its support for a lot of programming languages. DRAKON diagrams can be easily converted into C++, Java, JavaScript, D, TCL, Go and a bunch of other languages. So it is a very useful thing for programmers if you like DRAKON. However, the code it generates does not always look pretty. The methods for preparing files are not obvious as well. You need to read the documentation. But once you figure it out, it works quite well. The interface is in Russian and English.
- There is also IS Drakon. Its main downside for me is that it is a paid product. I did not delve deeply into its interface. It seemed similar to DRAKON Editor to me, but I did not find any particular advantages while observing it.
As I have already mentioned, most diagrams here are made using Fabula. Its diagrams seem to me the most beautiful without any complex preparation.
If a code is generated from the diagram, I will do it in DRAKON Editor.
Basic language commands
The DRAKON language was developed based on flowcharts, which were well known to programmers at that time. Therefore, the main language elements generally adhere to GOST (All-Union State) standards for block diagrams. But the main power of this development lies in the rules for placing these elements on the plane.
The first functional element of the language is "icons". An icon is a special graphical symbol that defines some action, condition or operation of an algorithm.
| Image | Name (alternatives are indicated in brackets) | Description | |||||||||||||||
|---|---|---|---|---|---|---|---|---|---|---|---|---|---|---|---|---|---|
| | Start | Starting point of the program. This is where the execution of the algorithm begins. | |||||||||||||||
 | End | Program completion. The execution of the algorithm ends here. | |||||||||||||||
| | Action (process) | A regular block of actions. It contains commands that are executed in order. | |||||||||||||||
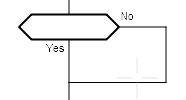 | Problem (condition, solution) | The Problem icon is used to check a condition. If the condition is met, the program follows one branch, otherwise it follows another. | |||||||||||||||
 | Selection (parsing) | Selection is a distribution node for several options. The program performs different actions depending on the conditions defined in Selection. Unlike Problem, there may be more than two options. | |||||||||||||||
 | Option | The Option icon represents a condition or execution branch associated with the Selection icon in the DRAKON language. It defines what actions should be performed if a certain condition in a Selection block is true. | |||||||||||||||
 | Branch name | The Branch name icon describes the name of a certain fragment in a given module, a certain stage of the algorithm or the state of the program. | |||||||||||||||
 | Address | Address indicates where to go after executing the branch. | |||||||||||||||
| | Insert | Insert is used to insert another diagram or block of actions into the current algorithm. This allows arranging and structuring code more densely and logically. | |||||||||||||||
 | Shelf | The Shelf icon can have several values.
| |||||||||||||||
 | Parameters | Parameters contain the input data for the algorithm. | |||||||||||||||
 | FOR loop start | The icon is usually used together with the following one. The repetition of some action a known (calculable) number of times. For example, if we need to count from 1 to 10, or iterate through all the elements in some array... | |||||||||||||||
| | FOR loop end | The icon is usually used together with the previous one. The repetition of some action a known (calculable) number of times. | |||||||||||||||
 | Output | The Output icon represents the point where the data or results of a program are transferred to the user, another part of the program or external devices. The top part contains a keyword or key phrase. Usually there is a verb there. The bottom part contains an object or descriptive information. | |||||||||||||||
 | Input | Input indicates the location where the program waits to receive input from a user, another program or external sources. Just like an input, it contains a top and a bottom. | |||||||||||||||
 | Pause | Pause indicates the moment the program is paused until a certain event or time. | |||||||||||||||
 | Timer | Timer is used to control time intervals and plan actions. Often used with the Time icon. | |||||||||||||||
 | Time | Time visualizes operations related to time and its accounting. It allows the program to track time intervals and events. | |||||||||||||||
 | Parallel process | Parallel process controls the execution of a task that runs simultaneously with the main program. Parallel process runs in the background and its algorithm is defined in another DRAKON diagram. The main process continues to run without waiting for the parallel task to complete. Communication with a parallel process can be established using the Input and Output icons. | |||||||||||||||
 | Main line comment | Main line comment helps make the diagram clearer. It does not affect the program operation, but makes it possible to clarify an unclear fragment. | |||||||||||||||
| | Right and left comments. | The right and left comment icons allow commenting on any action specifically where it occurs. Typically, variables and parameters are explained. | |||||||||||||||
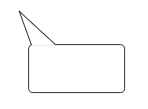 | Caption | Caption icons are most often used instead of right and left comments if you need to explain some fragment of the algorithm. It is rarely used in algorithms converted into programs. More often this is a way to attract attention in algorithms written in human languages (for example, for doctors), or if customers want to clarify their descriptions with the help of some highlighted points. | |||||||||||||||
 | Parallel processes | The Parallel process icon is used to launch multiple tasks or processes that run simultaneously. Each of the arrows in this icon can represent a different thread or task. | |||||||||||||||
 | Loop arrow | Arrows represent repeating events, for which the exact number of repetitions is unknown. For example, checking to see if the kettle is boiling until it does. | |||||||||||||||
 | Silhouette arrow | It is used only in one place in the diagram: to indicate the continuation of an action and transition to the next branch of the silhouette (see below). |
Sometimes, other icons are used as well, such as a "simple input" (looks like the top of the Output icon) or a rounded rectangle. Some programs do not allow using all icons. But in general, the table provides an almost exhaustive set of fragments diagrams are constructed from.
Creating simple visual diagrams ("primitives")
DRAKON language diagrams are built according to certain laws.
As already mentioned, the main building blocks of the diagram are icons. However, in order for them to interact properly, they need lines of communication.
Communication lines can be horizontal or vertical, BUT
Actions take place only vertically.
Horizontal connections are indicated only when choosing one of several options or for some other auxiliary actions. If there are no auxiliary actions such as entering parameters into a function or comments for a given algorithm, then the entire algorithm will be placed on a single vertical "skewer".
For example, we need to get the sum of two numbers. We receive both numbers from the user and output the data, say, to the console using the printf or Print function. What would a diagram look like in the DRAKON language? Well, it would be pretty simple:
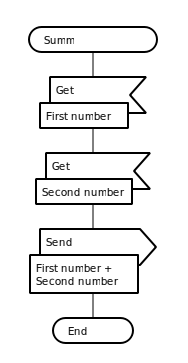
Figure 1. Algorithm for sum of two numbers
If we want to program this code, then most likely we will need a function, and it will have to accept parameters (auxiliary action). Then we will draw it this way:
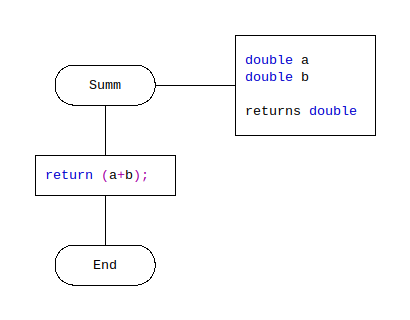
Figure 2. Summation as a function.
The code generated by the program according to my diagram:
double Summ(double a, double b) {
        // item 6
        return (a+b);
    }
So, the first rule: the main direction of DRAKON diagram is from top to bottom. That is, if the algorithm is executed linearly, its primitive will always be drawn vertically, and it must be executed from top to bottom. Therefore, the diagram does not need arrows. Everything is clear without them.
But what if we need branching? What if some actions occur only under certain conditions? For example, entering a trade only based on the intersection of moving averages will be determined using the question icon:
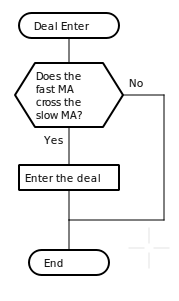
Figure 3. Algorithm for entering a trade by crossing moving averages
Each condition icon always has two outputs: one from the bottom, and one from the right. In other words, any actions in the algorithm always occur from top to bottom and from left to right. Arrows are not needed again. When testing an algorithm, we simply follow the lines until we reach the end.
Sometimes, a decision must be made on the basis of not two, but three or more options. Let's say a user pressed a certain key. Depending on which key the user pressed, the program should perform certain actions. Of course, we can draw this using ordinary questions, but the diagram will turn out to be cumbersome.
A selection construct is much better suited in this case.
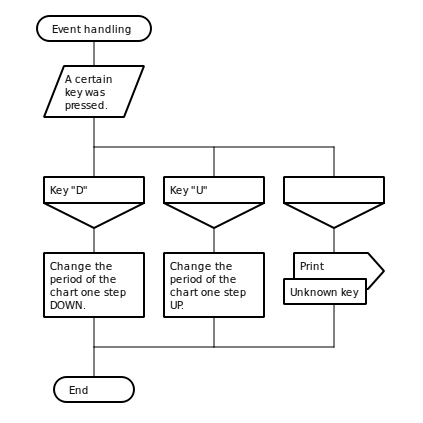
Figure 4. Handling keystrokes
Note that the last option icon is left blank. In MQL, this option corresponds to the default operator. The default action is performed if no other option is suitable.
Using this example, one can trace another DRAKON rule: all vertical branches are located from left to right, and the more to the right the option, the worse it is. The leftmost option is sometimes called the "royal path" or "happy path".
If the options are equivalent, they are simply arranged according to some criterion. For example, I arranged them by button letters alphabetical order.
Sometimes, it is necessary to go to the beginning of a block without reaching the end of the program. These are DO-WHILE loops.
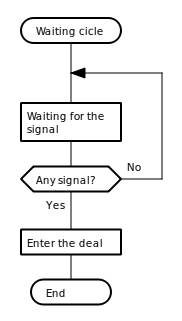
Figure 5. Wait for a signal till it appears. The "Wait for signal" action is executed at least once under any circumstances.
Or the same loop can be rewritten so that it first checks the condition, and only then performs some actions.
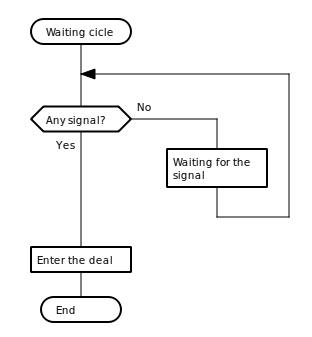
Figure 6. Wait for a signal till it appears. The "Waiting for a signal" action may never be executed if the signal has already arrived.
In any case, the arrow here is already a necessary element. Without it, the diagram will be much more difficult to read.
There is one more important rule about loops. The loop may have any number of exits, but there may be only one entry. In other words, we cannot drag an arrow from an arbitrary place in the program to an arbitrary place in the loop. We must always return to the beginning.
DRAKON silhouette diagram
Since DRAKON is a visual language, it is important that its diagrams are easy to read. To achieve this, it is better that the entire diagram is included on the screen (or sheet) entirely.
This requirement is not always feasible, but we must strive for it. Another way of placing language icons called Silhouette can help with this.
A silhouette is simply a way to break a complex function into its component parts, into stages of execution, but at the same time leave it as a single whole.
Here, for example, is what tick processing might look like in a standard EA, written in the form of a silhouette.
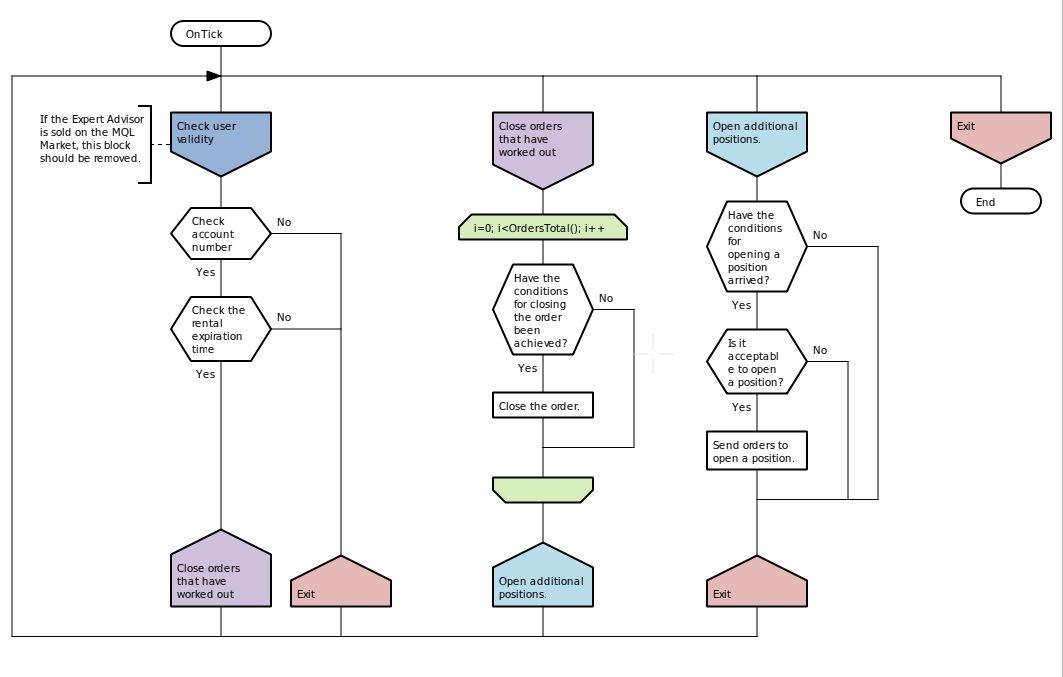
Figure 7. Silhouette is the second main diagram configuration in the DRAKON language
At the top of each branch is its conventional name in human language. Below is the transition address - where to redirect the flow of commands after this branch is completed. As a rule, the transition is made to a neighboring branch, but there are times when you need to go somewhere else.
If the transition is further to the right, then the name of the branch is simply indicated.
If the transition occurs to the beginning of the same branch or to a branch to the left, the markers of the beginning and end of the corresponding branches are marked with a black triangle:
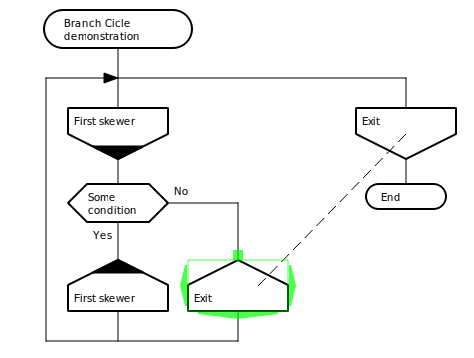
Figure 8. Loop in one branch silhouette
If you have to use such a loop, make sure that you have an exit condition that takes the program to another branch. Otherwise, the loop might become endless.
I try to avoid such loops in my diagrams. In the problems that I solve, I can do without them in 95.4% of cases...
In fact, the silhouette is a state diagram. Usually, editors understand each branch exactly this way - as certain states of the process at a given moment and interpret the silhouette as an endless loop with a choice of states using the switch-case operator inside. This is why we need labels at the entry and exit: the program needs to know where to switch, and a user needs to see which fragment is active at one time or another.
Entry to the branch is possible only through its start. The exit from the last branch is carried out through the "end" icon.
Some nuances of DRAKON diagrams
I hope you noticed that in none of the diagrams above do the lines intersect unless there is a connection. This is a fundamental point that adds clarity to the diagrams. There should be no intersections. There can only be path merging or moving by marks. Where there is an intersection, we can choose this path when moving towards a solution.
On Figure 7, the branch for adding additional positions (third from the left) is a bit inaccurate. There should be as few parallel lines in the figure as possible. This rule also adds clarity. To my regret, Fabula does not know how to draw branching correctly. Although this is not an error, it is rather an interpretation inaccuracy.
The exception to the "Move either down or right" rule is the bottom-most line of the diagram, which links the silhouette "skewers" into a single whole. It always returns the process to the beginning to select a new state. Therefore, we move along it from right to left, towards the arrow.
In principle, almost all programs allow us to create several diagrams on one sheet. Sometimes, this can be justified.
If the diagrams are small and mostly vertical (and the silhouettes can be made very compact)... And there is sufficient distance between the diagrams (or they are well marked with color, or even better - with additional borders)... If all these conditions are met, the clarity of the diagrams when combined can increase.
If your diagrams are intended to be printed on paper, it makes sense to try to arrange them as compactly as possible using the recommendations in the previous paragraph.
However, in all other cases it is better to place each diagram in a separate space. Especially, if there are large "silhouettes" among them or these diagrams are intended for printing on paper in black and white. Most often, DRAKON is more about clarity, not compactness. It is visualization that reduces mental effort and allows these efforts to be directed towards developing effective solutions.
Importing diagrams from DRAGON to MQL
When I compose a good and large algorithm using graphical icons, I want to minimize the effort of converting diagrams into code.
As a rule, I use DRAKON Editor for these purposes.
After opening the editor, the first thing you need to do is create (or open an existing) file.
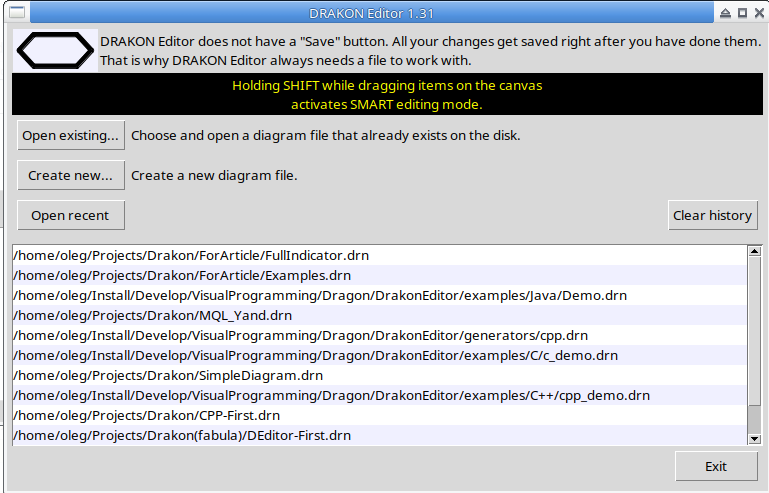
Figure 9. DRAKON Editor - File creation dialog
DRAKON Editor (DE) uses autosave: all changes on the screen are immediately saved to a file.
Pay attention to the text about the SMART editing mode highlighted in red..
We will convert the diagrams into Java. This is the simplest option if you do not want to write a special parser for MQL (I certainly do not). The structure of Java files is as close as possible to the structure of MQL5 programs, so the generated files will be compiled with minimal modifications.
In the upper left corner of the main program window, there is a button to open the file description and the "File menu where you can also find this item:

Figure 10. DRAKON Editor - File properties menu and button
The file description is functional!!!
In addition to general explanations, we can insert two sections that will be completely transferred to the ready-made program. While there is nothing there yet, these sections will look very simple:
===header===

===class===
class Main {
After "===class===", it is sufficient to add "class Main {". Note that there is one curly bracket here. The second one is installed by the editor during generation.
There can only be one class in the file.
Everything inserted after the "===header===" string is pasted by DE into your file directly. Therefore, if you write a program entirely in the DRAKON language, you should place all global variables, #include statements, descriptions of structures and enumerations, etc. in this section.
Everything located before the "===header===" section is ignored. We can really insert any text descriptions here.
If you write a simple indicator, "class Main {" and a closing curly bracket should be removed from the final file.
If you understand how OOP works, then you can use the class description directly in the same header, as usual, excluding the implementation of functions. The functions will be implemented in the diagrams. Just keep in mind that Java has a class, while MQL has functions that operate in the global scope.
I want to demonstrate how to create a simple NR4 indicator that marks a candle if its size is smaller than the size of other candles in front of it. The number of "large" candles is specified in the inputs. The appearance of such a candle often indicates the likelihood of an imminent sharp movement.
===header===
//+------------------------------------------------------------------+
//|                                                          NR4.mq5 |
//|                                       Oleg Fedorov (aka certain) |
//|                                   mailto:coder.fedorov@gmail.com |
//+------------------------------------------------------------------+
#property copyright "Oleg Fedorov (aka certain)"
#property link      "mailto:coder.fedorov@gmail.com"
#property version   "1.00"
#property indicator_chart_window
#property indicator_buffers 2
#property indicator_plots   2
//--- plot NRBars
#property indicator_label1  "NRBarsUp"
#property indicator_type1   DRAW_ARROW
#property indicator_color1  clrRed
#property indicator_style1  STYLE_SOLID
#property indicator_width1  0
//--- plot NRBars
#property indicator_label2  "NRBarsDn"
#property indicator_type2   DRAW_ARROW
#property indicator_color2  clrRed
#property indicator_style2  STYLE_SOLID
#property indicator_width2  0
//--- input variables
input int NRPeriod=4;

//--- indicator buffers
double         NRBarsBufferUp[];
double         NRBarsBufferDn[];

===class===
class Main {
Close the file description.
Now we need to inform the editor that our file should be converted into Java.
Go to "File" -> "File properties" and select Java in the top line of the new dialog window.
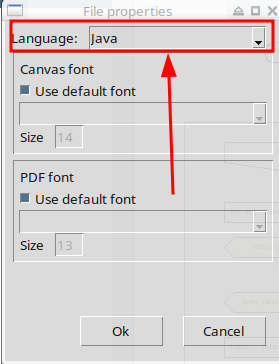
Figure 11. Selecting the language the diagram is converted into
Setup is complete. Now we can start programming the algorithm.
We can write any text in icons, but in this case, each icon will contain a code fragment that goes into the final file. If this is a demonstration for a customer, it is enough to simply write comments in human language, but if you want to store compiled code in diagrams, write what should happen in sufficient detail... It is the second case for me.
The Insert icon in DE does not work during compilation, so we need to use the Action icon.
Each function must have its own diagram.
DE explicitly requires this (other editors are more "loyal"). Here you cannot create multiple diagrams without creating multiple diagram entities using a toolbar button or pressing Ctrl+N.
In my case, there are only two functions: OnInit and OnCalculate. Here they are:
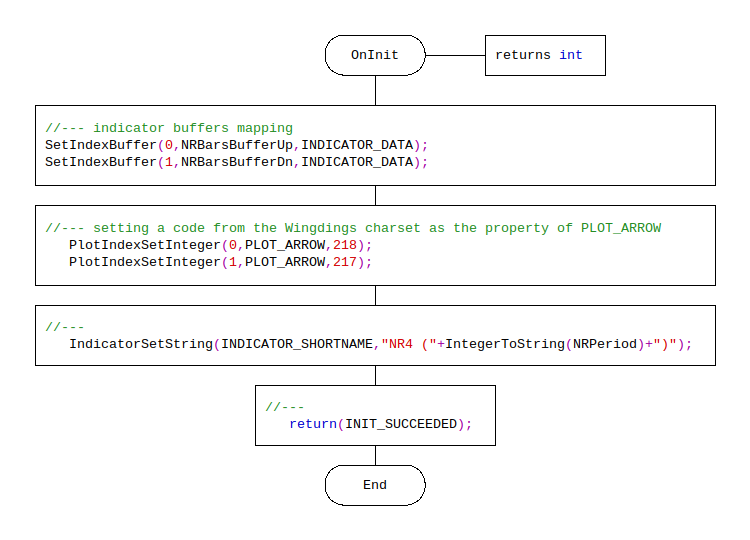
Figure 12. OnInit function
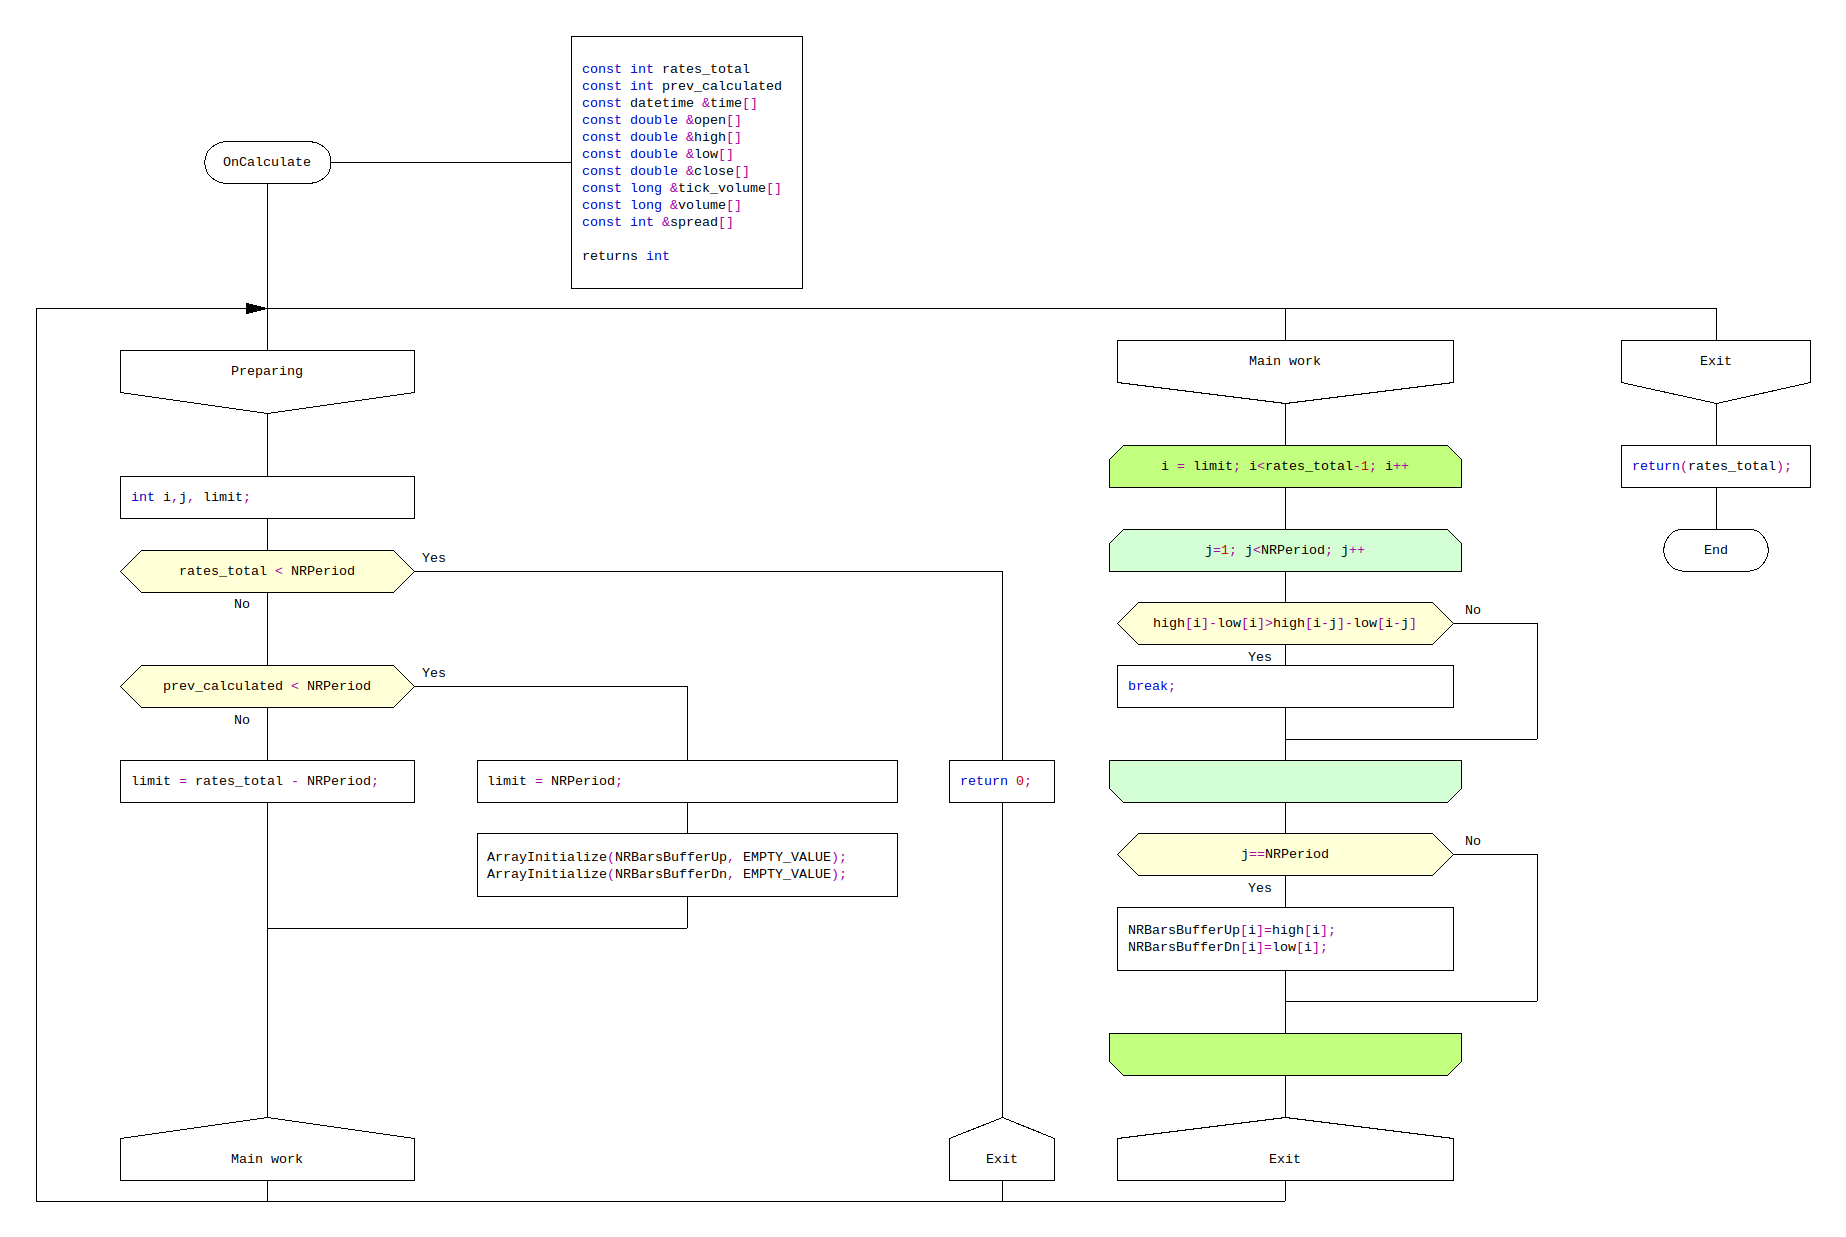
Figure 13. OnCalculate function
If the image texts are too small, download and install DRAKON Editor (the website has detailed instructions and all dependencies are described). Then open the file with the diagrams attached below.
Convert the diagram into a compiled code (DRAKON -> Generate code). If there are errors in the diagram (for example, a line does not reach another line or icon), DE warns you about this in the panel below. If there are no errors, a file with the *.java extension will appear in the project file folder.
Save it to your indicators directory, change the extension to *.mq5, remove the class description if necessary, compile and run...
Here is the contents of my file before removing unnecessary elements:
// Autogenerated with DRAKON Editor 1.31
//+------------------------------------------------------------------+
//|                                                          NR4.mq5 |
//|                                       Oleg Fedorov (aka certain) |
//|                                   mailto:coder.fedorov@gmail.com |
//+------------------------------------------------------------------+
#property copyright "Oleg Fedorov (aka certain)"
#property link      "mailto:coder.fedorov@gmail.com"
#property version   "1.00"
#property indicator_chart_window
#property indicator_buffers 2
#property indicator_plots   2
//--- plot NRBars
#property indicator_label1  "NRBarsUp"
#property indicator_type1   DRAW_ARROW
#property indicator_color1  clrRed
#property indicator_style1  STYLE_SOLID
#property indicator_width1  0
//--- plot NRBars
#property indicator_label2  "NRBarsDn"
#property indicator_type2   DRAW_ARROW
#property indicator_color2  clrRed
#property indicator_style2  STYLE_SOLID
#property indicator_width2  0
//--- input variables
input int NRPeriod=4;

//--- indicator buffers
double         NRBarsBufferUp[];
double         NRBarsBufferDn[];

class Main {

    int OnCalculate(const int rates_total, const int prev_calculated, const datetime &time[], const double &open[], const double &high[], const double &low[], const double &close[], const long &tick_volume[], const long &volume[], const int &spread[]) {
        // item 15
        int i,j, limit;
        // item 16
        if (rates_total < NRPeriod) {
            // item 19
            return 0;
        } else {
            // item 20
            if (prev_calculated < NRPeriod) {
                // item 23
                limit = NRPeriod;
                // item 24
                ArrayInitialize(NRBarsBufferUp, EMPTY_VALUE);
                ArrayInitialize(NRBarsBufferDn, EMPTY_VALUE);
            } else {
                // item 25
                limit = rates_total - NRPeriod;
            }
            // item 310001
            i = limit;
            while (true) {
                // item 310002
                if (i<rates_total-1) {

                } else {
                    break;
                }
                // item 340001
                j=1;
                while (true) {
                    // item 340002
                    if (j<NRPeriod) {

                    } else {
                        break;
                    }
                    // item 36
                    if (high[i]-low[i]>high[i-j]-low[i-j]) {
                        // item 39
                        break;
                    } else {

                    }
                    // item 340003
                    j++;
                }
                // item 40
                if (j==NRPeriod) {
                    // item 43
                    NRBarsBufferUp[i]=high[i];
                    NRBarsBufferDn[i]=low[i];
                } else {

                }
                // item 310003
                i++;
            }
        }
        // item 48
        return(rates_total);
    }

    int OnInit() {
        // item 11
        //--- indicator buffers mapping
        SetIndexBuffer(0,NRBarsBufferUp,INDICATOR_DATA);
        SetIndexBuffer(1,NRBarsBufferDn,INDICATOR_DATA);
        // item 12
        //--- setting a code from the Wingdings charset as the property of PLOT_ARROW
           PlotIndexSetInteger(0,PLOT_ARROW,218);
           PlotIndexSetInteger(1,PLOT_ARROW,217);
        // item 13
        //---
           IndicatorSetString(INDICATOR_SHORTNAME,"NR4 ("+IntegerToString(NRPeriod)+")");
        // item 14
        //---
           return(INIT_SUCCEEDED);
    }
}
Let me remind you once again: to let this simple indicator work, remove the text highlighted in yellow both above and below. Here I deliberately did not use a styler so that readers could evaluate exactly how this file would be formatted by the DE automation.
Reading this code is more difficult than if I wrote it by hand but it works. But we do not have to read it, we should look at the diagrams. ;-)
Conclusion
If you are a developer and you liked DRAKON, feel free to use any of the diagram creation tools I mentioned above. I recommend that you test each of the listed editors yourself and form your own opinion about what is better for you personally. In fact, they are all relatively simple.
If you want to arrange your work with customers in an orderly fashion, give them a link to Dragon.Tech or drakonhub, briefly explain how to create a project in human language and how the icons relate to each other and tell them that it is okay to describe what they want to see in words. The main thing is to have a clear structure.
If you are a customer and have reached this point, then you already know what to do. ;-)
There are a lot of topics left behind the scenes: the use of DRAGON in interactive presentations, ways of arranging any information (not just computer programs) for easier memorization, criticism of the DRAKON language and all graphical languages, etc.
If you are interested, write me a private message or leave your comments to this article. I am open for discussions. You may also visit V.D. Parondzhanov's website. You can find a lot more stuff there...
I hope that I was able to spark interest in this approach and that at least a couple of people who read this article will start using this wonderful tool in their work.
If anyone needs source codes for other algorithms described in this article, please contact me and I will send them to you.
Attachment. The archive contains the DRAKON Editor project file containing the indicator algorithm described in the previous section. This file allows generating a completely operational code for NR4 indicator.
Translated from Russian by MetaQuotes Ltd.
Original article: https://www.mql5.com/ru/articles/13324
Warning: All rights to these materials are reserved by MetaQuotes Ltd. Copying or reprinting of these materials in whole or in part is prohibited.
This article was written by a user of the site and reflects their personal views. MetaQuotes Ltd is not responsible for the accuracy of the information presented, nor for any consequences resulting from the use of the solutions, strategies or recommendations described.
 MQL5 Wizard Techniques you should know (Part 11): Number Walls
- Free trading apps
- Over 8,000 signals for copying
- Economic news for exploring financial markets
You agree to website policy and terms of use
Nothing special. The beginning is so surreal:"The DRAGON language was developed by joint efforts of the Federal Space Agency", for a moment I thought I was reading Strugatsky.
It's a scary sight! As I imagine how many diagrams the Buran software developers had to draw in order to perform an automatic landing, tears come to my eyes!
It's a horrible sight! As I imagine how many diagrams the Buran software developers had to draw to make an automatic landing, tears come to my eyes!
You might want to give Flowgorithm a try.
It looks very interesting, thanks.
Chat style console is not so good for me, but it is many interesting things there.
I found Flowgorithm is more for educational purpose than real world programming. Drakon is closer to what I'm looking for : closer to Grafcet which is not well known outside of France and Automation field but it's a gem ;) https://www.researchgate.net/profile/Paul-Baracos-2/publication/243782363_Grafcet_step_by_step/links/588b7e3d45851567c93c9cdb/Grafcet-step-by-step.pdf
I had been taught a long time ago in french engineering school (not computer science but tradional engineering field) by a teacher who was part of the comitee. Before learning it I had no interesting in coding and was almost last, with it I became first :)
Then I forgot about it since I was in traditional software engineering. After decades I realised there's no real modeling in traditional software engineering as nobody actually uses UML apart from drafts and I realise Grafcet or equivalent + a bit of UML could be a real way to be on par with other engineering fields. Like Drakon it is first aimed at specification but due to its simplicity and fractality it can easily map with code so much people think that SFC is equivalent to Grafcet whereas SFC is indeed derived from Grafcet it is only a coding language for a specific industry (automation) not meant for specification.
As said here "one of the main advantages of GRAFCET is the specification of hierarchical structures" https://www.sciencedirect.com/science/article/pii/S2405896319314387 and it is exclusively event driven so very suitable for trading algorithms ;)