Nine Lives of PSAR MT5
- Indikatoren
- Version: 4.2
- Aktualisiert: 18 November 2021
- Aktivierungen: 5

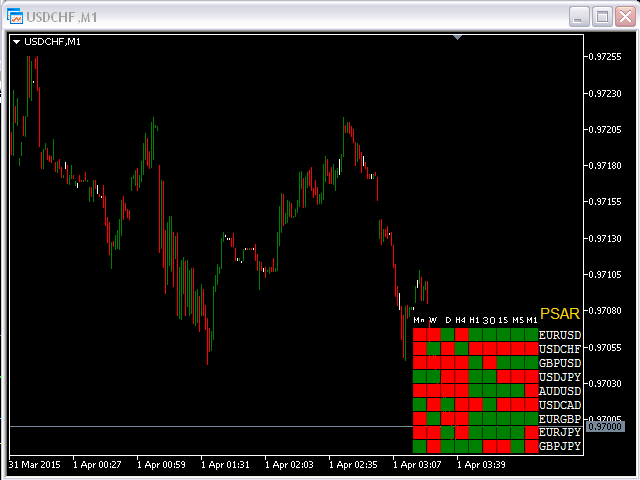
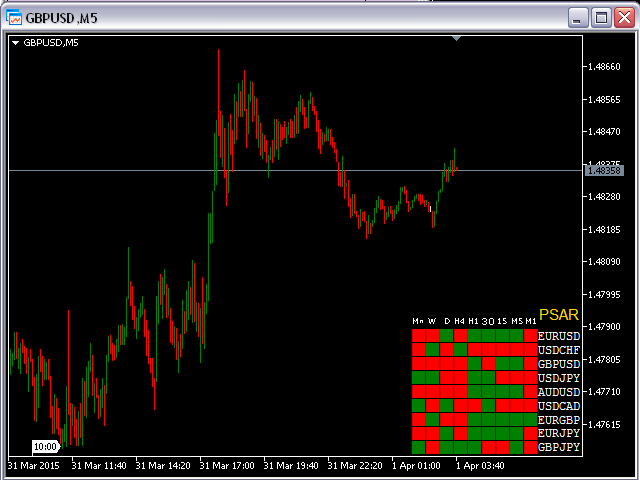
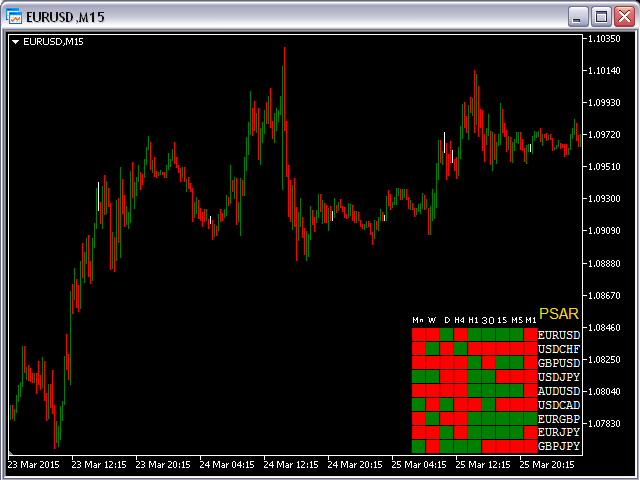
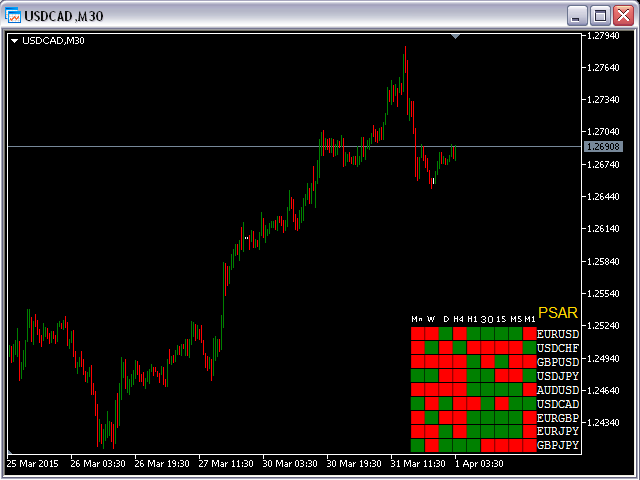
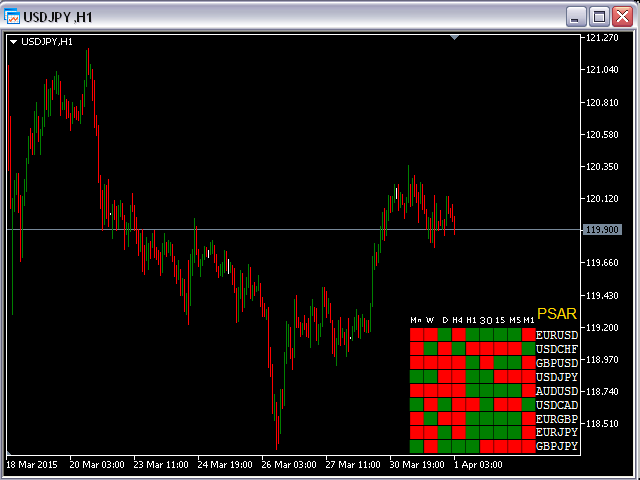
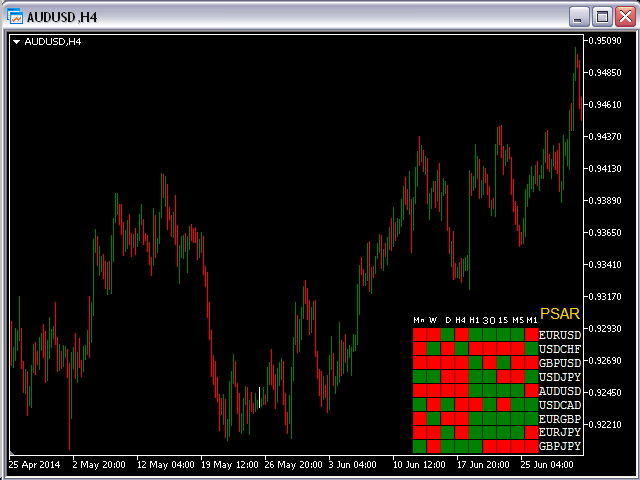
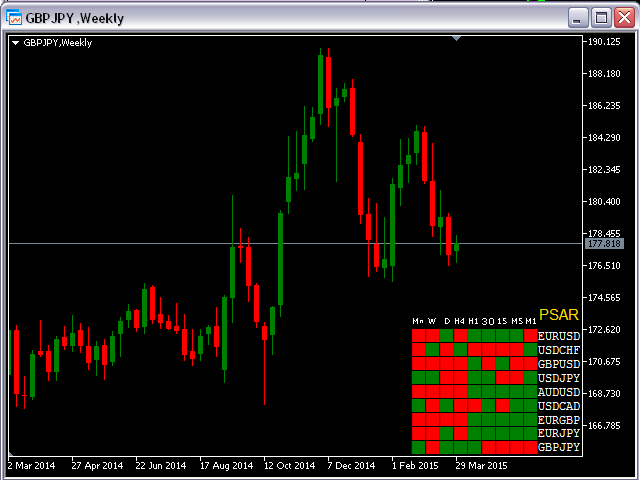
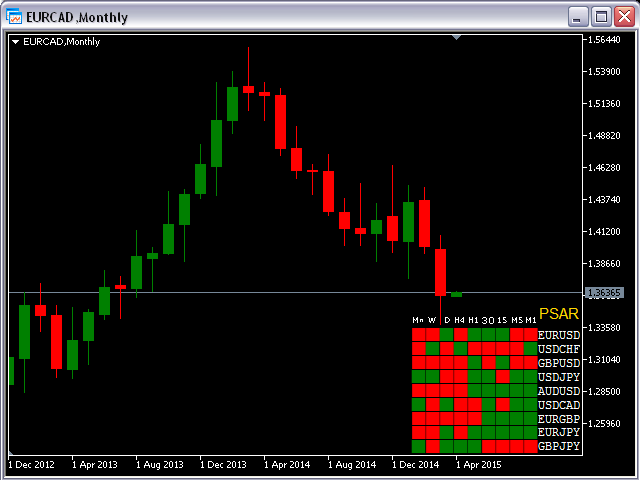
Dieser Indikator zeigt einen Aufwärtstrend(grünes Quadrat) an, wenn ein parabolischer SAR-Wert unter dem aktuellen Kurs liegt, und einen Abwärtstrend(rotes Quadrat), wenn ein parabolischer SAR-Wert über dem aktuellen Kurs liegt, und zwar in allen Zeitrahmen für jedes Währungspaar.
Eingabeparameter
- from Symb1 to Symb9 - Sie können jedes dieser Symbole in ein beliebiges legales Währungspaar ändern, das auf Ihrer Plattform existiert.
- step=0.0; - Stellt den Beschleunigungsfaktor für den PSAR-Indikator dar.
- maximum=0.2; - Maximaler Wert für den Beschleunigungsfaktor für den PSAR-Indikator
- SymbColor=clrWhite; - Sie können die Farbe aller Beschriftungen ändern.
Achtung
Bevor Sie diesen Indikator verwenden, müssen Sie alle Charts (alle TF) für alle 9 Währungspaare öffnen.