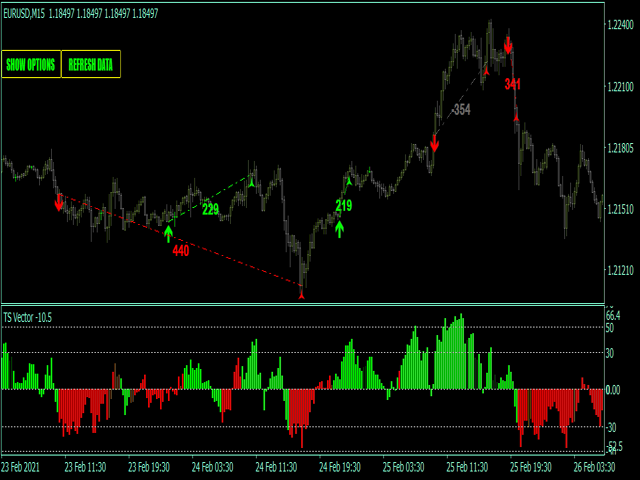
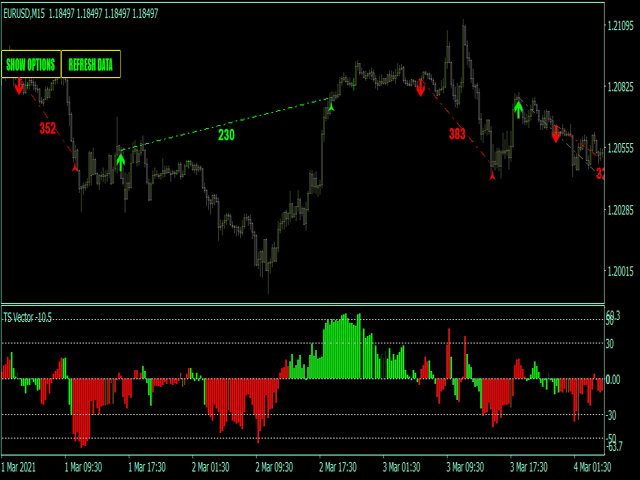
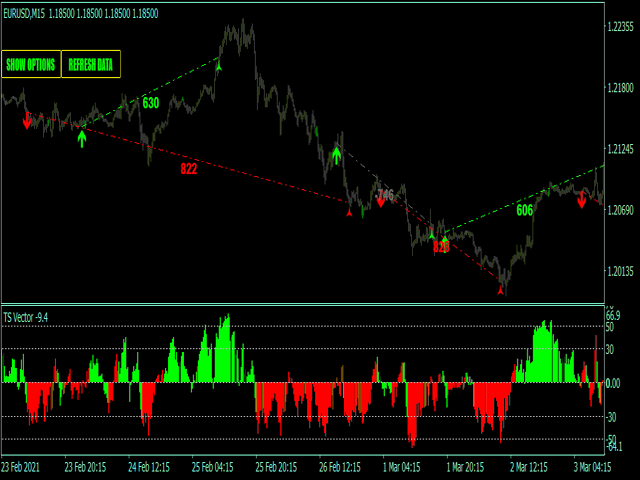
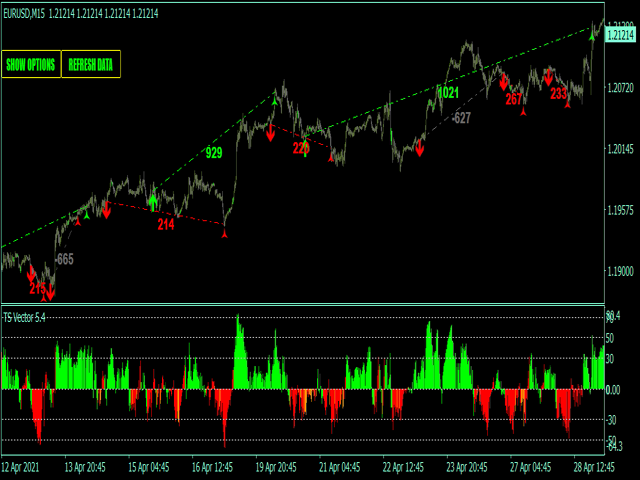
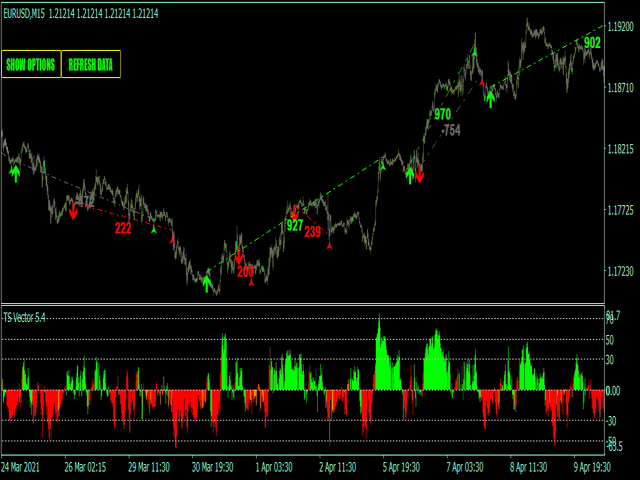
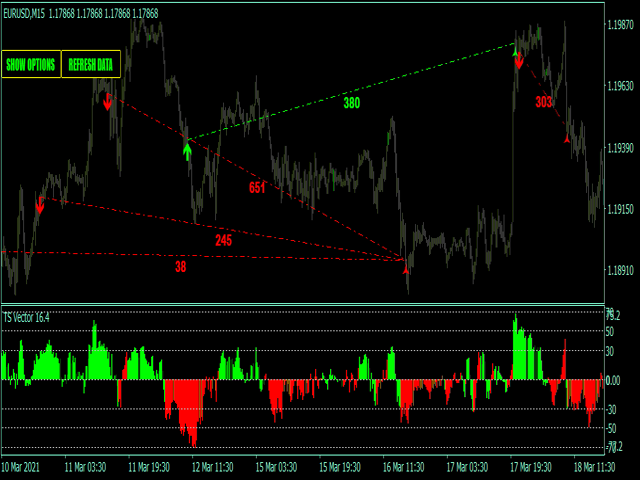
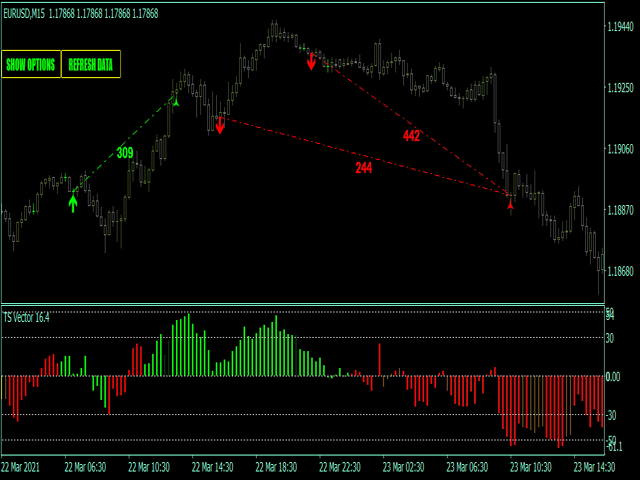
Trend speed vector oscillator
- Indikatoren
- Version: 1.1
- Aktivierungen: 5

Trendgeschwindigkeitsvektor - ist der Oszillator für den manuellen Handel. Das System misst die Trendrichtung und deren Geschwindigkeit.
Das Histogramm zeigt 4 Farben:
- Limone --> Starke Aufwärtsbewegung mit guter Anstiegsgeschwindigkeit;
- Grün --> Aufwärtsbewegung mit geringer Gewinngeschwindigkeit
- Rot --> Starke Abwärtsbewegung mit guter Verstärkungsgeschwindigkeit;
- Orange --> Abwärtsbewegung mit geringer Gewinngeschwindigkeit
Grüne und orangefarbene Histogramme zeigen schwache Marktbewegungen an und thу diese Stellen von den Signalpunkten ausgeschlossen. Der Kaufpfeil wird während einer starken Abwärtsbewegung eingezeichnet, wenn die Gewinngeschwindigkeit niedrig ist und ein umgekehrter Hintergrund erscheint. Der Verkaufspfeil wird bei einer starken Aufwärtsbewegung eingezeichnet, wenn die Aufwärtsgeschwindigkeit niedrig ist und ein umgekehrter Hintergrund nach unten erscheint.
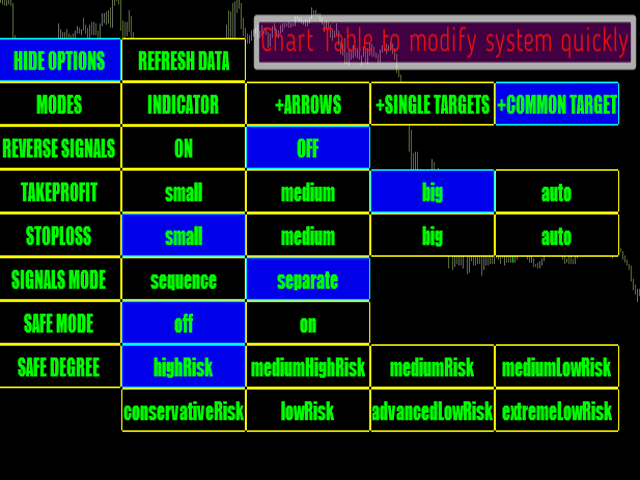
Die einstellbaren Eingaben des Hauptindikators :
- marketTrendPeriod - Zeitraum für die Berechnungen des Hauptindikators;
- marketSpeedTrigger - misst von 10 - bis 60 ;
Eigenschaften des Hauptindikators
- Die Signale werden nicht nachgemalt, verspätet oder verschwinden;
- Jedes Signal kommt bei der Eröffnung eines neuen Balkens (das System verwendet nur bestätigte Signale);
- Der Indikator verfügt über Alerts, Mail- und Push-Benachrichtigungen (ermöglicht den Handel vom PC aus, vom Smartphone/von der Handy-App);
- Der Indikator hat Gewinn/Verlust-Ziele;
Empfehlungen für den Handel
- EURUSD, GBPUSD, GBPJPY, AUDUSD, USDJPY;
- Beste Zeitrahmen - Zeitrahmen M5-M30;